| Param | Original file | Final file |
|---|---|---|
| Filename | modeM0/AS1A14_066T02_9000006546_56028cztM0_level2.fits | modeM0/AS1A14_066T02_9000006546_56028cztM0_level2_quad_clean.evt |
| Size (bytes) | 772,344,000 | 78,914,880 |
| Size | 736.6 MB | 75.3 MB |
| Events in quadrant A | 7,905,225 | 523,272 |
| Events in quadrant B | 3,377,496 | 676,062 |
| Events in quadrant C | 10,231,385 | 214,709 |
| Events in quadrant D | 6,570,602 | 521,724 |
| Mode M9 | |||
|---|---|---|---|
| Quadrant | BADHDUFLAG | Total packets | Discarded packets |
| A | 0 | 17 | 0 |
| B | 0 | 18 | 0 |
| C | 0 | 18 | 0 |
| D | 0 | 18 | 0 |
| Mode M0 | |||
|---|---|---|---|
| Quadrant | BADHDUFLAG | Total packets | Discarded packets |
| A | 0 | 28070 | 2 |
| B | 0 | 14625 | 2 |
| C | 0 | 34949 | 2 |
| D | 0 | 24062 | 2 |
| Mode SS | |||
|---|---|---|---|
| Quadrant | BADHDUFLAG | Total packets | Discarded packets |
| A | 0 | 130 | 0 |
| B | 0 | 130 | 0 |
| C | 0 | 130 | 0 |
| D | 0 | 130 | 0 |
| Quadrant | Total seconds | Saturated seconds | Saturation percentage |
|---|---|---|---|
| A | 6506 | 1409 | 21.656932% |
| B | 6506 | 102 | 1.567784% |
| C | 6506 | 4273 | 65.677836% |
| D | 6506 | 713 | 10.959115% |
Noise dominated data is calculated using 1-second bins in cleaned event files. If a bin has >2000 counts, and if more than 50% of those come from <1% of pixels, then it is considered to be noise-dominated and hence unusable.
| Quadrant | # 1 sec bins | Bins with >0 counts | Bins with >2000 counts | High rate bins dominated by noise | Noise dominated (total time) | Noise dominated (detector-on time) | Marked lightcurve |
|---|---|---|---|---|---|---|---|
| A | 7641 | 6507 | 1183 | 1183 | 15.48% | 18.18% |  |
| B | 7641 | 6507 | 38 | 38 | 0.50% | 0.58% |  |
| C | 7641 | 6502 | 2392 | 2392 | 31.30% | 36.79% |  |
| D | 7641 | 6507 | 709 | 709 | 9.28% | 10.90% |  |
Top three noisy pixels from each quadrant. If the there are fewer than three noisy pixels in the level2.evt file, extra rows are filled as -1
| Pixel properties | Quadrant properties | ||||||
|---|---|---|---|---|---|---|---|
| Quadrant | DetID | PixID | Counts | Sigma | Mean | Median | Sigma |
| A | 15 | 32 | 4665628 | 29297.02 | 635 | 618 | 159.2 |
| A | 0 | 8 | 433933 | 2721.29 | 635 | 618 | 159.2 |
| A | 12 | 115 | 147265 | 920.97 | 635 | 618 | 159.2 |
| B | 4 | 171 | 128173 | 855.91 | 695 | 670 | 149.0 |
| B | 0 | 213 | 90749 | 604.69 | 695 | 670 | 149.0 |
| B | 0 | 199 | 69812 | 464.14 | 695 | 670 | 149.0 |
| C | 13 | 3 | 8871514 | 92837.31 | 338 | 334 | 95.6 |
| C | 12 | 252 | 19072 | 196.09 | 338 | 334 | 95.6 |
| C | 14 | 254 | 8717 | 87.73 | 338 | 334 | 95.6 |
| D | 11 | 129 | 2378485 | 12577.75 | 655 | 626 | 189.1 |
| D | 6 | 239 | 756020 | 3995.68 | 655 | 626 | 189.1 |
| D | 2 | 62 | 419210 | 2214.11 | 655 | 626 | 189.1 |
Histogram calculated using DETX and DETY for each event in the final _common_clean file
| Quadrant A | 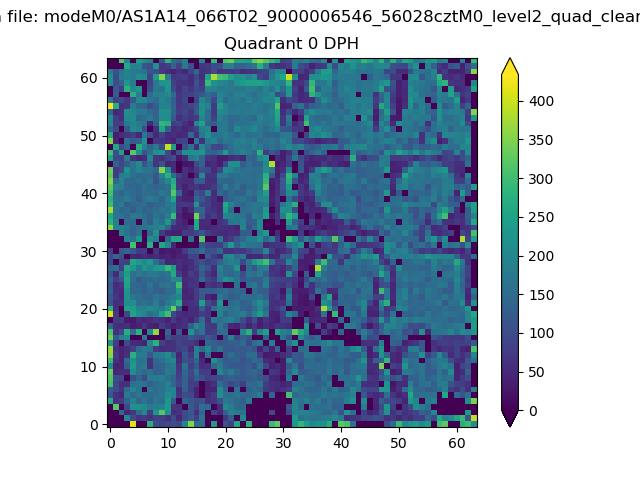 |
 |
Quadrant B |
|---|---|---|---|
| Quadrant D | 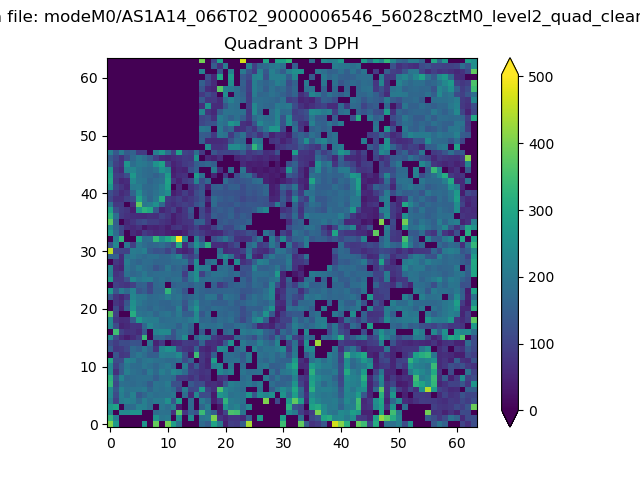 |
 |
Quadrant C |
| Plot type | Count rate plots | Images |
|---|---|---|
| Comparison with Poisson distribution Blue bars denote a histogram of data divided into 1 sec bins. Red curve is a Poisson curve with rate = median count rate of data. |
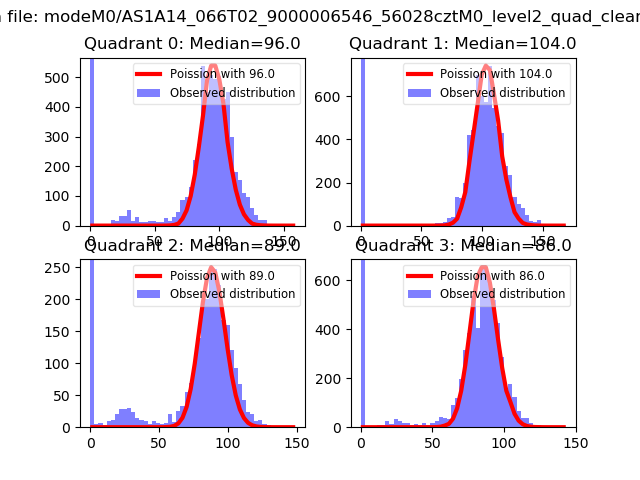 |
 |
| Quadrant-wise count rates Data is divided into 100 sec bins |
 |
|
| Module-wise count rates for Quadrant A Data is divided into 100 sec bins |
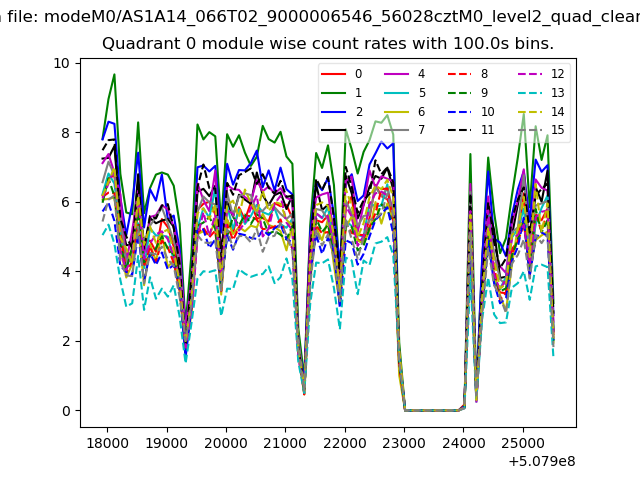 |
 |
| Module-wise count rates for Quadrant B Data is divided into 100 sec bins |
 |
 |
| Module-wise count rates for Quadrant C Data is divided into 100 sec bins |
 |
 |
| Module-wise count rates for Quadrant D Data is divided into 100 sec bins |
 |
 |
| Parameter | Plot |
|---|---|
| CZT HV Monitor | 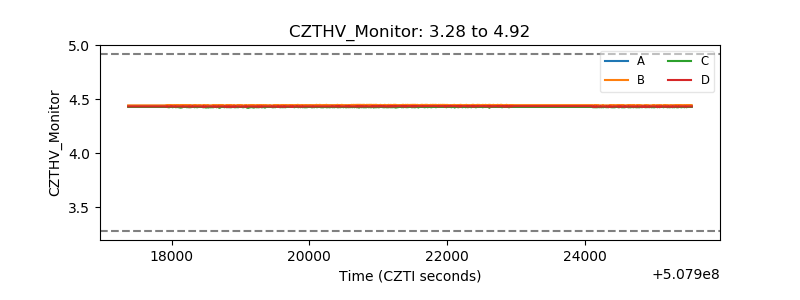 |
| D_VDD |  |
| Temperature 1 | 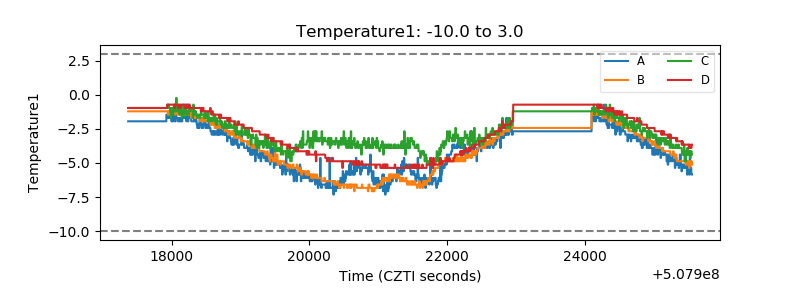 |
| Veto HV Monitor |  |
| Veto LLD |  |
| Alpha Counter | 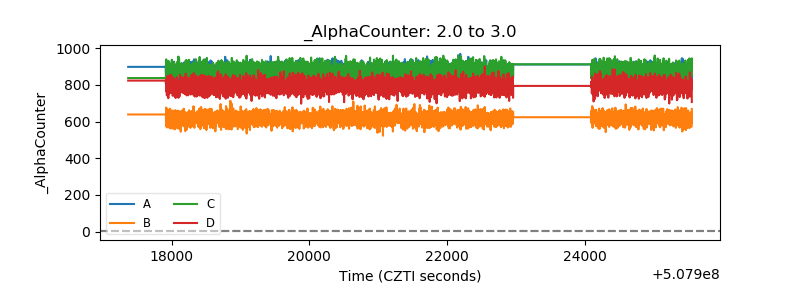 |
| _CPM_Rate | 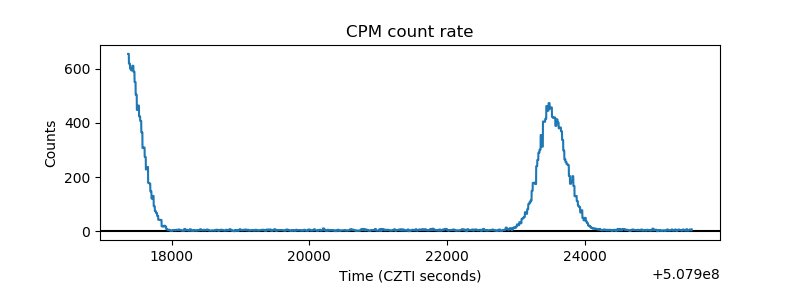 |
| CZT Counter | 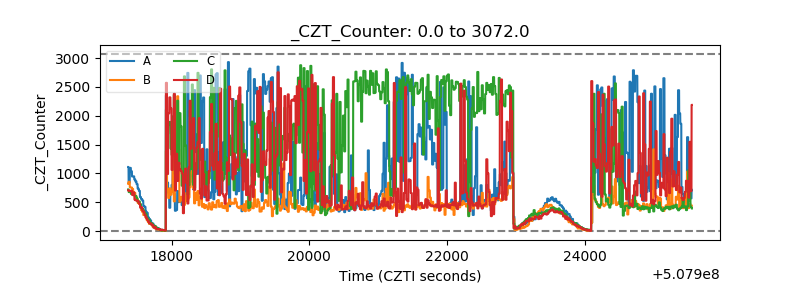 |
| +2.5 Volts monitor | 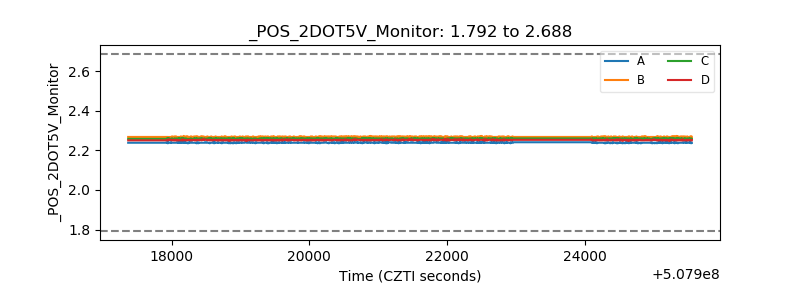 |
| +5 Volts monitor |  |
| _ROLL_ROT |  |
| _Roll_DEC |  |
| _Roll_RA |  |
| Veto Counter |  |