| Param | Original file | Final file |
|---|---|---|
| Filename | modeM0/AS1A14_066T02_9000006546_56030cztM0_level2.fits | modeM0/AS1A14_066T02_9000006546_56030cztM0_level2_quad_clean.evt |
| Size (bytes) | 793,897,920 | 89,838,720 |
| Size | 757.1 MB | 85.7 MB |
| Events in quadrant A | 10,114,754 | 466,543 |
| Events in quadrant B | 4,074,949 | 698,631 |
| Events in quadrant C | 3,842,284 | 624,007 |
| Events in quadrant D | 10,805,989 | 435,711 |
| Mode M9 | |||
|---|---|---|---|
| Quadrant | BADHDUFLAG | Total packets | Discarded packets |
| A | 0 | 16 | 0 |
| B | 0 | 16 | 0 |
| C | 0 | 16 | 0 |
| D | 0 | 16 | 0 |
| Mode M0 | |||
|---|---|---|---|
| Quadrant | BADHDUFLAG | Total packets | Discarded packets |
| A | 0 | 34987 | 2 |
| B | 0 | 17218 | 2 |
| C | 0 | 16757 | 2 |
| D | 0 | 37112 | 5 |
| Mode SS | |||
|---|---|---|---|
| Quadrant | BADHDUFLAG | Total packets | Discarded packets |
| A | 0 | 148 | 0 |
| B | 0 | 148 | 0 |
| C | 0 | 148 | 0 |
| D | 0 | 148 | 0 |
| Quadrant | Total seconds | Saturated seconds | Saturation percentage |
|---|---|---|---|
| A | 7100 | 2385 | 33.591549% |
| B | 7100 | 228 | 3.211268% |
| C | 7101 | 151 | 2.126461% |
| D | 7100 | 2142 | 30.169014% |
Noise dominated data is calculated using 1-second bins in cleaned event files. If a bin has >2000 counts, and if more than 50% of those come from <1% of pixels, then it is considered to be noise-dominated and hence unusable.
| Quadrant | # 1 sec bins | Bins with >0 counts | Bins with >2000 counts | High rate bins dominated by noise | Noise dominated (total time) | Noise dominated (detector-on time) | Marked lightcurve |
|---|---|---|---|---|---|---|---|
| A | 8780 | 7102 | 1954 | 1954 | 22.26% | 27.51% |  |
| B | 8780 | 7102 | 101 | 101 | 1.15% | 1.42% |  |
| C | 8781 | 7103 | 79 | 79 | 0.90% | 1.11% | 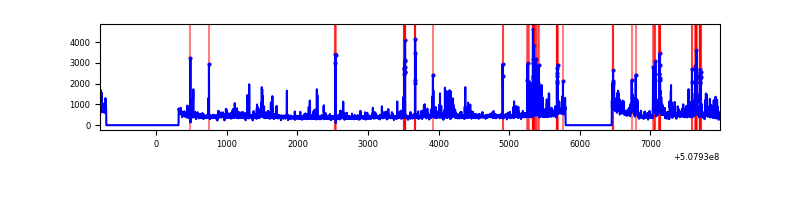 |
| D | 8780 | 7102 | 1921 | 1921 | 21.88% | 27.05% |  |
Top three noisy pixels from each quadrant. If the there are fewer than three noisy pixels in the level2.evt file, extra rows are filled as -1
| Pixel properties | Quadrant properties | ||||||
|---|---|---|---|---|---|---|---|
| Quadrant | DetID | PixID | Counts | Sigma | Mean | Median | Sigma |
| A | 15 | 32 | 5625433 | 35874.31 | 632 | 616 | 156.8 |
| A | 12 | 115 | 1186975 | 7566.43 | 632 | 616 | 156.8 |
| A | 7 | 64 | 459289 | 2925.35 | 632 | 616 | 156.8 |
| B | 5 | 185 | 674712 | 4231.43 | 746 | 720 | 159.3 |
| B | 10 | 247 | 152567 | 953.32 | 746 | 720 | 159.3 |
| B | 7 | 252 | 76157 | 473.61 | 746 | 720 | 159.3 |
| C | 13 | 3 | 741541 | 3650.53 | 736 | 730 | 202.9 |
| C | 14 | 254 | 73678 | 359.47 | 736 | 730 | 202.9 |
| C | 12 | 252 | 56257 | 273.62 | 736 | 730 | 202.9 |
| D | 11 | 129 | 4555546 | 24544.94 | 648 | 619 | 185.6 |
| D | 2 | 62 | 2892765 | 15584.78 | 648 | 619 | 185.6 |
| D | 2 | 172 | 214184 | 1150.83 | 648 | 619 | 185.6 |
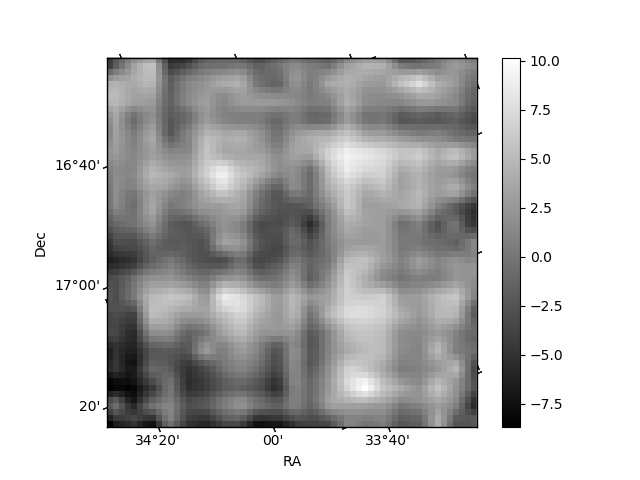
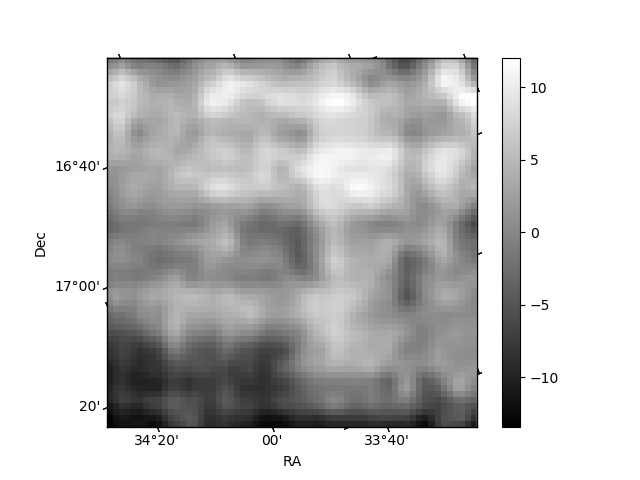
Histogram calculated using DETX and DETY for each event in the final _common_clean file
| Quadrant A | 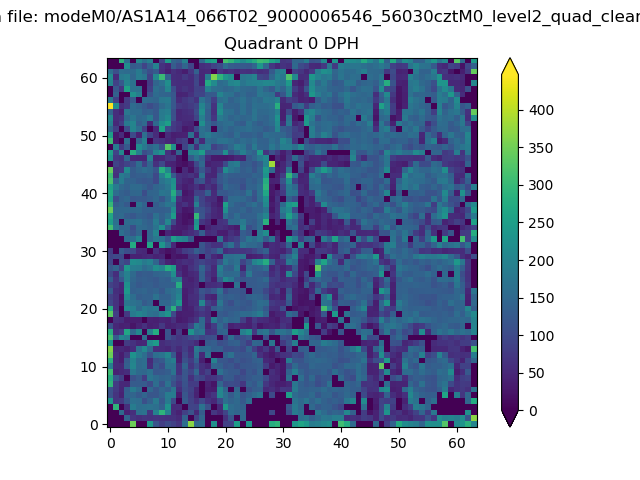 |
 |
Quadrant B |
|---|---|---|---|
| Quadrant D | 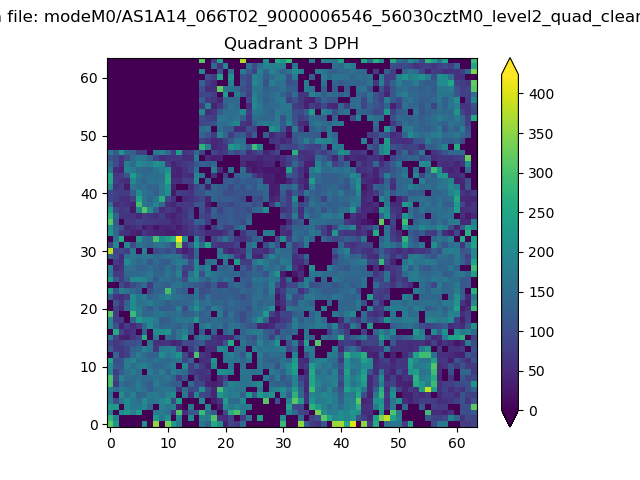 |
 |
Quadrant C |
| Plot type | Count rate plots | Images |
|---|---|---|
| Comparison with Poisson distribution Blue bars denote a histogram of data divided into 1 sec bins. Red curve is a Poisson curve with rate = median count rate of data. |
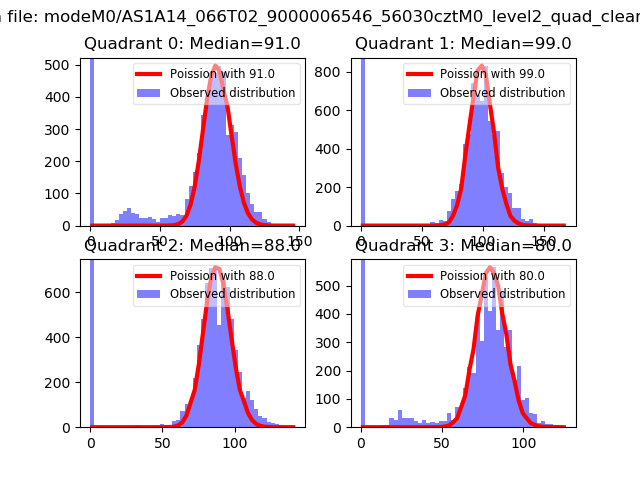 |
 |
| Quadrant-wise count rates Data is divided into 100 sec bins |
 |
|
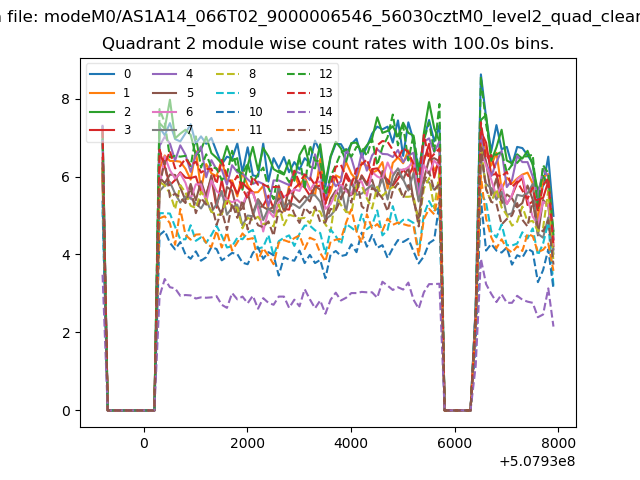
| Module-wise count rates for Quadrant A Data is divided into 100 sec bins |
 |
 |
| Module-wise count rates for Quadrant B Data is divided into 100 sec bins |
 |
 |
| Module-wise count rates for Quadrant C Data is divided into 100 sec bins |
 |
 |
| Module-wise count rates for Quadrant D Data is divided into 100 sec bins |
 |
 |
| Parameter | Plot |
|---|---|
| CZT HV Monitor | 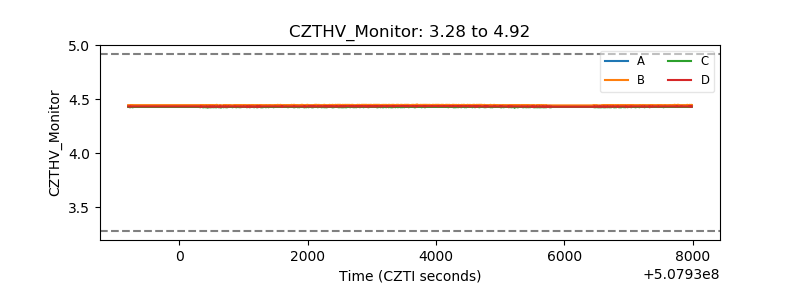 |
| D_VDD |  |
| Temperature 1 | 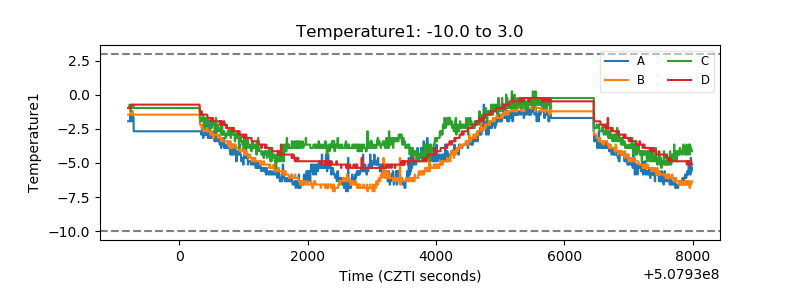 |
| Veto HV Monitor |  |
| Veto LLD | 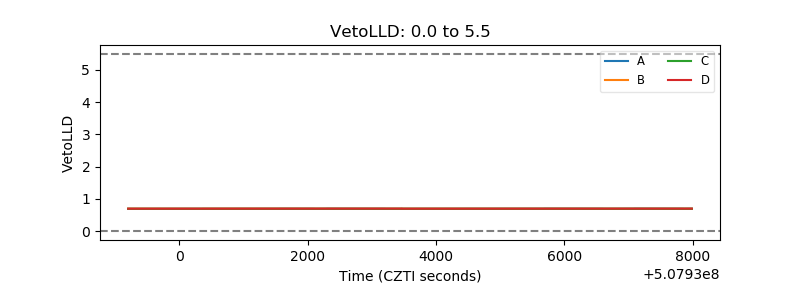 |
| Alpha Counter | 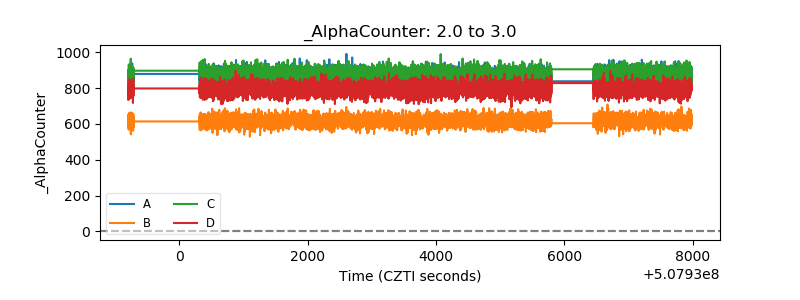 |
| _CPM_Rate |  |
| CZT Counter | 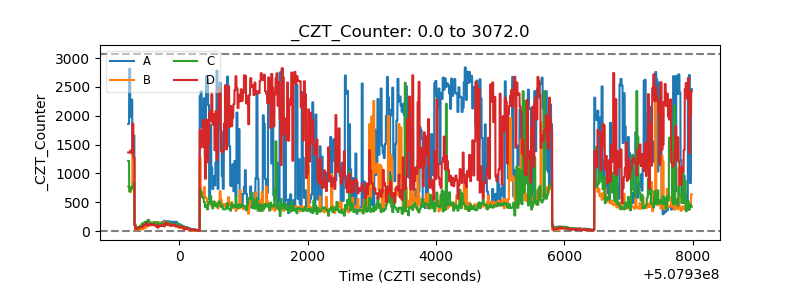 |
| +2.5 Volts monitor |  |
| +5 Volts monitor |  |
| _ROLL_ROT |  |
| _Roll_DEC |  |
| _Roll_RA |  |
| Veto Counter |  |