| Param | Original file | Final file |
|---|---|---|
| Filename | modeM0/AS1A14_066T02_9000006546_56031cztM0_level2.fits | modeM0/AS1A14_066T02_9000006546_56031cztM0_level2_quad_clean.evt |
| Size (bytes) | 809,622,720 | 106,695,360 |
| Size | 772.1 MB | 101.8 MB |
| Events in quadrant A | 10,786,175 | 562,793 |
| Events in quadrant B | 4,010,525 | 798,615 |
| Events in quadrant C | 5,502,542 | 704,655 |
| Events in quadrant D | 9,042,315 | 599,998 |
| Mode M9 | |||
|---|---|---|---|
| Quadrant | BADHDUFLAG | Total packets | Discarded packets |
| A | 0 | 8 | 0 |
| B | 0 | 8 | 0 |
| C | 0 | 8 | 0 |
| D | 0 | 8 | 0 |
| Mode M0 | |||
|---|---|---|---|
| Quadrant | BADHDUFLAG | Total packets | Discarded packets |
| A | 0 | 37736 | 2 |
| B | 0 | 17881 | 2 |
| C | 0 | 22179 | 2 |
| D | 0 | 32618 | 2 |
| Mode SS | |||
|---|---|---|---|
| Quadrant | BADHDUFLAG | Total packets | Discarded packets |
| A | 0 | 168 | 0 |
| B | 0 | 168 | 0 |
| C | 0 | 168 | 0 |
| D | 0 | 168 | 0 |
| Quadrant | Total seconds | Saturated seconds | Saturation percentage |
|---|---|---|---|
| A | 8117 | 2425 | 29.875570% |
| B | 8118 | 193 | 2.377433% |
| C | 8118 | 332 | 4.089677% |
| D | 8118 | 1138 | 14.018231% |
Noise dominated data is calculated using 1-second bins in cleaned event files. If a bin has >2000 counts, and if more than 50% of those come from <1% of pixels, then it is considered to be noise-dominated and hence unusable.
| Quadrant | # 1 sec bins | Bins with >0 counts | Bins with >2000 counts | High rate bins dominated by noise | Noise dominated (total time) | Noise dominated (detector-on time) | Marked lightcurve |
|---|---|---|---|---|---|---|---|
| A | 8912 | 8121 | 1886 | 1886 | 21.16% | 23.22% |  |
| B | 8913 | 8122 | 25 | 25 | 0.28% | 0.31% |  |
| C | 8913 | 8122 | 263 | 263 | 2.95% | 3.24% | 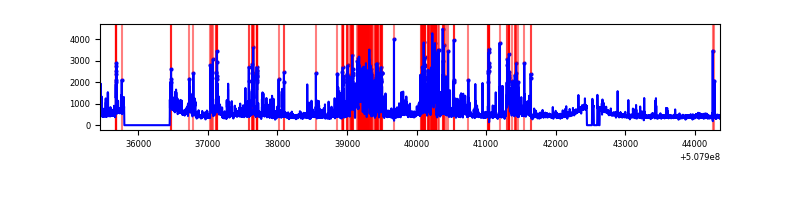 |
| D | 8913 | 8122 | 968 | 968 | 10.86% | 11.92% |  |
Top three noisy pixels from each quadrant. If the there are fewer than three noisy pixels in the level2.evt file, extra rows are filled as -1
| Pixel properties | Quadrant properties | ||||||
|---|---|---|---|---|---|---|---|
| Quadrant | DetID | PixID | Counts | Sigma | Mean | Median | Sigma |
| A | 15 | 32 | 6587593 | 33714.45 | 785 | 763 | 195.4 |
| A | 12 | 115 | 527941 | 2698.34 | 785 | 763 | 195.4 |
| A | 7 | 64 | 490230 | 2505.32 | 785 | 763 | 195.4 |
| B | 10 | 247 | 147351 | 777.76 | 882 | 851 | 188.4 |
| B | 7 | 252 | 86040 | 452.26 | 882 | 851 | 188.4 |
| B | 4 | 171 | 65896 | 345.32 | 882 | 851 | 188.4 |
| C | 13 | 3 | 1921526 | 8138.79 | 858 | 850 | 236.0 |
| C | 12 | 252 | 95609 | 401.54 | 858 | 850 | 236.0 |
| C | 2 | 12 | 60036 | 250.8 | 858 | 850 | 236.0 |
| D | 11 | 129 | 3031416 | 13085.28 | 819 | 781 | 231.6 |
| D | 2 | 62 | 1509410 | 6513.76 | 819 | 781 | 231.6 |
| D | 8 | 160 | 457355 | 1971.34 | 819 | 781 | 231.6 |
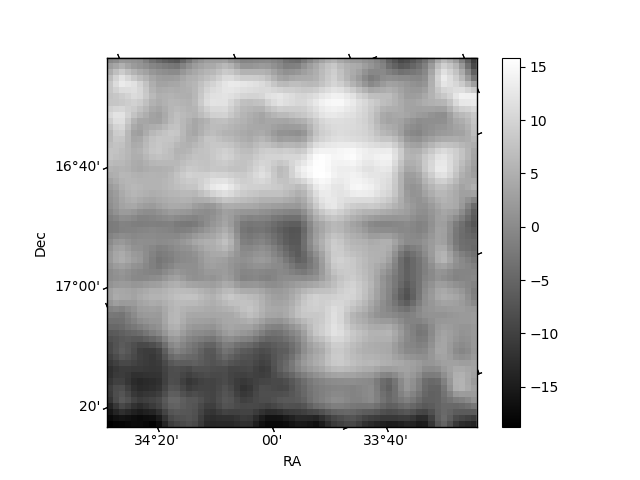
Histogram calculated using DETX and DETY for each event in the final _common_clean file
| Quadrant A | 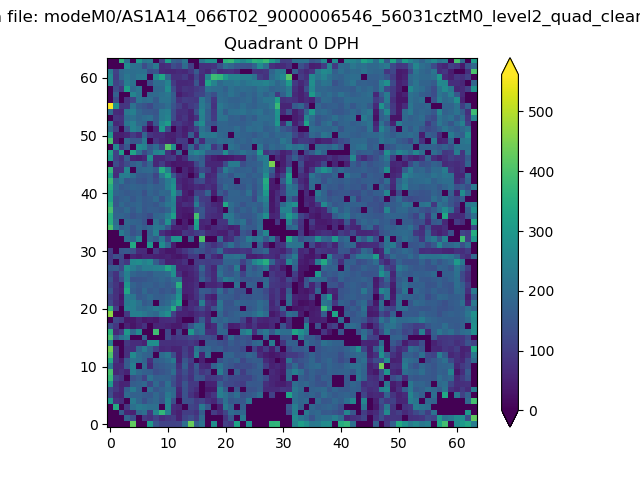 |
 |
Quadrant B |
|---|---|---|---|
| Quadrant D | 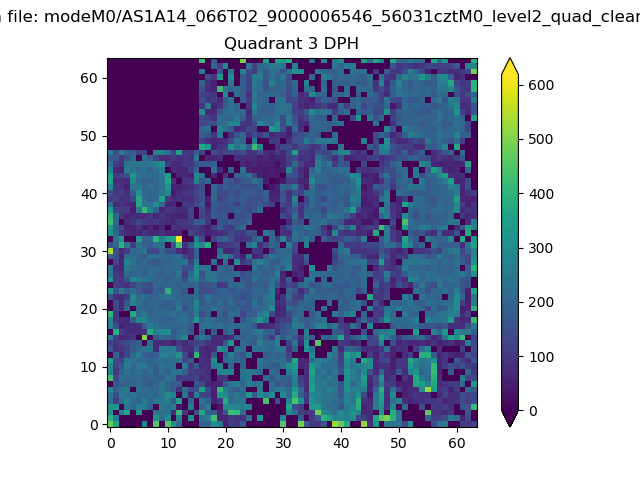 |
 |
Quadrant C |
| Plot type | Count rate plots | Images |
|---|---|---|
| Comparison with Poisson distribution Blue bars denote a histogram of data divided into 1 sec bins. Red curve is a Poisson curve with rate = median count rate of data. |
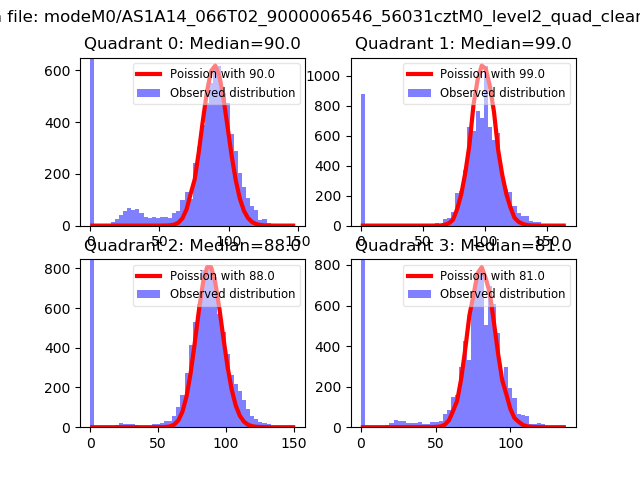 |
 |
| Quadrant-wise count rates Data is divided into 100 sec bins |
 |
|
| Module-wise count rates for Quadrant A Data is divided into 100 sec bins |
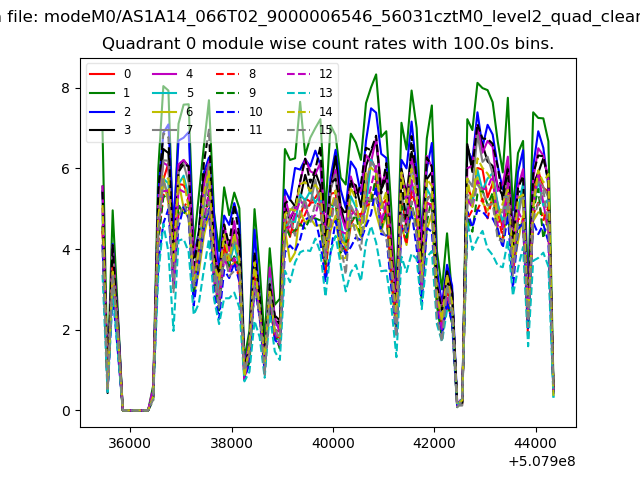 |
 |
| Module-wise count rates for Quadrant B Data is divided into 100 sec bins |
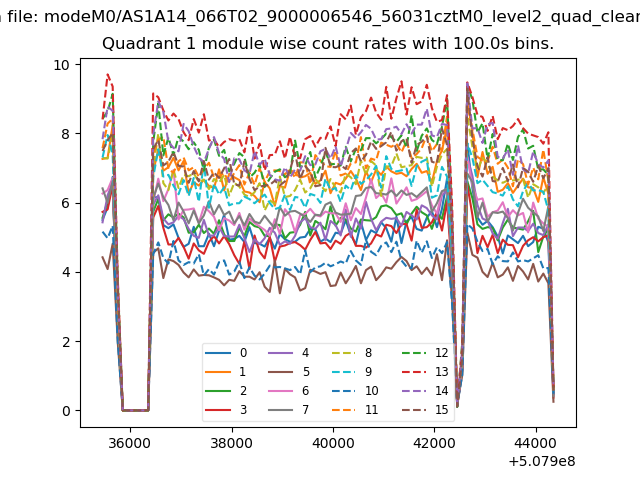 |
 |
| Module-wise count rates for Quadrant C Data is divided into 100 sec bins |
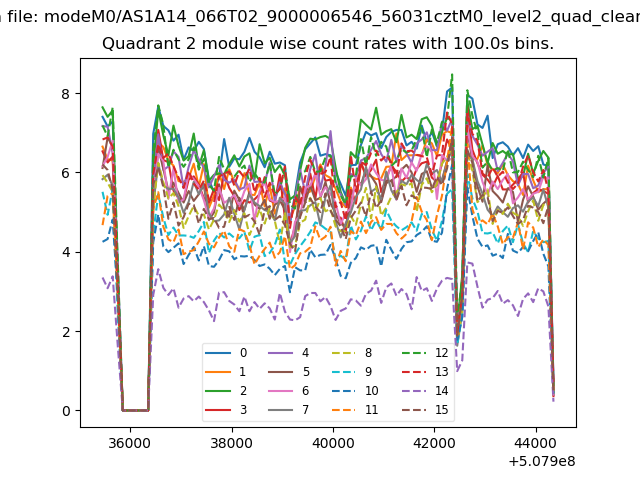 |
 |
| Module-wise count rates for Quadrant D Data is divided into 100 sec bins |
 |
 |
| Parameter | Plot |
|---|---|
| CZT HV Monitor | 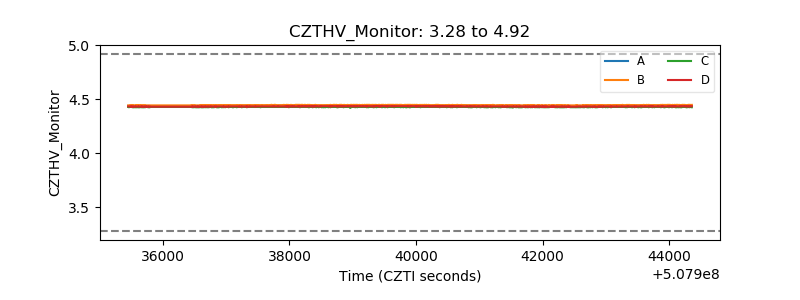 |
| D_VDD |  |
| Temperature 1 |  |
| Veto HV Monitor | 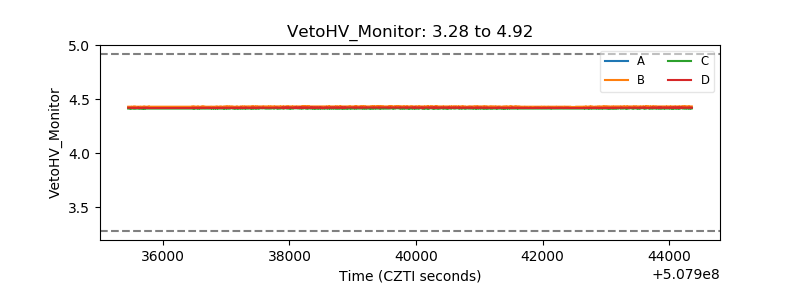 |
| Veto LLD | 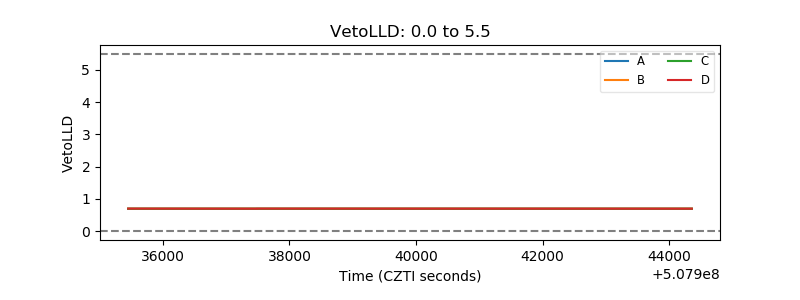 |
| Alpha Counter | 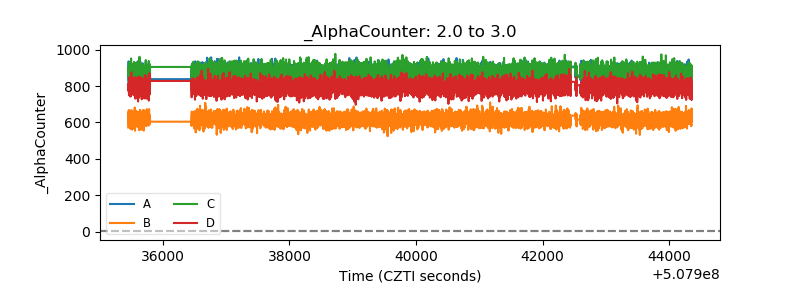 |
| _CPM_Rate | 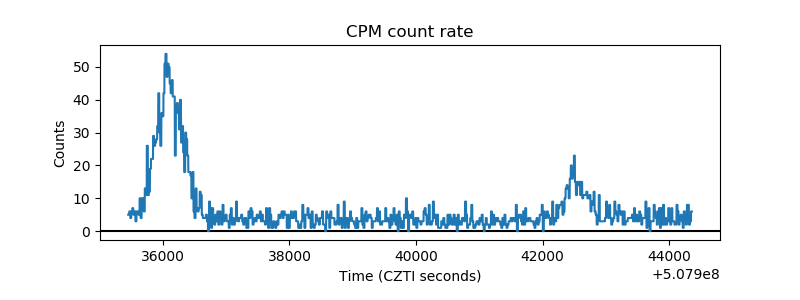 |
| CZT Counter | 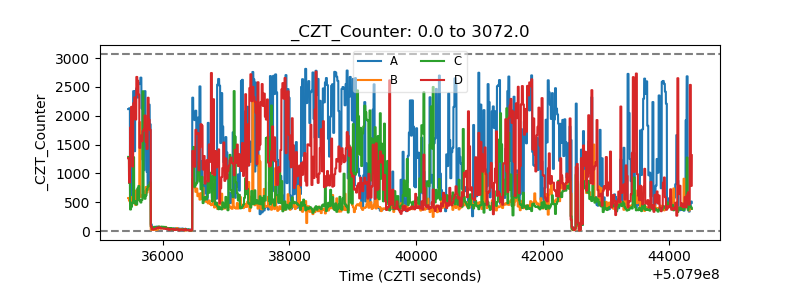 |
| +2.5 Volts monitor | 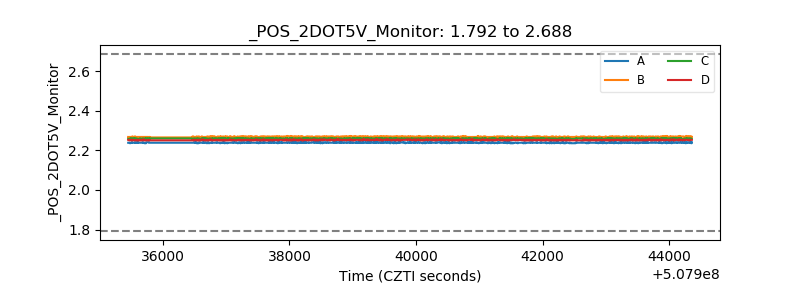 |
| +5 Volts monitor | 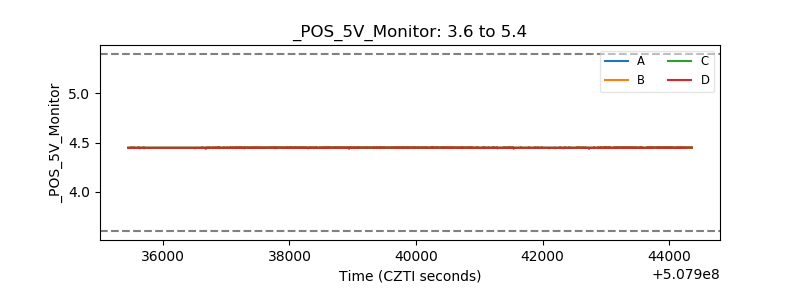 |
| _ROLL_ROT |  |
| _Roll_DEC |  |
| _Roll_RA |  |
| Veto Counter |  |