| Param | Original file | Final file |
|---|---|---|
| Filename | modeM0/AS1A14_066T02_9000006546_56032cztM0_level2.fits | modeM0/AS1A14_066T02_9000006546_56032cztM0_level2_quad_clean.evt |
| Size (bytes) | 682,280,640 | 113,515,200 |
| Size | 650.7 MB | 108.3 MB |
| Events in quadrant A | 9,625,882 | 626,643 |
| Events in quadrant B | 4,348,725 | 817,583 |
| Events in quadrant C | 4,607,810 | 728,870 |
| Events in quadrant D | 6,027,073 | 684,790 |
| Mode M9 | |||
|---|---|---|---|
| Quadrant | BADHDUFLAG | Total packets | Discarded packets |
| A | 0 | 2 | 0 |
| B | 0 | 2 | 0 |
| C | 0 | 2 | 0 |
| D | 0 | 2 | 0 |
| Mode M0 | |||
|---|---|---|---|
| Quadrant | BADHDUFLAG | Total packets | Discarded packets |
| A | 0 | 34440 | 1 |
| B | 0 | 19059 | 1 |
| C | 0 | 19768 | 1 |
| D | 0 | 23814 | 3 |
| Mode SS | |||
|---|---|---|---|
| Quadrant | BADHDUFLAG | Total packets | Discarded packets |
| A | 0 | 170 | 0 |
| B | 0 | 170 | 0 |
| C | 0 | 170 | 0 |
| D | 0 | 170 | 0 |
| Quadrant | Total seconds | Saturated seconds | Saturation percentage |
|---|---|---|---|
| A | 8336 | 1835 | 22.012956% |
| B | 8336 | 232 | 2.783109% |
| C | 8337 | 167 | 2.003119% |
| D | 8336 | 347 | 4.162668% |
Noise dominated data is calculated using 1-second bins in cleaned event files. If a bin has >2000 counts, and if more than 50% of those come from <1% of pixels, then it is considered to be noise-dominated and hence unusable.
| Quadrant | # 1 sec bins | Bins with >0 counts | Bins with >2000 counts | High rate bins dominated by noise | Noise dominated (total time) | Noise dominated (detector-on time) | Marked lightcurve |
|---|---|---|---|---|---|---|---|
| A | 8476 | 8339 | 1401 | 1401 | 16.53% | 16.80% |  |
| B | 8476 | 8339 | 61 | 61 | 0.72% | 0.73% |  |
| C | 8477 | 8340 | 138 | 138 | 1.63% | 1.65% |  |
| D | 8476 | 8339 | 306 | 306 | 3.61% | 3.67% |  |
Top three noisy pixels from each quadrant. If the there are fewer than three noisy pixels in the level2.evt file, extra rows are filled as -1
| Pixel properties | Quadrant properties | ||||||
|---|---|---|---|---|---|---|---|
| Quadrant | DetID | PixID | Counts | Sigma | Mean | Median | Sigma |
| A | 15 | 32 | 5225529 | 25063.5 | 843 | 821 | 208.5 |
| A | 7 | 64 | 695449 | 3332.21 | 843 | 821 | 208.5 |
| A | 12 | 115 | 229881 | 1098.83 | 843 | 821 | 208.5 |
| B | 5 | 185 | 375093 | 1914.52 | 907 | 874 | 195.5 |
| B | 10 | 247 | 79975 | 404.68 | 907 | 874 | 195.5 |
| B | 4 | 171 | 62716 | 316.39 | 907 | 874 | 195.5 |
| C | 9 | 38 | 437186 | 1789.16 | 890 | 884 | 243.9 |
| C | 13 | 3 | 407738 | 1668.4 | 890 | 884 | 243.9 |
| C | 12 | 252 | 167968 | 685.17 | 890 | 884 | 243.9 |
| D | 11 | 129 | 1018842 | 4080.82 | 879 | 842 | 249.5 |
| D | 6 | 239 | 353362 | 1413.13 | 879 | 842 | 249.5 |
| D | 3 | 12 | 327310 | 1308.7 | 879 | 842 | 249.5 |
Histogram calculated using DETX and DETY for each event in the final _common_clean file
| Quadrant A | 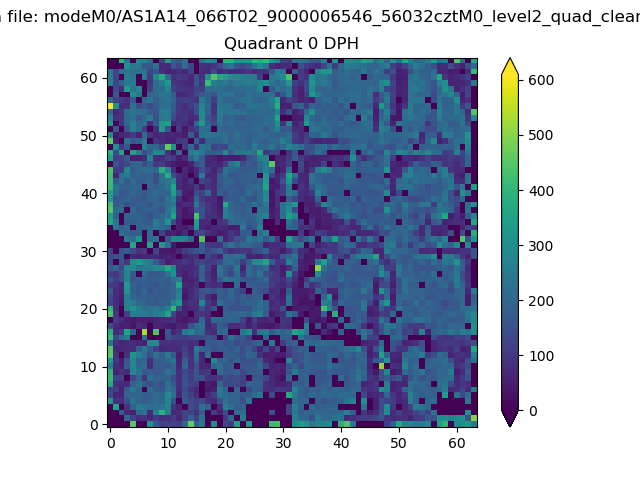 |
 |
Quadrant B |
|---|---|---|---|
| Quadrant D |  |
 |
Quadrant C |
| Plot type | Count rate plots | Images |
|---|---|---|
| Comparison with Poisson distribution Blue bars denote a histogram of data divided into 1 sec bins. Red curve is a Poisson curve with rate = median count rate of data. |
 |
 |
| Quadrant-wise count rates Data is divided into 100 sec bins |
 |
|
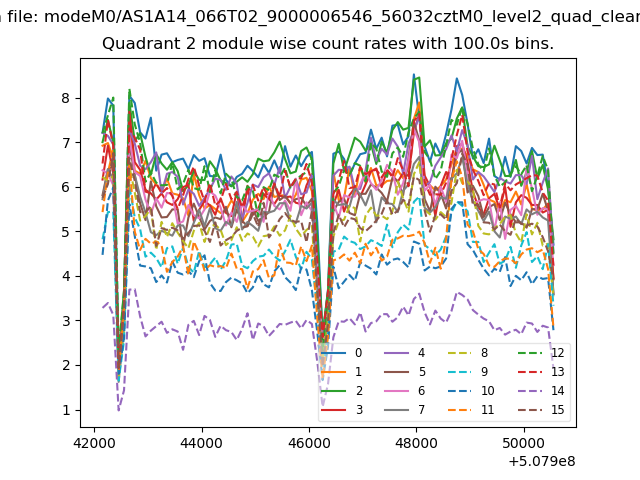
| Module-wise count rates for Quadrant A Data is divided into 100 sec bins |
 |
 |
| Module-wise count rates for Quadrant B Data is divided into 100 sec bins |
 |
 |
| Module-wise count rates for Quadrant C Data is divided into 100 sec bins |
 |
 |
| Module-wise count rates for Quadrant D Data is divided into 100 sec bins |
 |
 |
| Parameter | Plot |
|---|---|
| CZT HV Monitor | 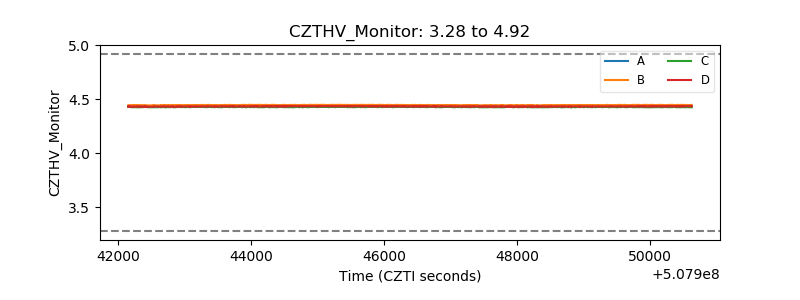 |
| D_VDD |  |
| Temperature 1 | 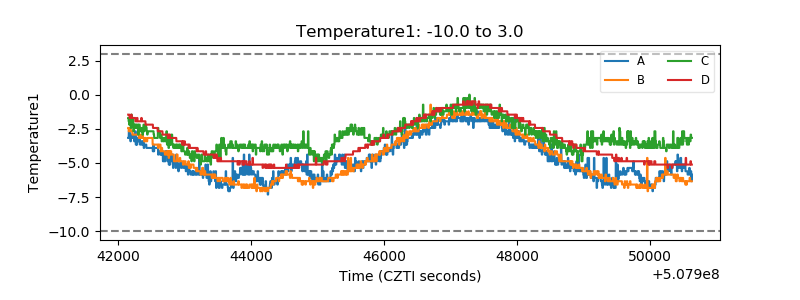 |
| Veto HV Monitor |  |
| Veto LLD |  |
| Alpha Counter |  |
| _CPM_Rate | 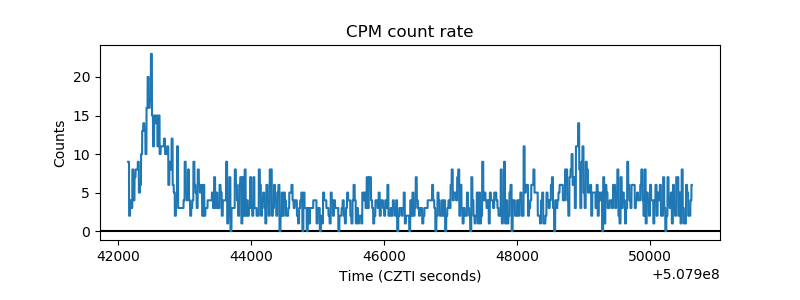 |
| CZT Counter | 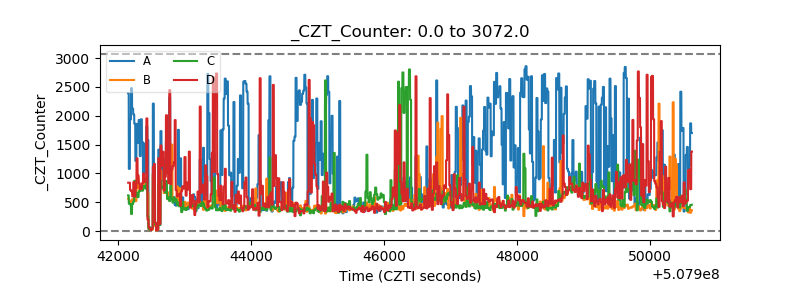 |
| +2.5 Volts monitor |  |
| +5 Volts monitor |  |
| _ROLL_ROT | 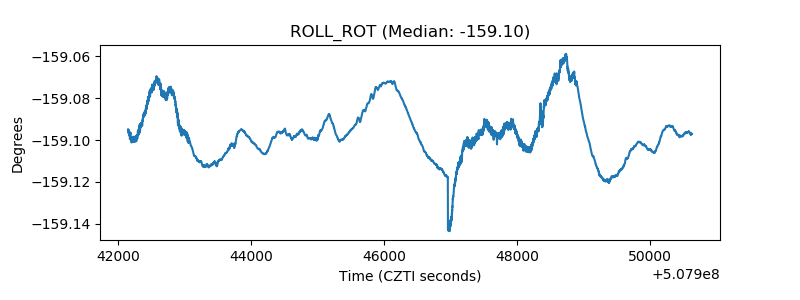 |
| _Roll_DEC |  |
| _Roll_RA |  |
| Veto Counter | 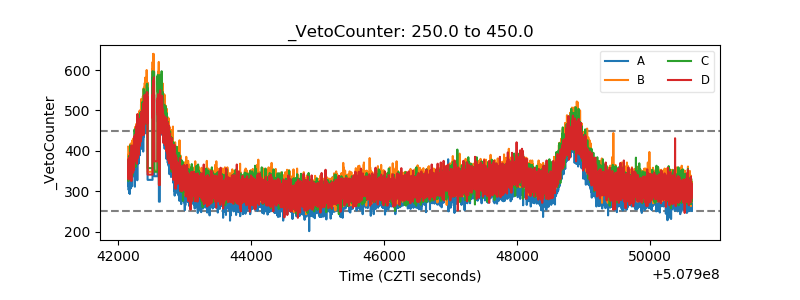 |