| Param | Original file | Final file |
|---|---|---|
| Filename | modeM0/AS1A14_066T02_9000006546_56033cztM0_level2.fits | modeM0/AS1A14_066T02_9000006546_56033cztM0_level2_quad_clean.evt |
| Size (bytes) | 762,900,480 | 97,551,360 |
| Size | 727.6 MB | 93.0 MB |
| Events in quadrant A | 7,722,377 | 622,644 |
| Events in quadrant B | 3,772,333 | 730,273 |
| Events in quadrant C | 5,406,680 | 615,898 |
| Events in quadrant D | 10,760,268 | 464,177 |
| Mode M0 | |||
|---|---|---|---|
| Quadrant | BADHDUFLAG | Total packets | Discarded packets |
| A | 0 | 28130 | 0 |
| B | 0 | 16704 | 0 |
| C | 0 | 21317 | 0 |
| D | 0 | 37148 | 0 |
| Mode SS | |||
|---|---|---|---|
| Quadrant | BADHDUFLAG | Total packets | Discarded packets |
| A | 0 | 150 | 0 |
| B | 0 | 150 | 0 |
| C | 0 | 150 | 0 |
| D | 0 | 150 | 0 |
| Quadrant | Total seconds | Saturated seconds | Saturation percentage |
|---|---|---|---|
| A | 7475 | 949 | 12.695652% |
| B | 7476 | 135 | 1.805778% |
| C | 7476 | 590 | 7.891921% |
| D | 7476 | 2154 | 28.812199% |
Noise dominated data is calculated using 1-second bins in cleaned event files. If a bin has >2000 counts, and if more than 50% of those come from <1% of pixels, then it is considered to be noise-dominated and hence unusable.
| Quadrant | # 1 sec bins | Bins with >0 counts | Bins with >2000 counts | High rate bins dominated by noise | Noise dominated (total time) | Noise dominated (detector-on time) | Marked lightcurve |
|---|---|---|---|---|---|---|---|
| A | 7475 | 7475 | 846 | 846 | 11.32% | 11.32% |  |
| B | 7476 | 7476 | 48 | 48 | 0.64% | 0.64% |  |
| C | 7476 | 7476 | 371 | 371 | 4.96% | 4.96% |  |
| D | 7476 | 7476 | 2023 | 2023 | 27.06% | 27.06% |  |
Top three noisy pixels from each quadrant. If the there are fewer than three noisy pixels in the level2.evt file, extra rows are filled as -1
| Pixel properties | Quadrant properties | ||||||
|---|---|---|---|---|---|---|---|
| Quadrant | DetID | PixID | Counts | Sigma | Mean | Median | Sigma |
| A | 15 | 32 | 3588267 | 18908.21 | 765 | 743 | 189.7 |
| A | 7 | 64 | 595487 | 3134.63 | 765 | 743 | 189.7 |
| A | 12 | 115 | 261029 | 1371.85 | 765 | 743 | 189.7 |
| B | 5 | 185 | 413523 | 2420.22 | 790 | 761 | 170.5 |
| B | 4 | 171 | 65970 | 382.35 | 790 | 761 | 170.5 |
| B | 10 | 247 | 64588 | 374.25 | 790 | 761 | 170.5 |
| C | 13 | 3 | 2168583 | 10427.25 | 761 | 757 | 207.9 |
| C | 12 | 252 | 109776 | 524.38 | 761 | 757 | 207.9 |
| C | 6 | 223 | 29659 | 139.02 | 761 | 757 | 207.9 |
| D | 11 | 129 | 6901182 | 34767.13 | 693 | 664 | 198.5 |
| D | 6 | 239 | 287696 | 1446.16 | 693 | 664 | 198.5 |
| D | 3 | 12 | 266617 | 1339.96 | 693 | 664 | 198.5 |
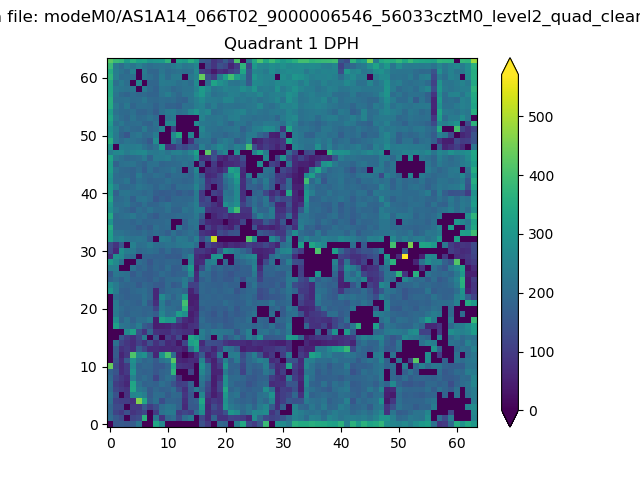
Histogram calculated using DETX and DETY for each event in the final _common_clean file
| Quadrant A |  |
 |
Quadrant B |
|---|---|---|---|
| Quadrant D |  |
 |
Quadrant C |
| Plot type | Count rate plots | Images |
|---|---|---|
| Comparison with Poisson distribution Blue bars denote a histogram of data divided into 1 sec bins. Red curve is a Poisson curve with rate = median count rate of data. |
 |
 |
| Quadrant-wise count rates Data is divided into 100 sec bins |
 |
|
| Module-wise count rates for Quadrant A Data is divided into 100 sec bins |
 |
 |
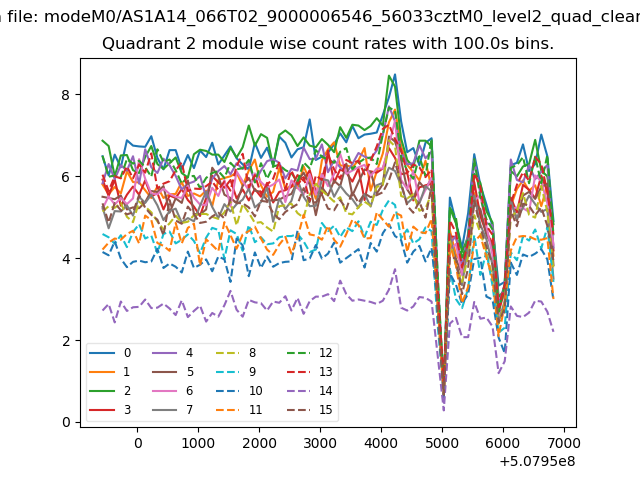
| Module-wise count rates for Quadrant B Data is divided into 100 sec bins |
 |
 |
| Module-wise count rates for Quadrant C Data is divided into 100 sec bins |
 |
 |
| Module-wise count rates for Quadrant D Data is divided into 100 sec bins |
 |
 |
| Parameter | Plot |
|---|---|
| CZT HV Monitor | 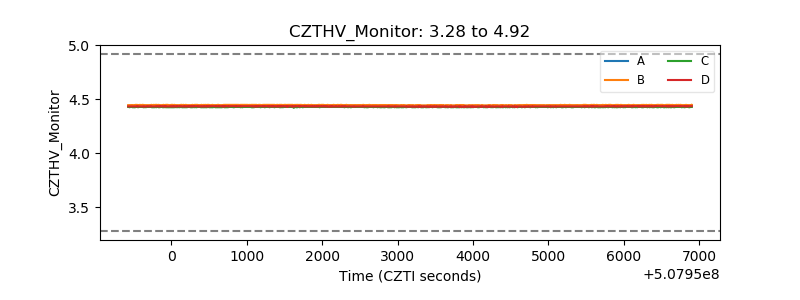 |
| D_VDD |  |
| Temperature 1 | 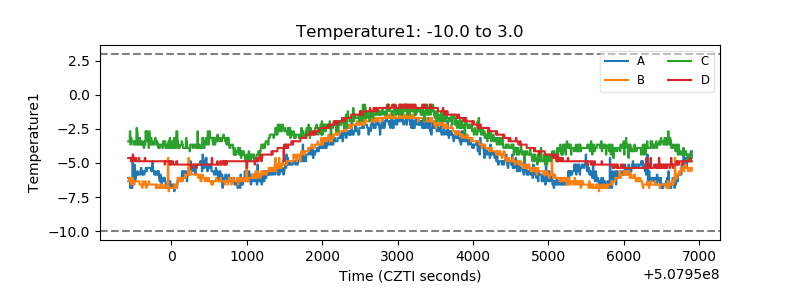 |
| Veto HV Monitor |  |
| Veto LLD |  |
| Alpha Counter |  |
| _CPM_Rate |  |
| CZT Counter | 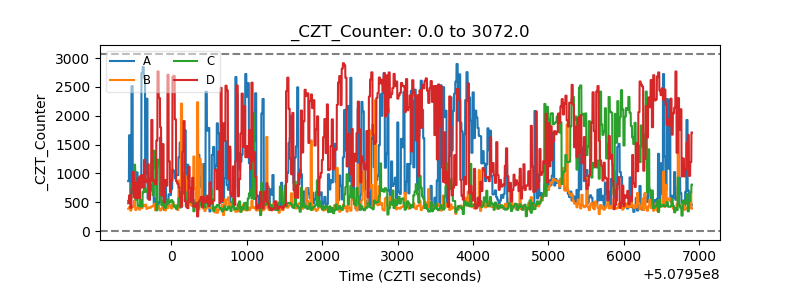 |
| +2.5 Volts monitor |  |
| +5 Volts monitor |  |
| _ROLL_ROT | 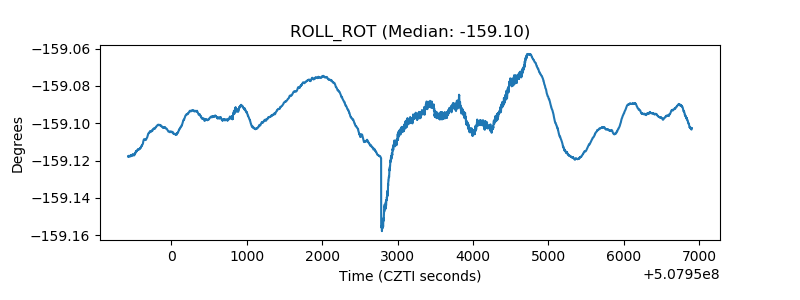 |
| _Roll_DEC |  |
| _Roll_RA |  |
| Veto Counter | 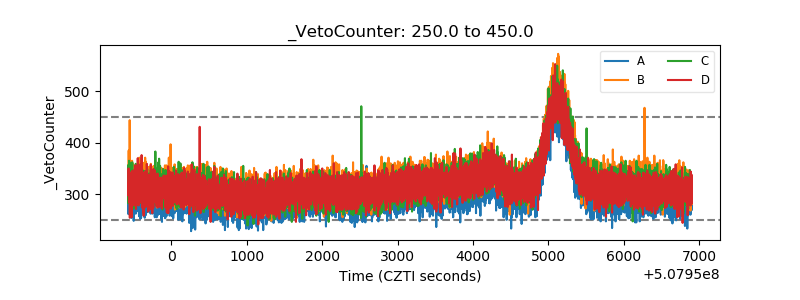 |