| Param | Original file | Final file |
|---|---|---|
| Filename | modeM0/AS1A14_083T03_9000006548_56039cztM0_level2.fits | modeM0/AS1A14_083T03_9000006548_56039cztM0_level2_quad_clean.evt |
| Size (bytes) | 647,628,480 | 89,588,160 |
| Size | 617.6 MB | 85.4 MB |
| Events in quadrant A | 11,320,288 | 388,592 |
| Events in quadrant B | 4,154,616 | 673,902 |
| Events in quadrant C | 3,445,926 | 608,308 |
| Events in quadrant D | 4,530,862 | 573,034 |
| Mode M0 | |||
|---|---|---|---|
| Quadrant | BADHDUFLAG | Total packets | Discarded packets |
| A | 0 | 38233 | 2 |
| B | 0 | 17128 | 2 |
| C | 0 | 15358 | 2 |
| D | 0 | 18119 | 2 |
| Mode SS | |||
|---|---|---|---|
| Quadrant | BADHDUFLAG | Total packets | Discarded packets |
| A | 0 | 138 | 0 |
| B | 0 | 138 | 0 |
| C | 0 | 138 | 0 |
| D | 0 | 138 | 0 |
| Mode M9 | |||
|---|---|---|---|
| Quadrant | BADHDUFLAG | Total packets | Discarded packets |
| A | 0 | 10 | 0 |
| B | 0 | 10 | 0 |
| C | 0 | 10 | 0 |
| D | 0 | 10 | 0 |
| Quadrant | Total seconds | Saturated seconds | Saturation percentage |
|---|---|---|---|
| A | 6716 | 3153 | 46.947588% |
| B | 6717 | 313 | 4.659818% |
| C | 6717 | 208 | 3.096621% |
| D | 6717 | 241 | 3.587911% |
Noise dominated data is calculated using 1-second bins in cleaned event files. If a bin has >2000 counts, and if more than 50% of those come from <1% of pixels, then it is considered to be noise-dominated and hence unusable.
| Quadrant | # 1 sec bins | Bins with >0 counts | Bins with >2000 counts | High rate bins dominated by noise | Noise dominated (total time) | Noise dominated (detector-on time) | Marked lightcurve |
|---|---|---|---|---|---|---|---|
| A | 7721 | 6717 | 2596 | 2596 | 33.62% | 38.65% | 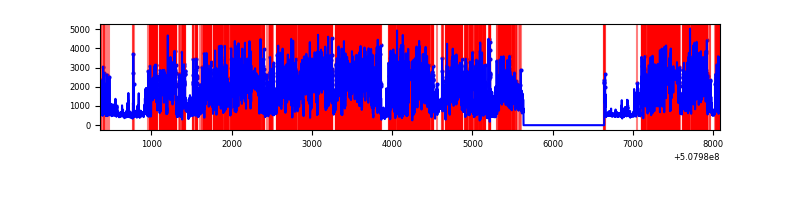 |
| B | 7722 | 6718 | 186 | 186 | 2.41% | 2.77% | 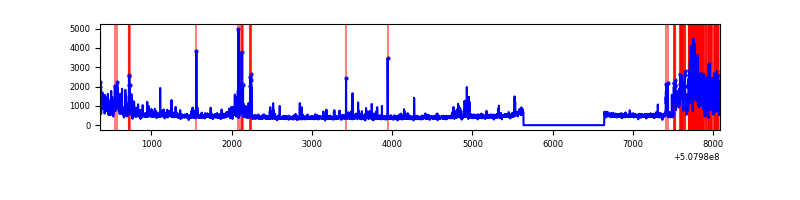 |
| C | 7722 | 6718 | 136 | 136 | 1.76% | 2.02% | 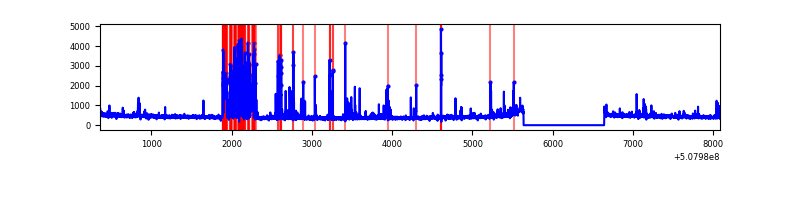 |
| D | 7722 | 6718 | 182 | 182 | 2.36% | 2.71% | 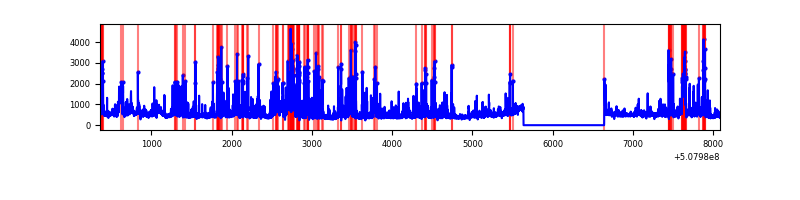 |
Top three noisy pixels from each quadrant. If the there are fewer than three noisy pixels in the level2.evt file, extra rows are filled as -1
| Pixel properties | Quadrant properties | ||||||
|---|---|---|---|---|---|---|---|
| Quadrant | DetID | PixID | Counts | Sigma | Mean | Median | Sigma |
| A | 15 | 32 | 8414893 | 57844.3 | 582 | 567 | 145.5 |
| A | 7 | 64 | 341167 | 2341.46 | 582 | 567 | 145.5 |
| A | 12 | 115 | 109749 | 750.57 | 582 | 567 | 145.5 |
| B | 5 | 185 | 1097584 | 7279.0 | 703 | 679 | 150.7 |
| B | 0 | 199 | 76929 | 505.99 | 703 | 679 | 150.7 |
| B | 0 | 213 | 40440 | 263.85 | 703 | 679 | 150.7 |
| C | 15 | 199 | 439675 | 2296.76 | 689 | 683 | 191.1 |
| C | 13 | 3 | 125849 | 654.86 | 689 | 683 | 191.1 |
| C | 12 | 252 | 45851 | 236.31 | 689 | 683 | 191.1 |
| D | 11 | 129 | 950571 | 4799.88 | 692 | 661 | 197.9 |
| D | 14 | 52 | 181307 | 912.8 | 692 | 661 | 197.9 |
| D | 3 | 12 | 132517 | 666.27 | 692 | 661 | 197.9 |
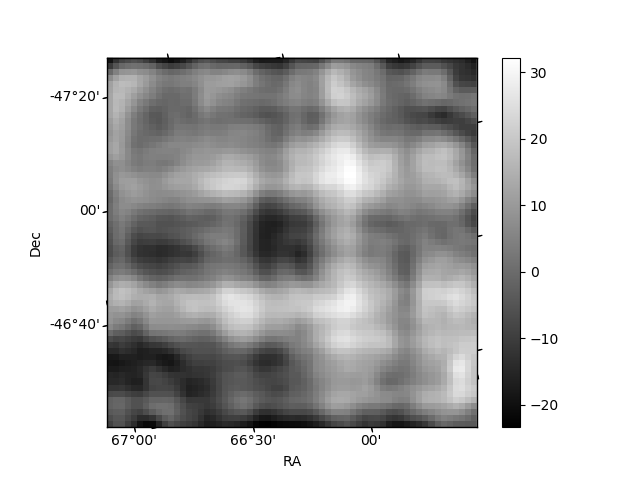
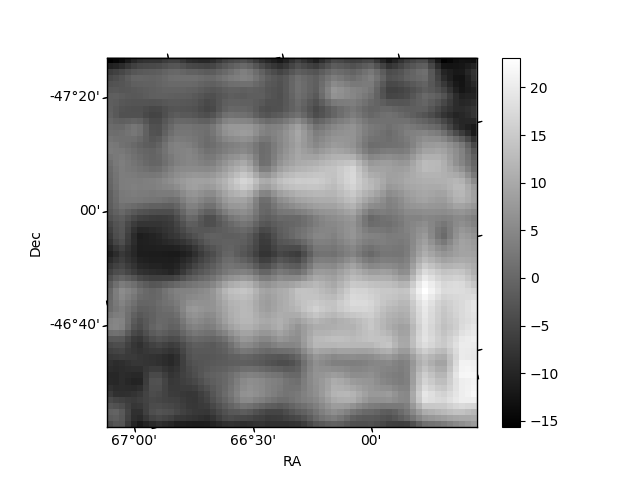
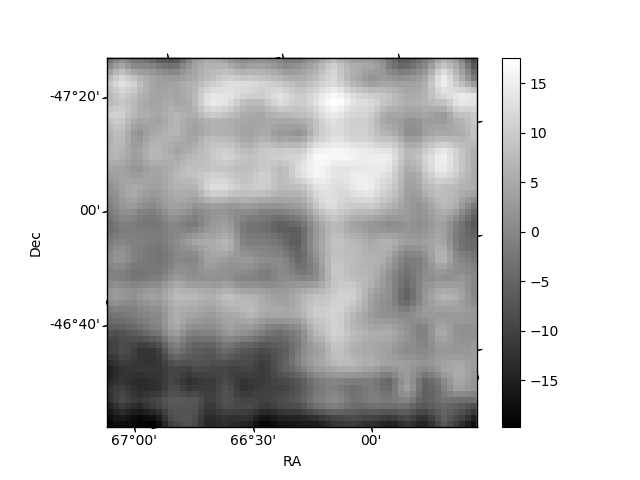
Histogram calculated using DETX and DETY for each event in the final _common_clean file
| Quadrant A | 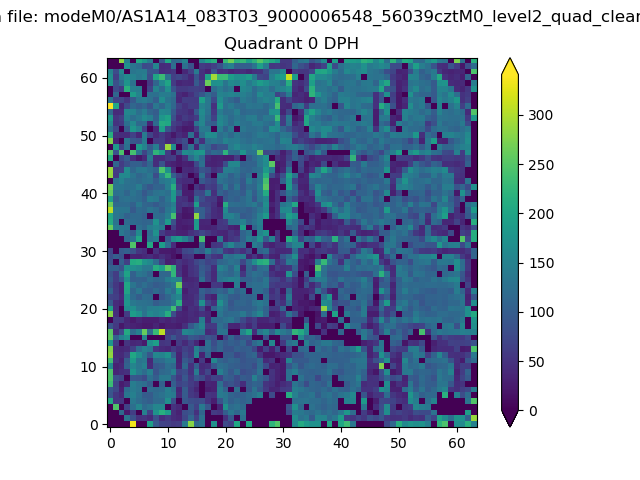 |
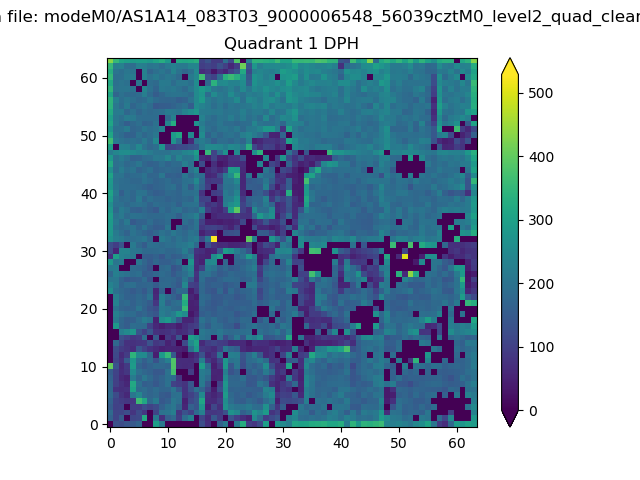 |
Quadrant B |
|---|---|---|---|
| Quadrant D | 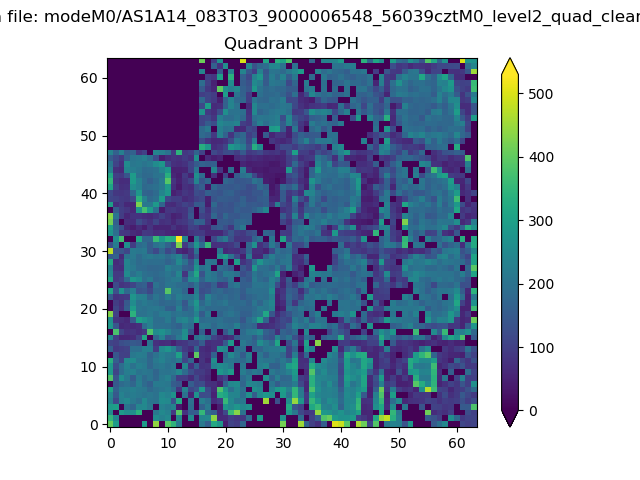 |
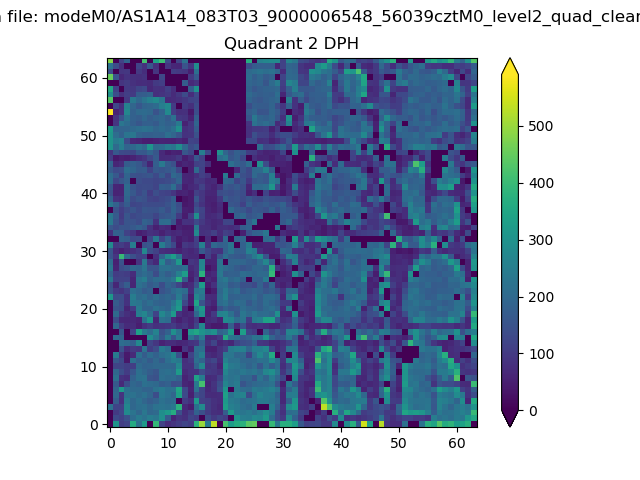 |
Quadrant C |
| Plot type | Count rate plots | Images |
|---|---|---|
| Comparison with Poisson distribution Blue bars denote a histogram of data divided into 1 sec bins. Red curve is a Poisson curve with rate = median count rate of data. |
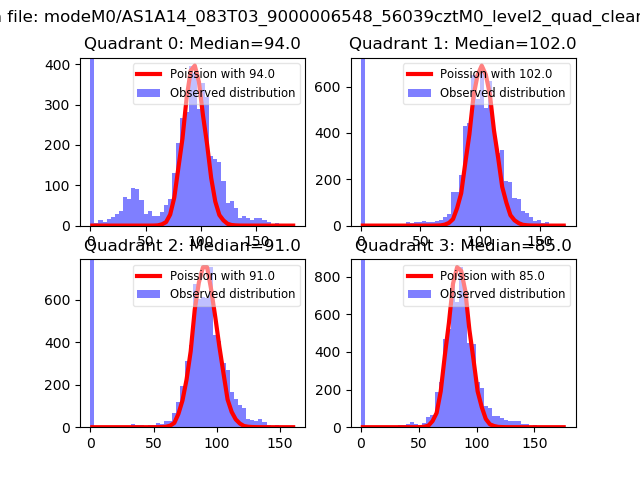 |
 |
| Quadrant-wise count rates Data is divided into 100 sec bins |
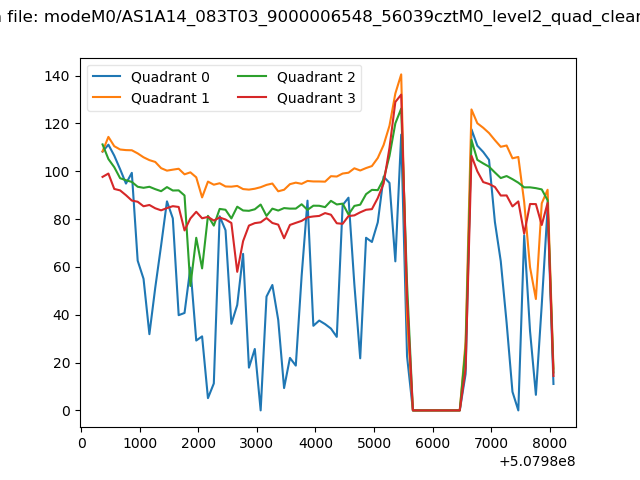 |
|
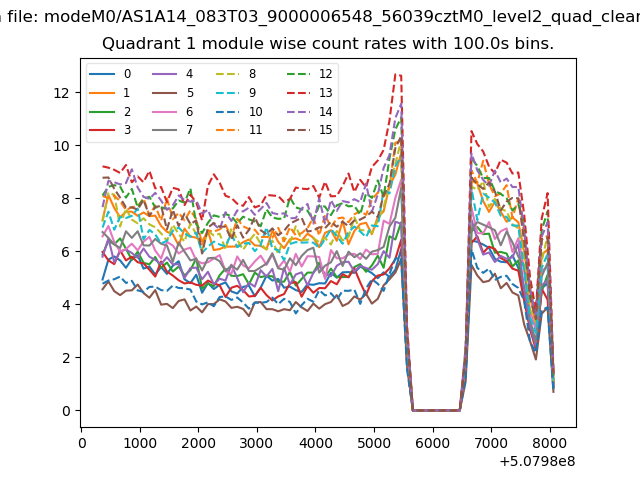
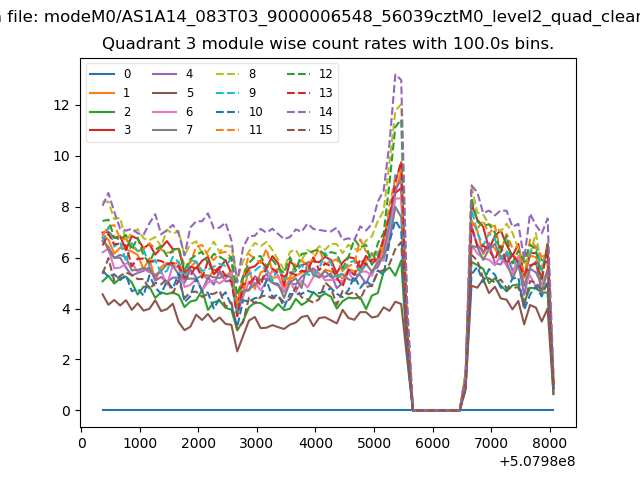
| Module-wise count rates for Quadrant A Data is divided into 100 sec bins |
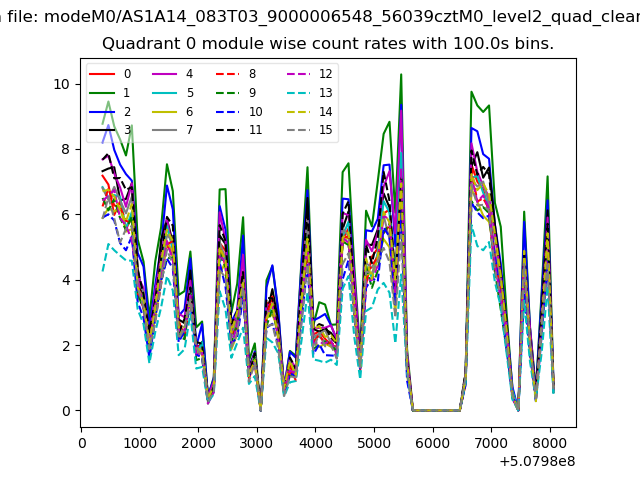 |
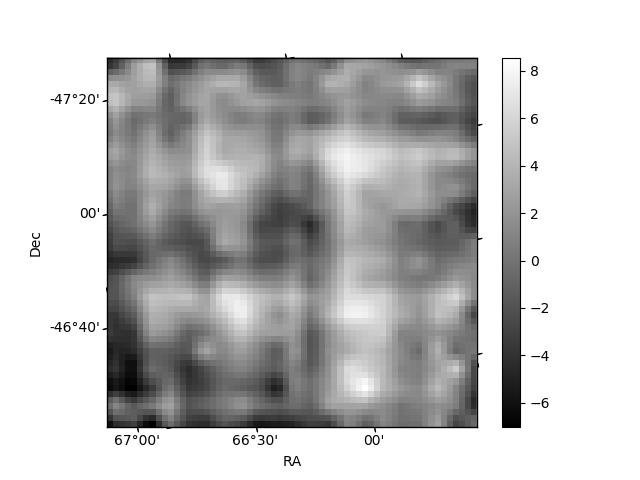 |
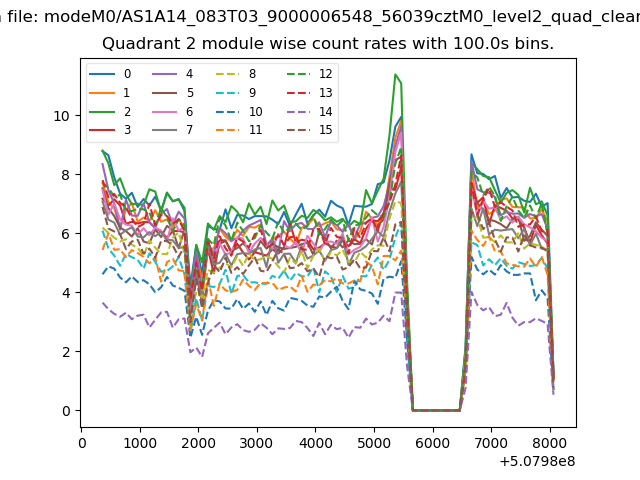
| Module-wise count rates for Quadrant B Data is divided into 100 sec bins |
 |
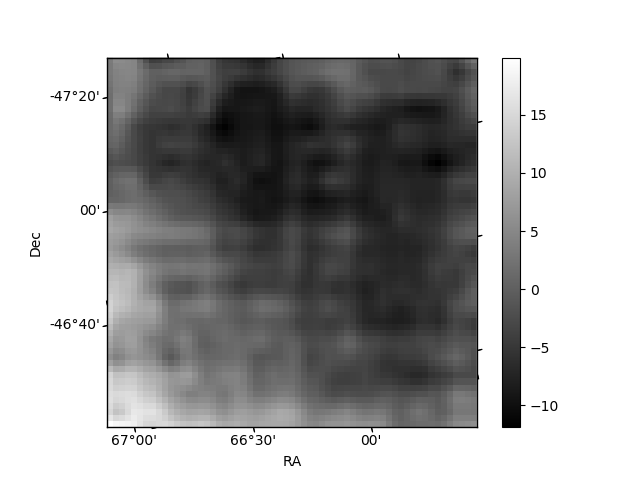 |
| Module-wise count rates for Quadrant C Data is divided into 100 sec bins |
 |
 |
| Module-wise count rates for Quadrant D Data is divided into 100 sec bins |
 |
 |
| Parameter | Plot |
|---|---|
| CZT HV Monitor | 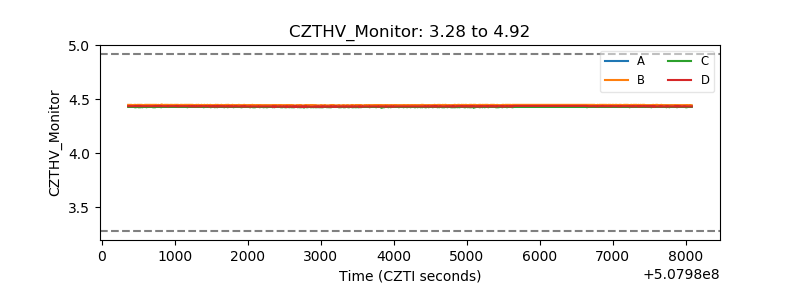 |
| D_VDD | 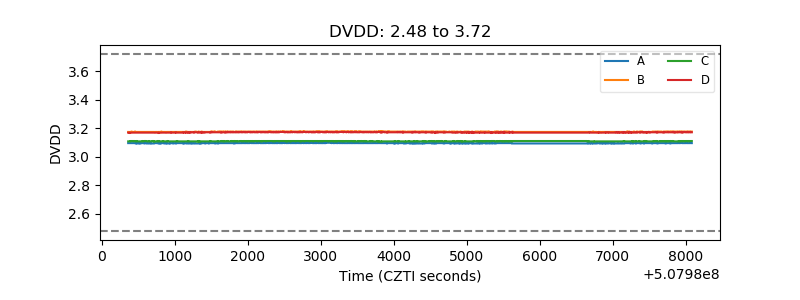 |
| Temperature 1 | 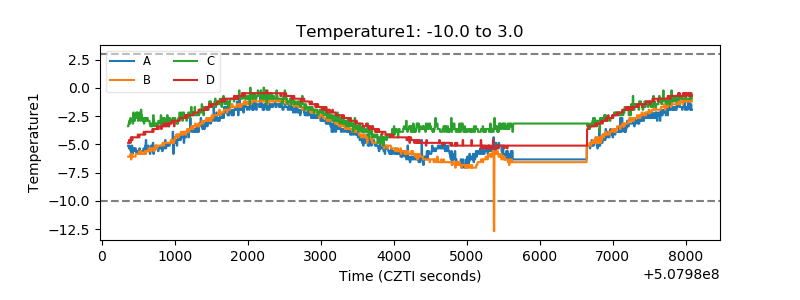 |
| Veto HV Monitor | 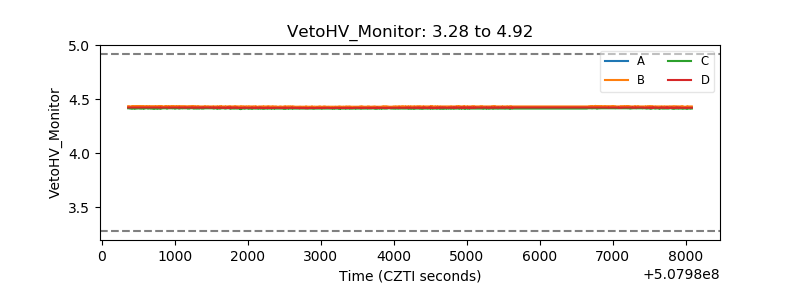 |
| Veto LLD | 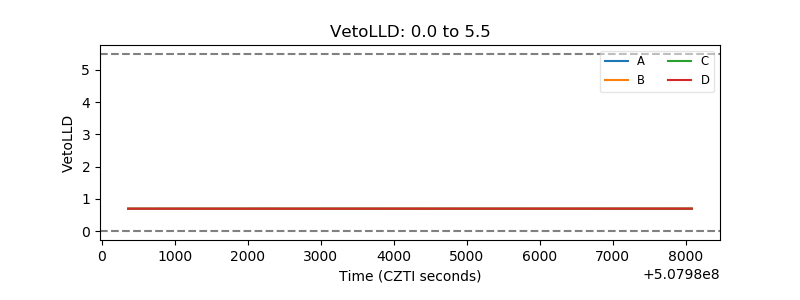 |
| Alpha Counter | 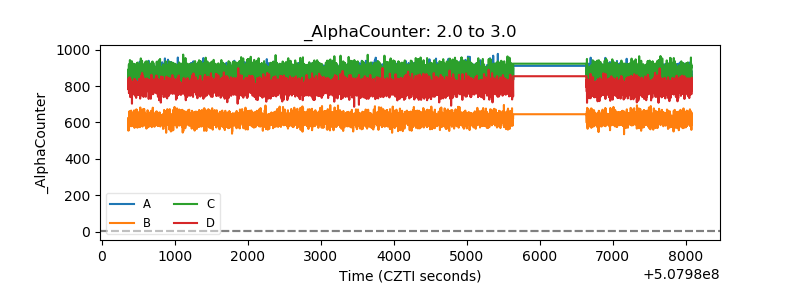 |
| _CPM_Rate | 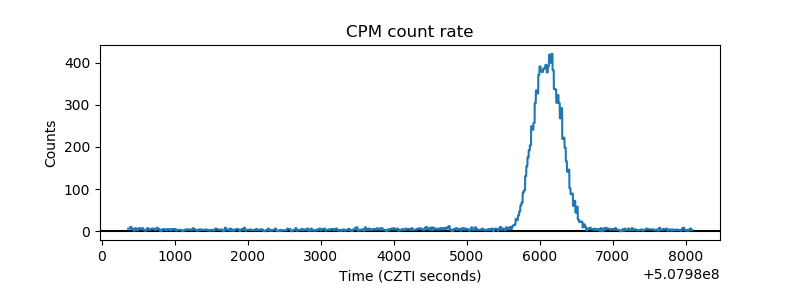 |
| CZT Counter | 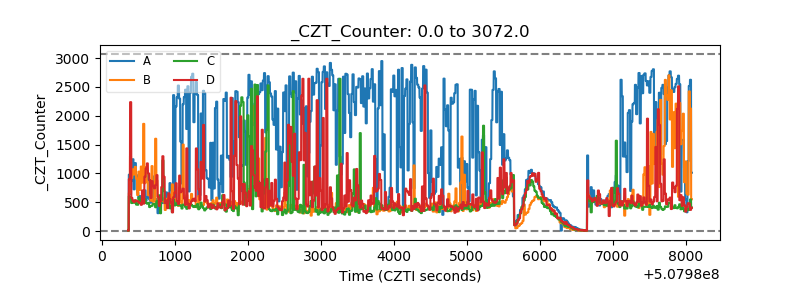 |
| +2.5 Volts monitor |  |
| +5 Volts monitor | 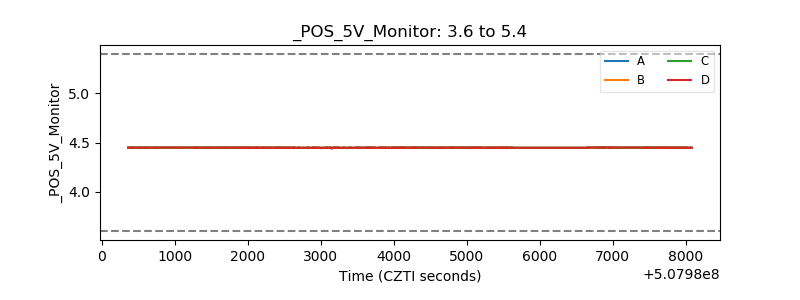 |
| _ROLL_ROT | 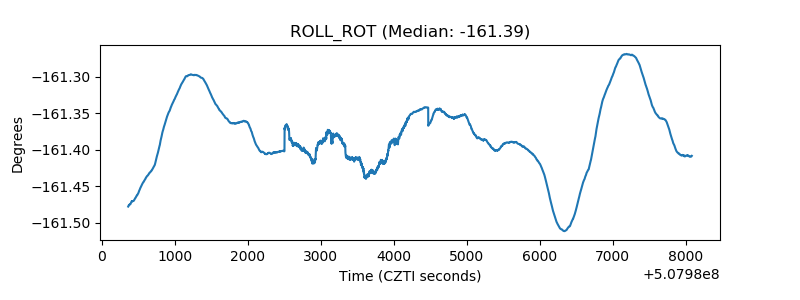 |
| _Roll_DEC | 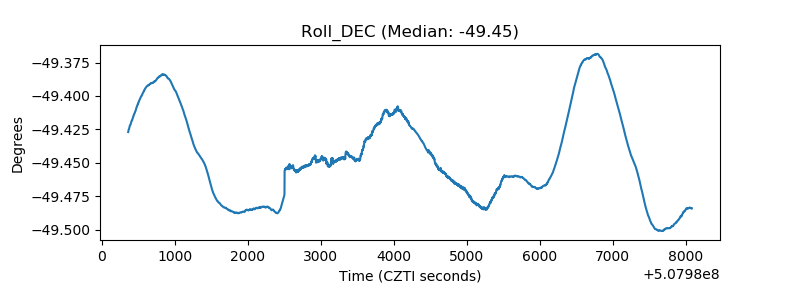 |
| _Roll_RA | 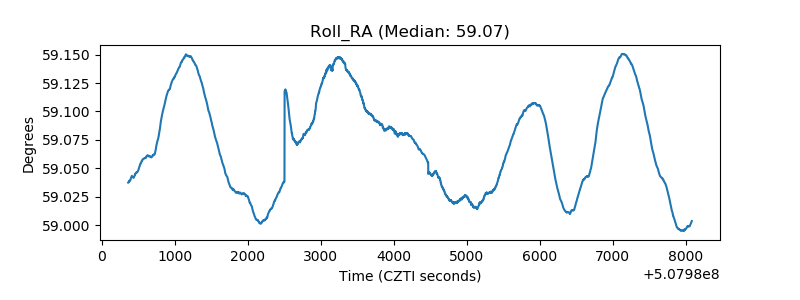 |
| Veto Counter | 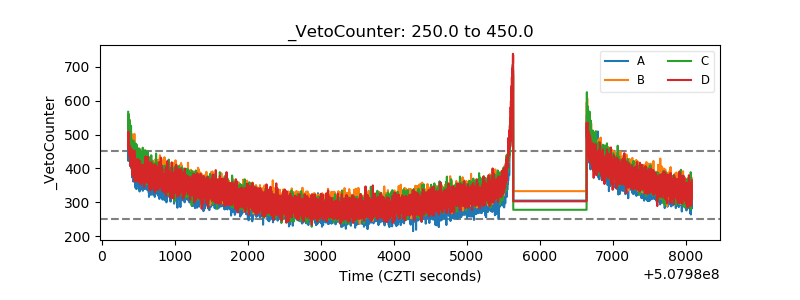 |