| Param | Original file | Final file |
|---|---|---|
| Filename | modeM0/AS1A14_083T03_9000006548_56041cztM0_level2.fits | modeM0/AS1A14_083T03_9000006548_56041cztM0_level2_quad_clean.evt |
| Size (bytes) | 474,160,320 | 88,032,960 |
| Size | 452.2 MB | 84.0 MB |
| Events in quadrant A | 5,223,144 | 538,368 |
| Events in quadrant B | 3,103,121 | 636,064 |
| Events in quadrant C | 3,067,127 | 564,641 |
| Events in quadrant D | 5,677,362 | 494,387 |
| Mode M0 | |||
|---|---|---|---|
| Quadrant | BADHDUFLAG | Total packets | Discarded packets |
| A | 0 | 19721 | 1 |
| B | 0 | 13588 | 1 |
| C | 0 | 14011 | 1 |
| D | 0 | 21164 | 1 |
| Mode SS | |||
|---|---|---|---|
| Quadrant | BADHDUFLAG | Total packets | Discarded packets |
| A | 0 | 126 | 0 |
| B | 0 | 126 | 0 |
| C | 0 | 126 | 0 |
| D | 0 | 126 | 0 |
| Mode M9 | |||
|---|---|---|---|
| Quadrant | BADHDUFLAG | Total packets | Discarded packets |
| A | 0 | 11 | 0 |
| B | 0 | 11 | 0 |
| C | 0 | 11 | 0 |
| D | 0 | 11 | 0 |
| Quadrant | Total seconds | Saturated seconds | Saturation percentage |
|---|---|---|---|
| A | 6190 | 786 | 12.697900% |
| B | 6191 | 124 | 2.002907% |
| C | 6191 | 87 | 1.405266% |
| D | 6191 | 564 | 9.109998% |
Noise dominated data is calculated using 1-second bins in cleaned event files. If a bin has >2000 counts, and if more than 50% of those come from <1% of pixels, then it is considered to be noise-dominated and hence unusable.
| Quadrant | # 1 sec bins | Bins with >0 counts | Bins with >2000 counts | High rate bins dominated by noise | Noise dominated (total time) | Noise dominated (detector-on time) | Marked lightcurve |
|---|---|---|---|---|---|---|---|
| A | 7300 | 6191 | 625 | 625 | 8.56% | 10.10% | 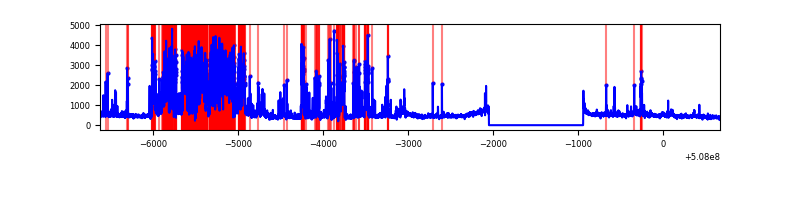 |
| B | 7301 | 6192 | 38 | 38 | 0.52% | 0.61% | 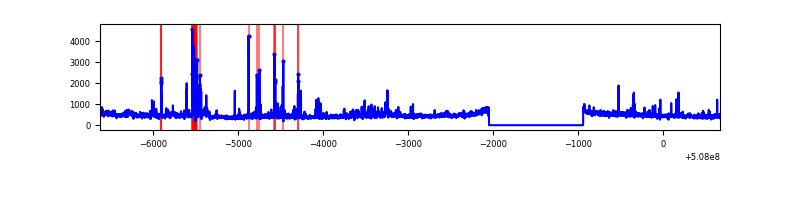 |
| C | 7301 | 6192 | 48 | 48 | 0.66% | 0.78% | 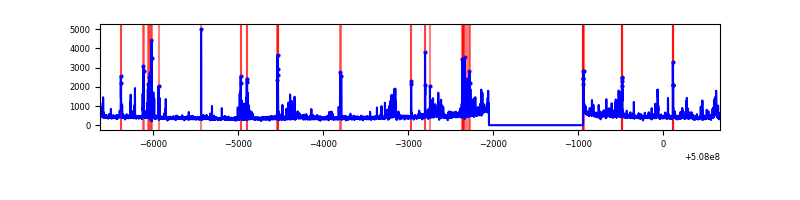 |
| D | 7301 | 6192 | 513 | 513 | 7.03% | 8.28% | 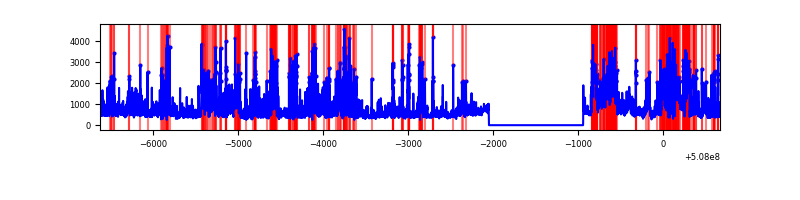 |
Top three noisy pixels from each quadrant. If the there are fewer than three noisy pixels in the level2.evt file, extra rows are filled as -1
| Pixel properties | Quadrant properties | ||||||
|---|---|---|---|---|---|---|---|
| Quadrant | DetID | PixID | Counts | Sigma | Mean | Median | Sigma |
| A | 15 | 32 | 2351377 | 15130.27 | 626 | 609 | 155.4 |
| A | 7 | 64 | 242493 | 1556.84 | 626 | 609 | 155.4 |
| A | 4 | 78 | 56892 | 362.25 | 626 | 609 | 155.4 |
| B | 0 | 199 | 80908 | 577.35 | 649 | 628 | 139.0 |
| B | 0 | 213 | 74953 | 534.53 | 649 | 628 | 139.0 |
| B | 3 | 16 | 74708 | 532.76 | 649 | 628 | 139.0 |
| C | 2 | 12 | 197673 | 1136.71 | 626 | 622 | 173.4 |
| C | 12 | 252 | 107721 | 617.81 | 626 | 622 | 173.4 |
| C | 15 | 199 | 81989 | 469.37 | 626 | 622 | 173.4 |
| D | 11 | 129 | 2545470 | 14634.77 | 605 | 575 | 173.9 |
| D | 6 | 239 | 169109 | 969.18 | 605 | 575 | 173.9 |
| D | 10 | 199 | 156307 | 895.56 | 605 | 575 | 173.9 |
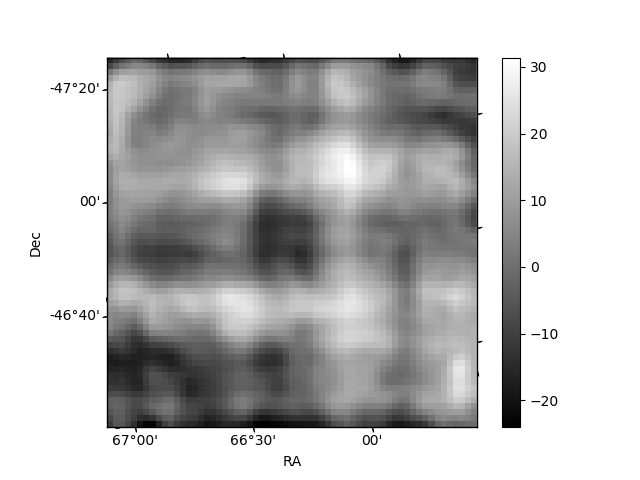
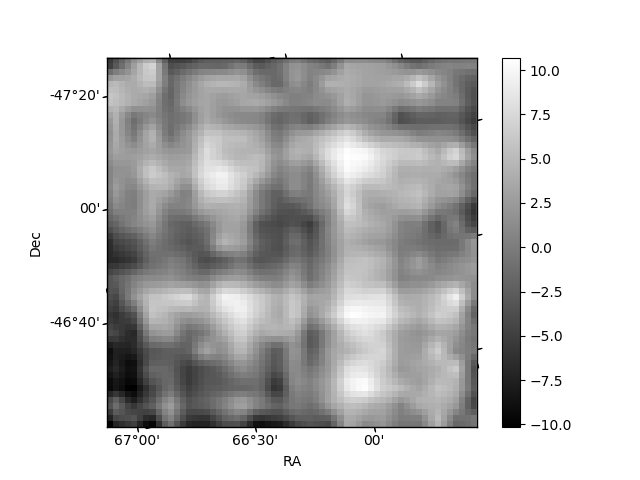
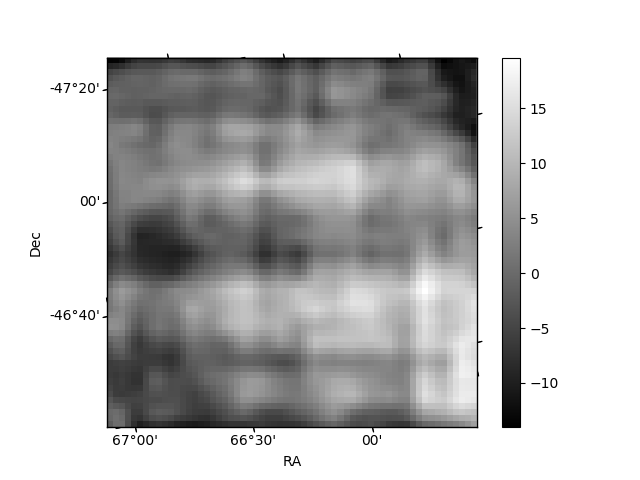
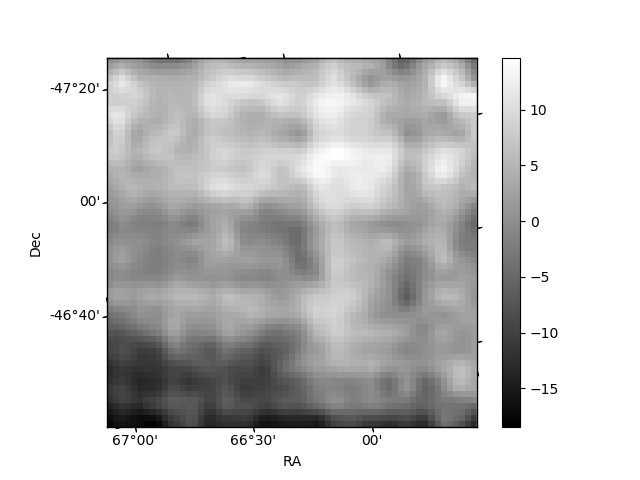
Histogram calculated using DETX and DETY for each event in the final _common_clean file
| Quadrant A | 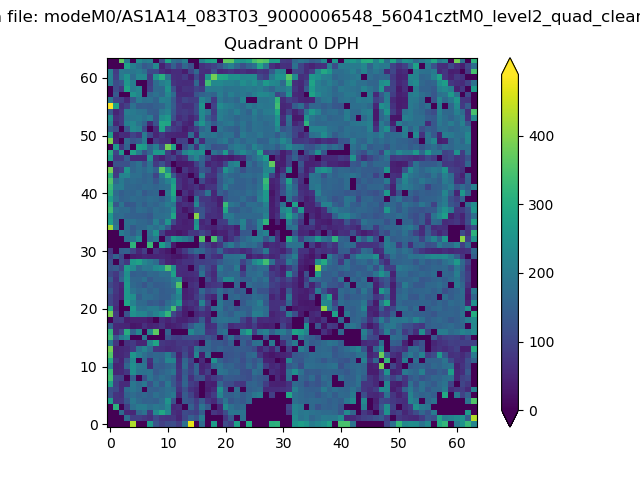 |
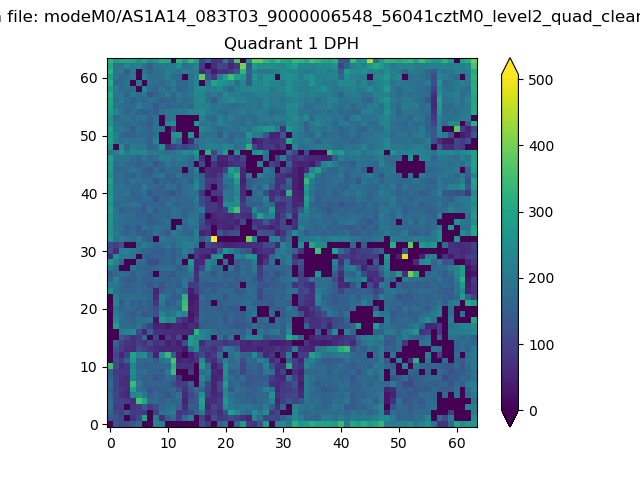 |
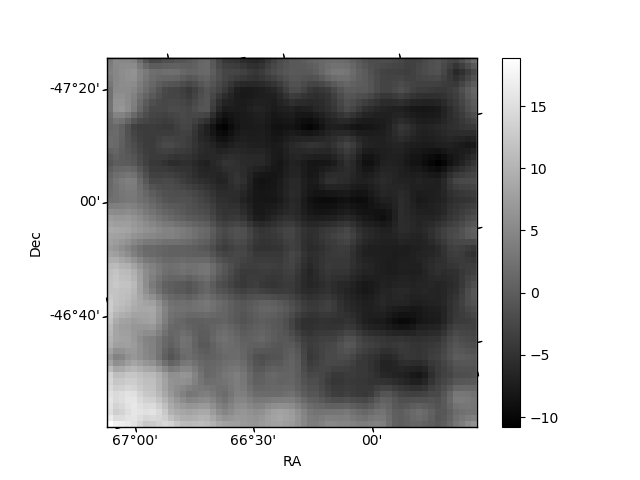
Quadrant B |
|---|---|---|---|
| Quadrant D | 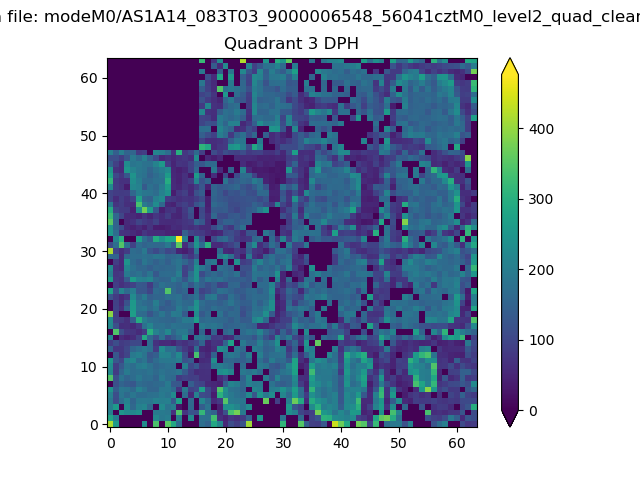 |
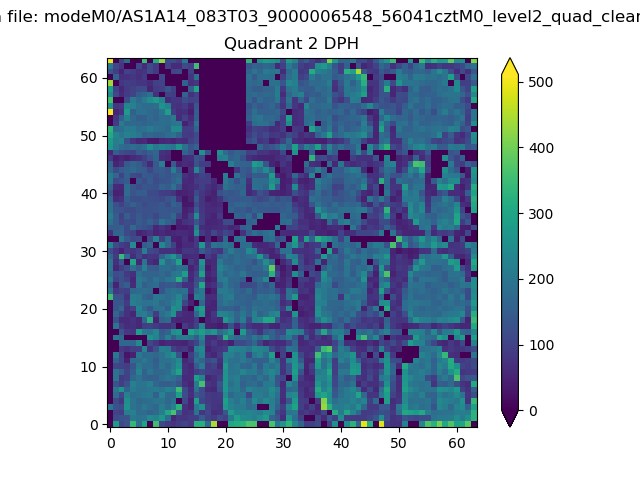 |
Quadrant C |
| Plot type | Count rate plots | Images |
|---|---|---|
| Comparison with Poisson distribution Blue bars denote a histogram of data divided into 1 sec bins. Red curve is a Poisson curve with rate = median count rate of data. |
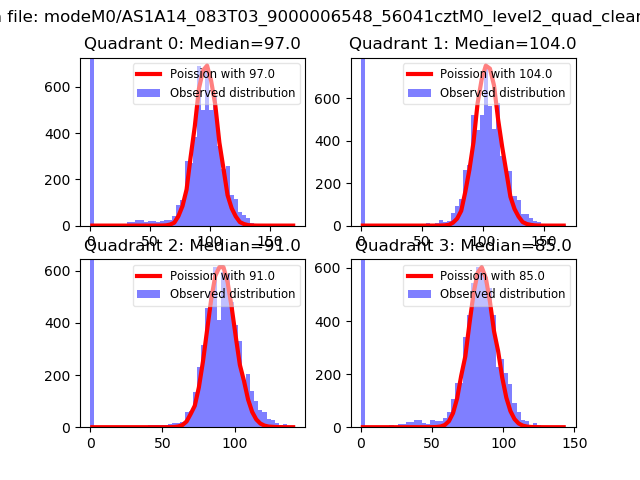 |
 |
| Quadrant-wise count rates Data is divided into 100 sec bins |
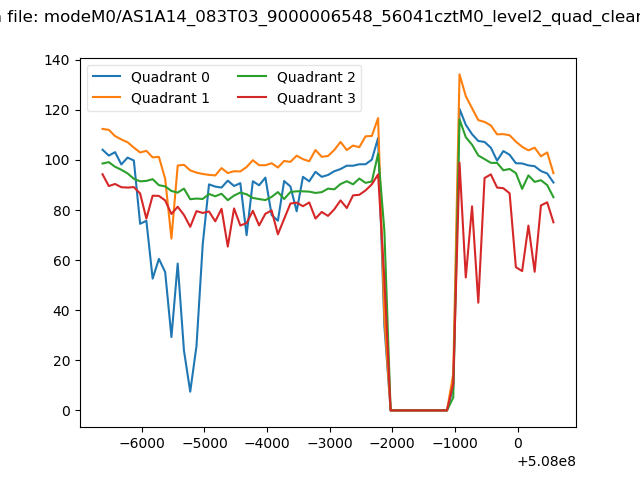 |
|
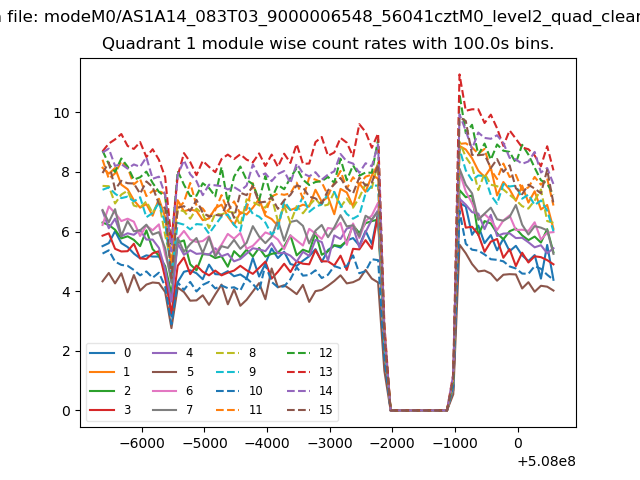
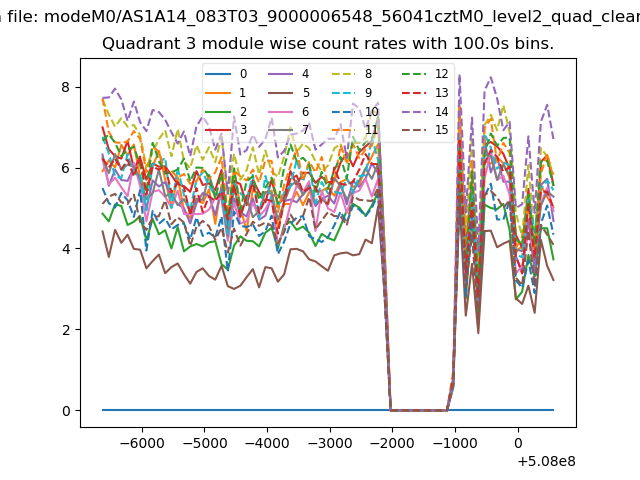
| Module-wise count rates for Quadrant A Data is divided into 100 sec bins |
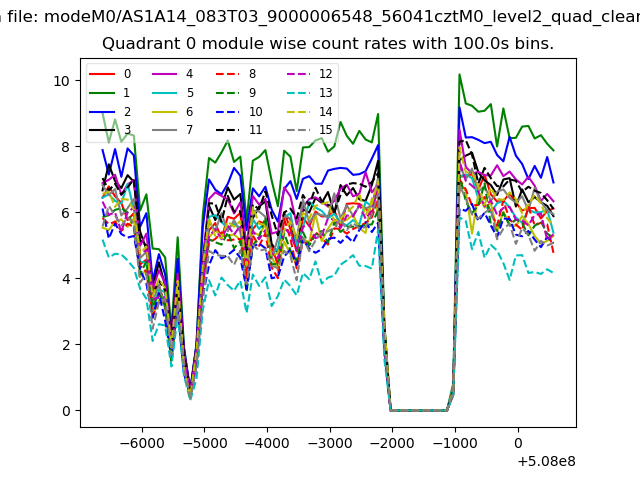 |
 |
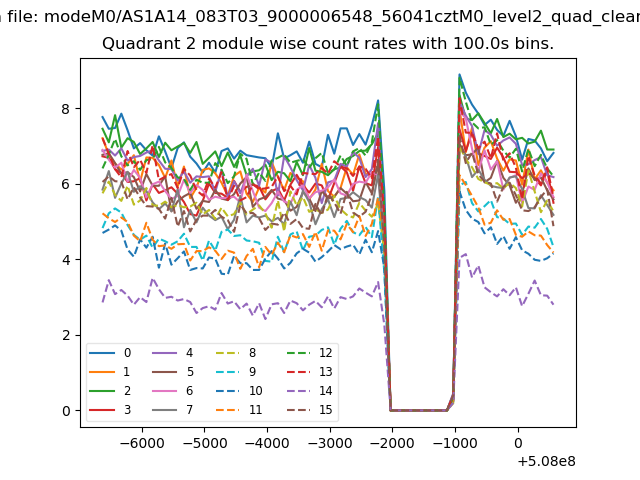
| Module-wise count rates for Quadrant B Data is divided into 100 sec bins |
 |
 |
| Module-wise count rates for Quadrant C Data is divided into 100 sec bins |
 |
 |
| Module-wise count rates for Quadrant D Data is divided into 100 sec bins |
 |
 |
| Parameter | Plot |
|---|---|
| CZT HV Monitor | 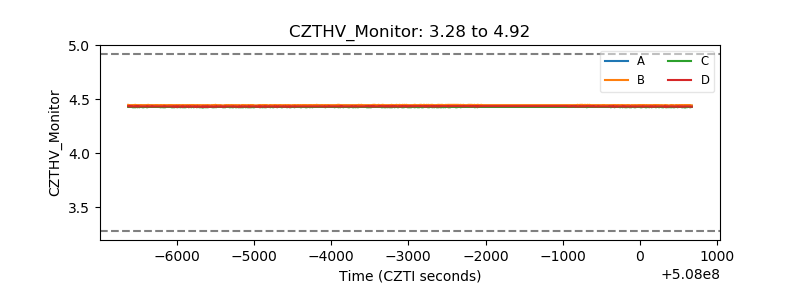 |
| D_VDD | 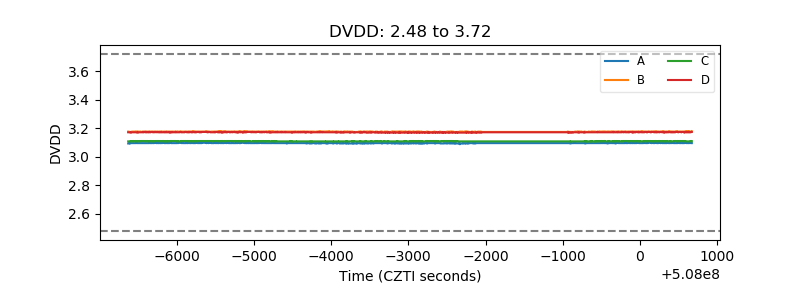 |
| Temperature 1 | 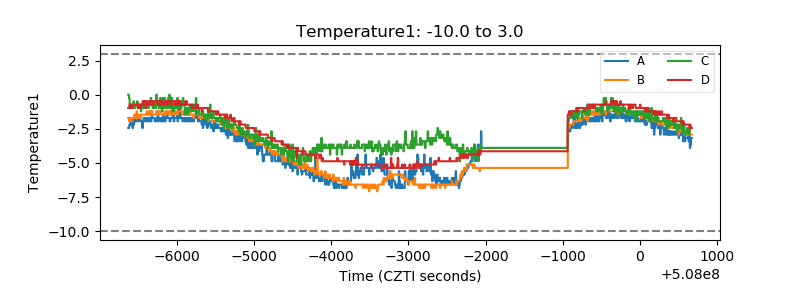 |
| Veto HV Monitor | 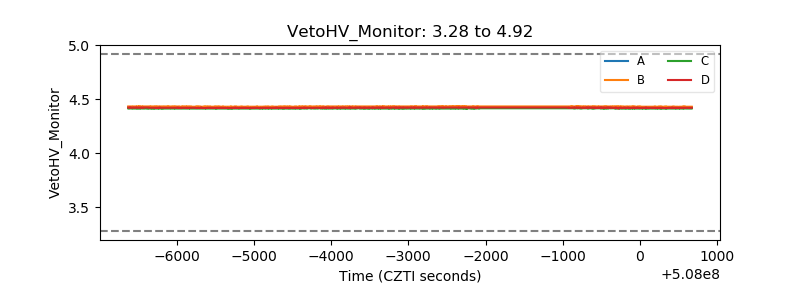 |
| Veto LLD | 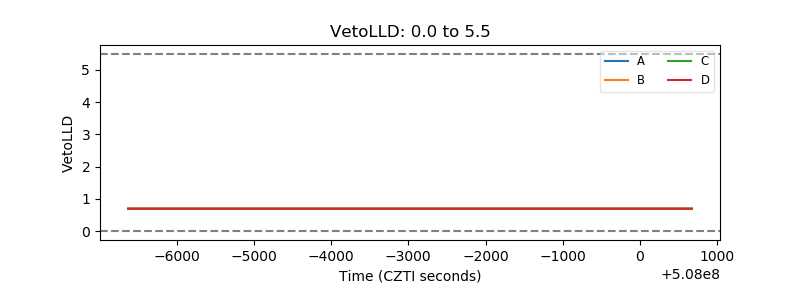 |
| Alpha Counter | 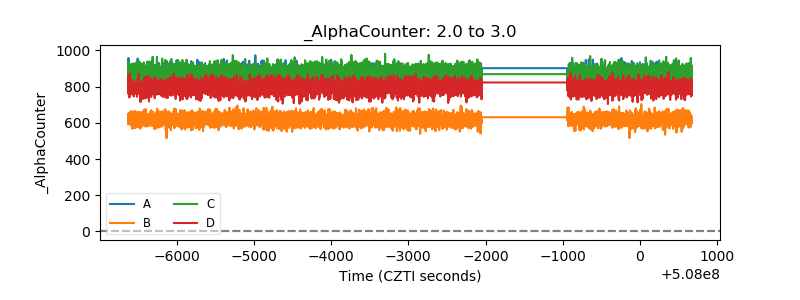 |
| _CPM_Rate | 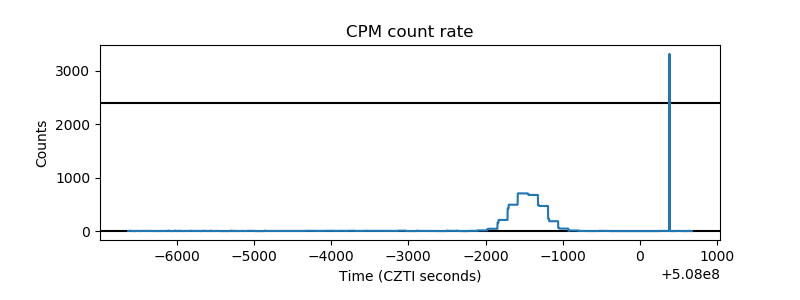 |
| CZT Counter | 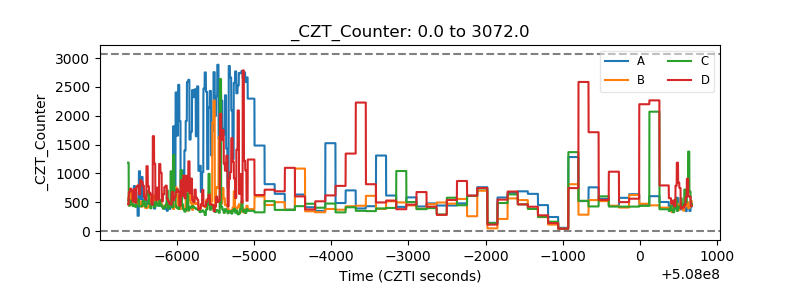 |
| +2.5 Volts monitor |  |
| +5 Volts monitor |  |
| _ROLL_ROT | 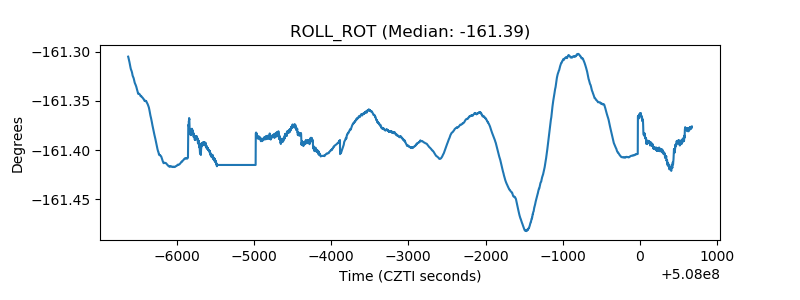 |
| _Roll_DEC | 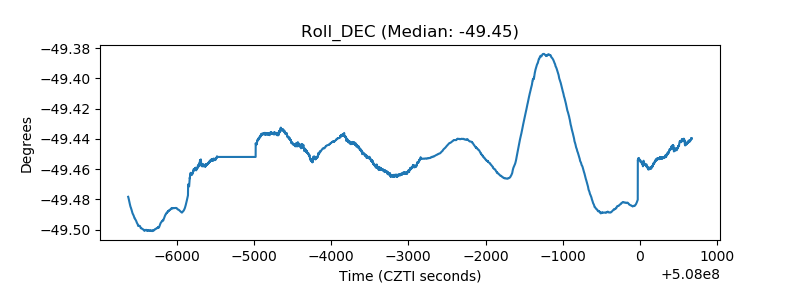 |
| _Roll_RA | 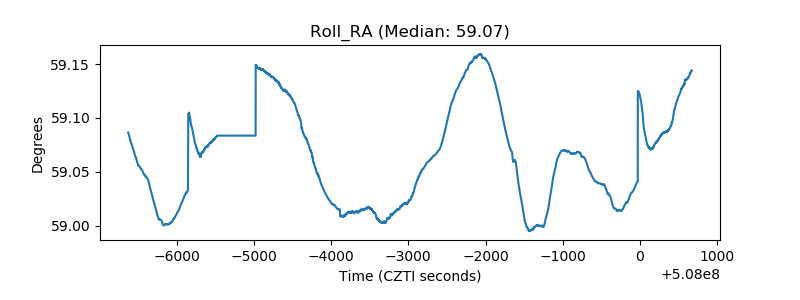 |
| Veto Counter | 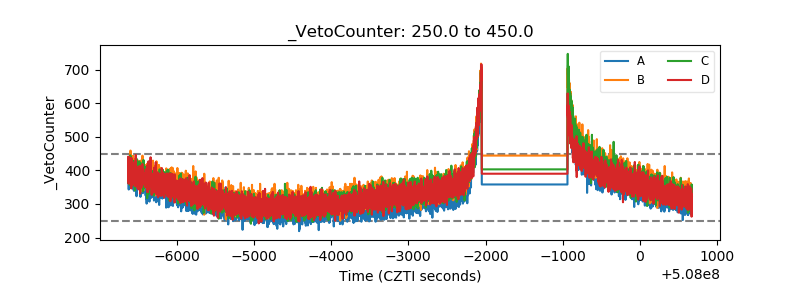 |