| Param | Original file | Final file |
|---|---|---|
| Filename | modeM0/AS1A14_083T03_9000006548_56043cztM0_level2.fits | modeM0/AS1A14_083T03_9000006548_56043cztM0_level2_quad_clean.evt |
| Size (bytes) | 501,693,120 | 90,192,960 |
| Size | 478.5 MB | 86.0 MB |
| Events in quadrant A | 3,496,858 | 604,926 |
| Events in quadrant B | 3,283,261 | 666,067 |
| Events in quadrant C | 3,573,369 | 578,555 |
| Events in quadrant D | 7,713,376 | 429,014 |
| Mode M0 | |||
|---|---|---|---|
| Quadrant | BADHDUFLAG | Total packets | Discarded packets |
| A | 0 | 15246 | 2 |
| B | 0 | 14427 | 2 |
| C | 0 | 15554 | 2 |
| D | 0 | 27451 | 2 |
| Mode SS | |||
|---|---|---|---|
| Quadrant | BADHDUFLAG | Total packets | Discarded packets |
| A | 0 | 132 | 0 |
| B | 0 | 132 | 0 |
| C | 0 | 132 | 0 |
| D | 0 | 132 | 0 |
| Mode M9 | |||
|---|---|---|---|
| Quadrant | BADHDUFLAG | Total packets | Discarded packets |
| A | 0 | 12 | 0 |
| B | 0 | 13 | 0 |
| C | 0 | 13 | 0 |
| D | 0 | 13 | 0 |
| Quadrant | Total seconds | Saturated seconds | Saturation percentage |
|---|---|---|---|
| A | 6485 | 186 | 2.868157% |
| B | 6485 | 99 | 1.526600% |
| C | 6485 | 126 | 1.942945% |
| D | 6485 | 1524 | 23.500386% |
Noise dominated data is calculated using 1-second bins in cleaned event files. If a bin has >2000 counts, and if more than 50% of those come from <1% of pixels, then it is considered to be noise-dominated and hence unusable.
| Quadrant | # 1 sec bins | Bins with >0 counts | Bins with >2000 counts | High rate bins dominated by noise | Noise dominated (total time) | Noise dominated (detector-on time) | Marked lightcurve |
|---|---|---|---|---|---|---|---|
| A | 7580 | 6486 | 112 | 112 | 1.48% | 1.73% | 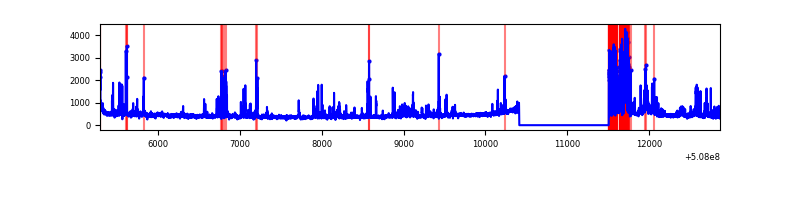 |
| B | 7580 | 6486 | 27 | 27 | 0.36% | 0.42% | 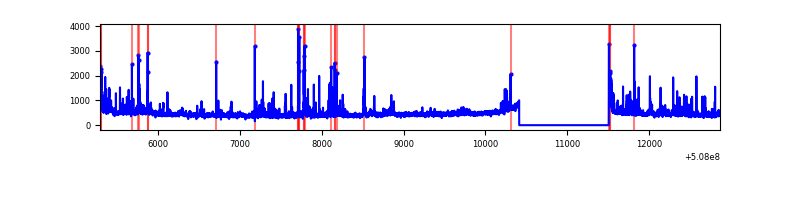 |
| C | 7580 | 6486 | 112 | 112 | 1.48% | 1.73% | 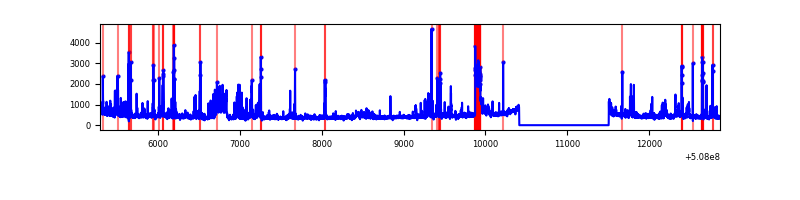 |
| D | 7580 | 6486 | 1323 | 1323 | 17.45% | 20.40% | 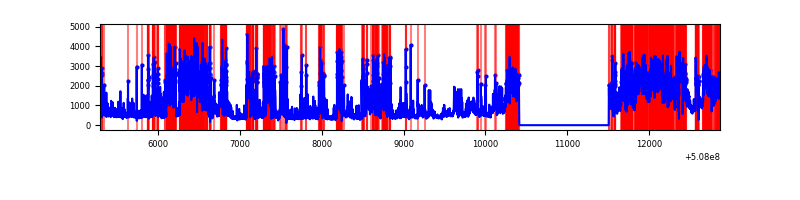 |
Top three noisy pixels from each quadrant. If the there are fewer than three noisy pixels in the level2.evt file, extra rows are filled as -1
| Pixel properties | Quadrant properties | ||||||
|---|---|---|---|---|---|---|---|
| Quadrant | DetID | PixID | Counts | Sigma | Mean | Median | Sigma |
| A | 7 | 64 | 536072 | 3193.74 | 676 | 660 | 167.6 |
| A | 4 | 249 | 239447 | 1424.37 | 676 | 660 | 167.6 |
| A | 4 | 3 | 44299 | 260.31 | 676 | 660 | 167.6 |
| B | 0 | 213 | 160844 | 1102.31 | 678 | 654 | 145.3 |
| B | 10 | 247 | 103294 | 706.29 | 678 | 654 | 145.3 |
| B | 5 | 185 | 96250 | 657.82 | 678 | 654 | 145.3 |
| C | 15 | 147 | 480292 | 2694.58 | 650 | 646 | 178.0 |
| C | 12 | 252 | 134372 | 751.25 | 650 | 646 | 178.0 |
| C | 6 | 223 | 110163 | 615.25 | 650 | 646 | 178.0 |
| D | 11 | 129 | 4858300 | 29018.38 | 582 | 555 | 167.4 |
| D | 2 | 249 | 232430 | 1385.14 | 582 | 555 | 167.4 |
| D | 6 | 239 | 86036 | 510.63 | 582 | 555 | 167.4 |
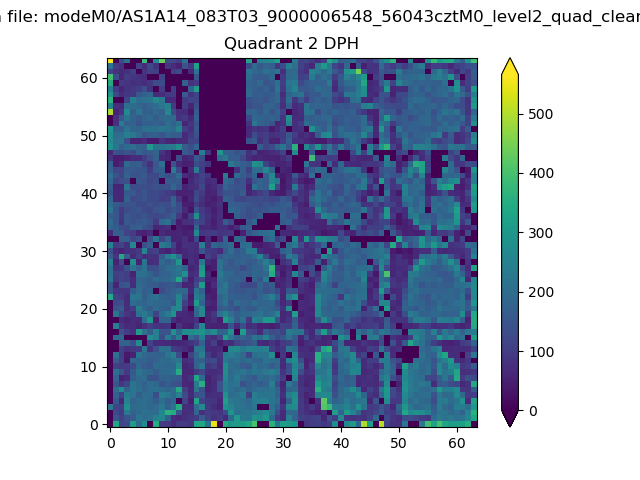
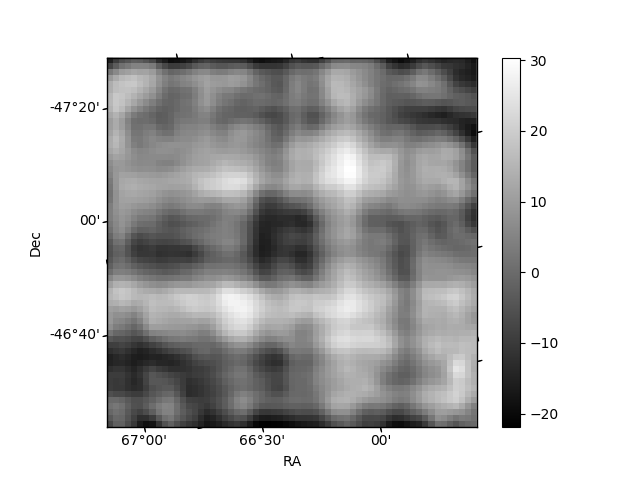
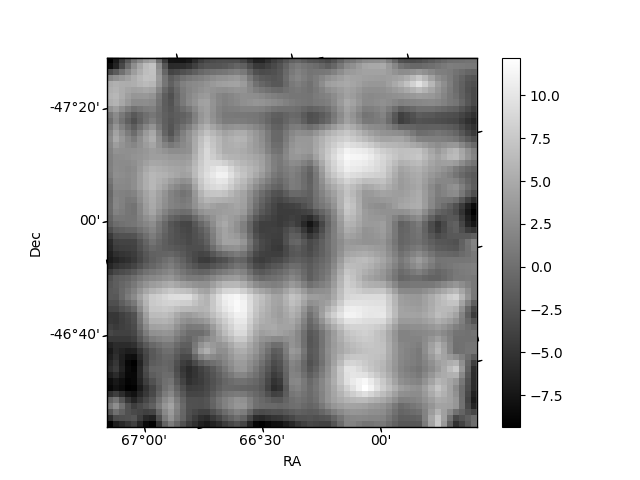
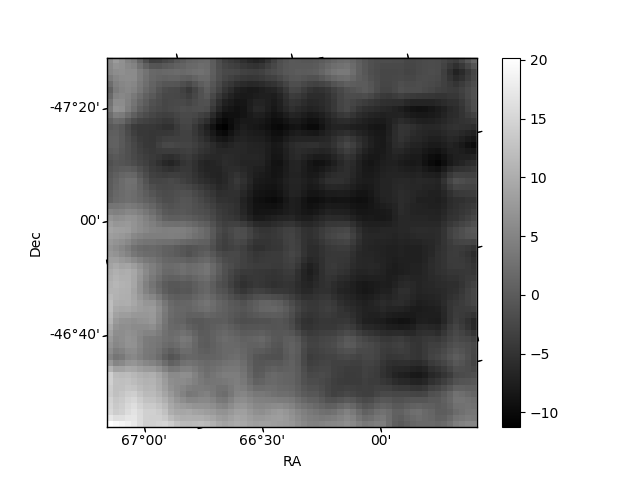
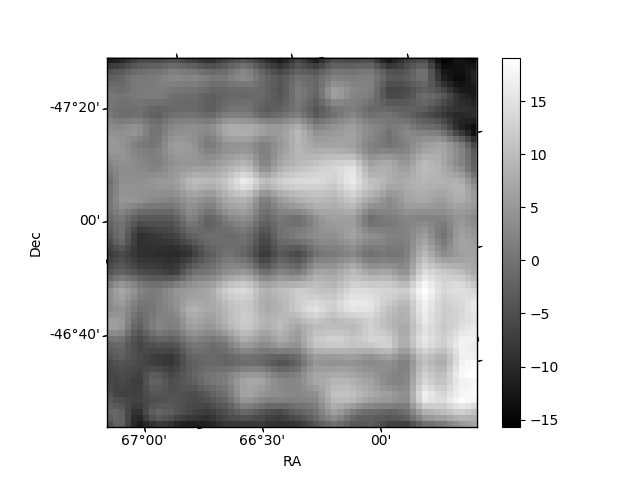
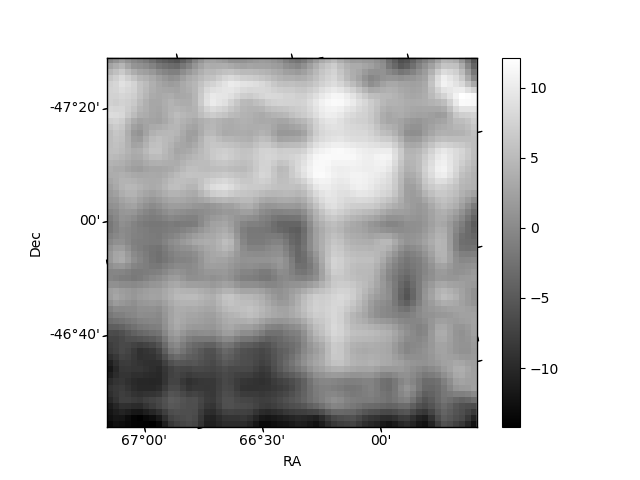
Histogram calculated using DETX and DETY for each event in the final _common_clean file
| Quadrant A | 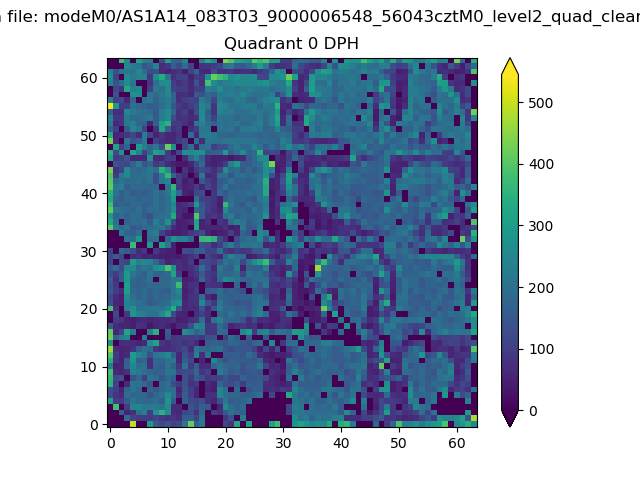 |
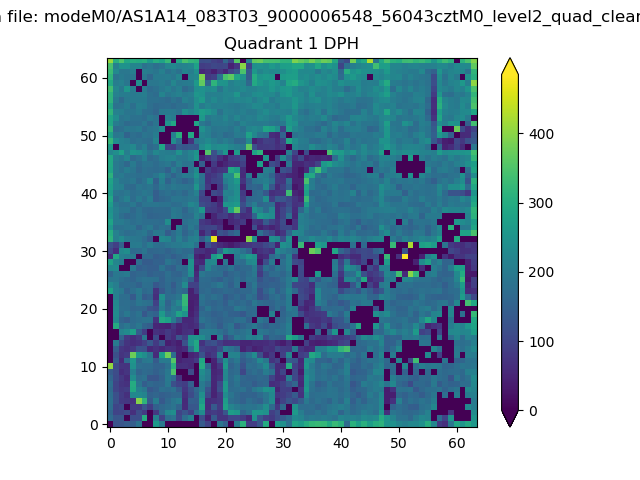 |
Quadrant B |
|---|---|---|---|
| Quadrant D | 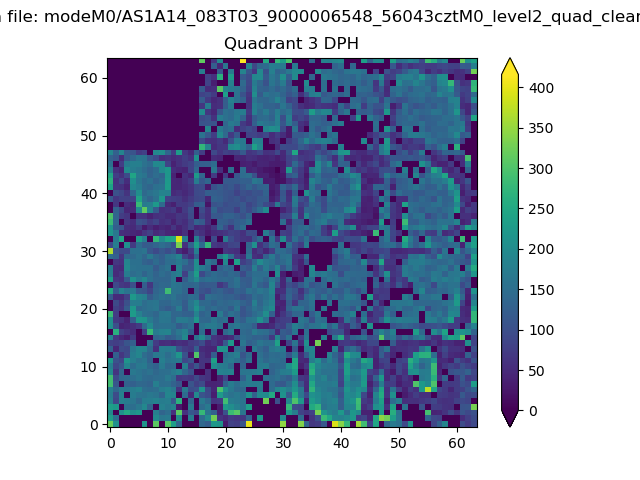 |
 |
Quadrant C |
| Plot type | Count rate plots | Images |
|---|---|---|
| Comparison with Poisson distribution Blue bars denote a histogram of data divided into 1 sec bins. Red curve is a Poisson curve with rate = median count rate of data. |
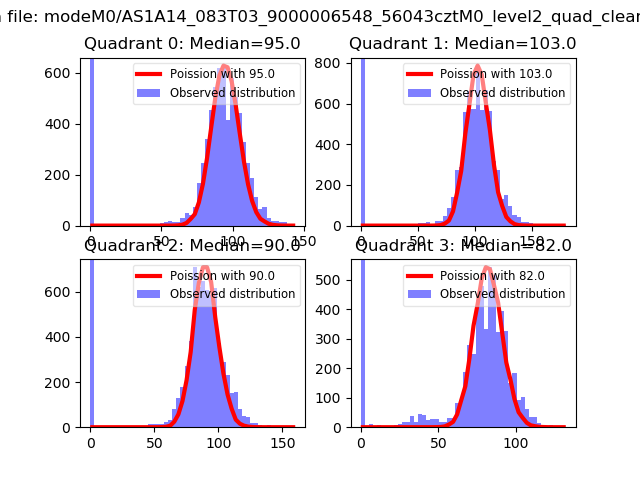 |
 |
| Quadrant-wise count rates Data is divided into 100 sec bins |
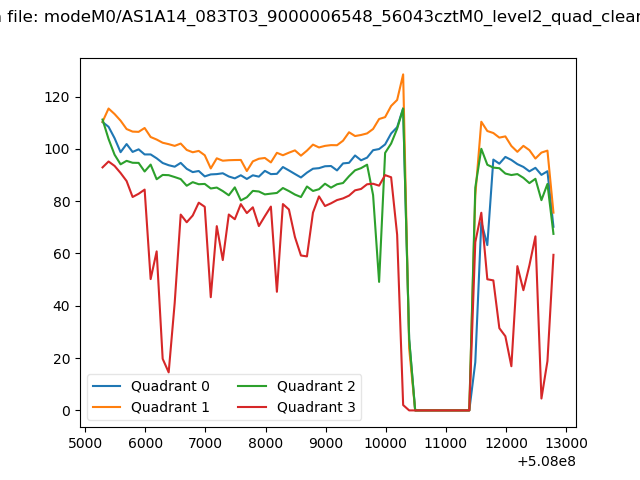 |
|
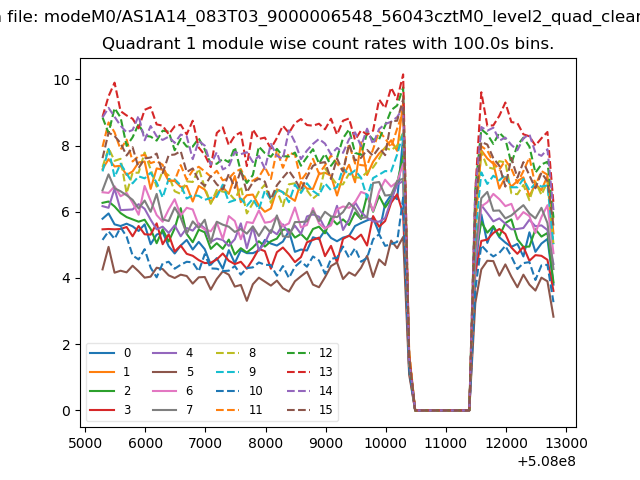
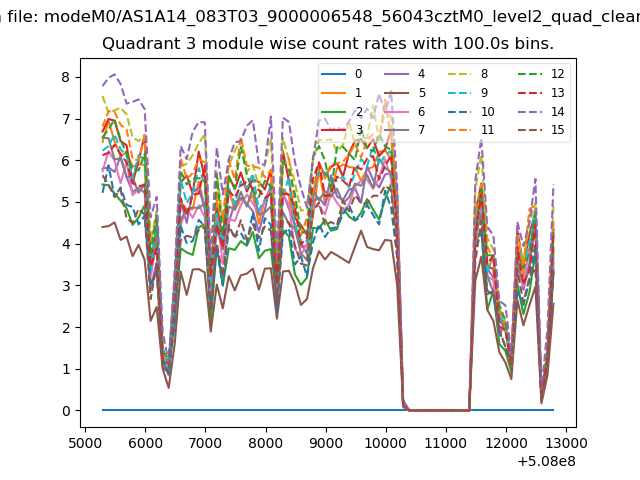
| Module-wise count rates for Quadrant A Data is divided into 100 sec bins |
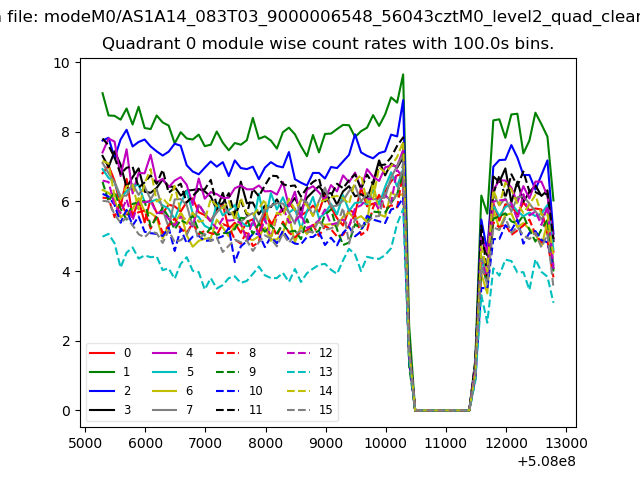 |
 |
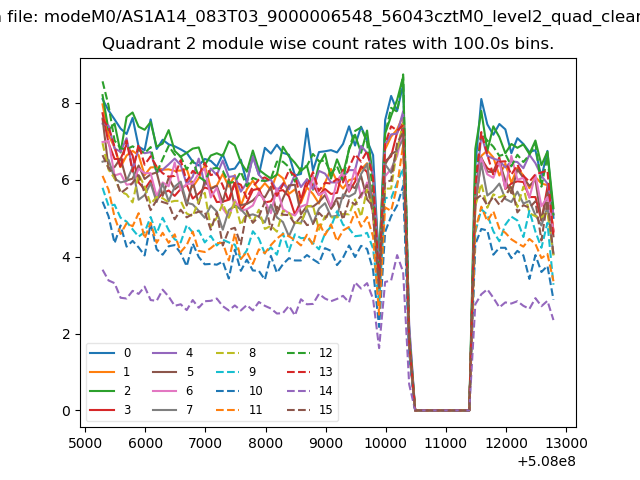
| Module-wise count rates for Quadrant B Data is divided into 100 sec bins |
 |
 |
| Module-wise count rates for Quadrant C Data is divided into 100 sec bins |
 |
 |
| Module-wise count rates for Quadrant D Data is divided into 100 sec bins |
 |
 |
| Parameter | Plot |
|---|---|
| CZT HV Monitor | 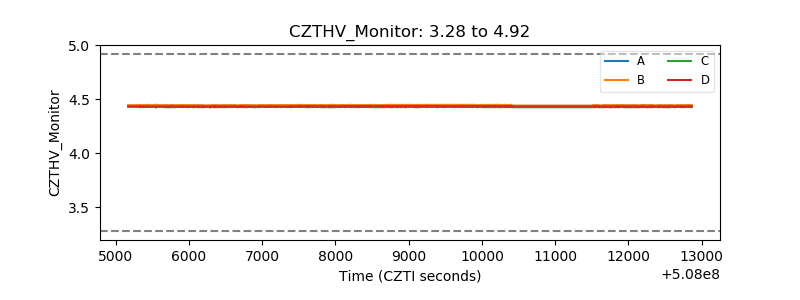 |
| D_VDD | 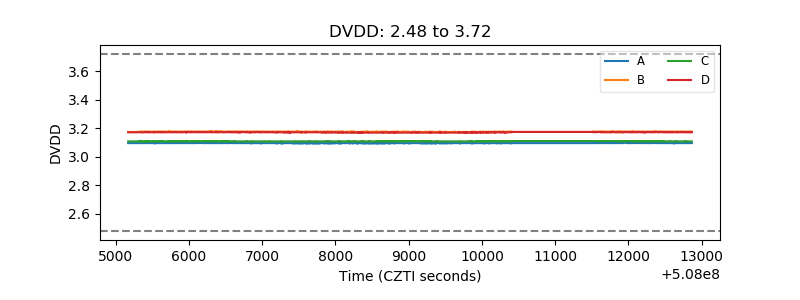 |
| Temperature 1 | 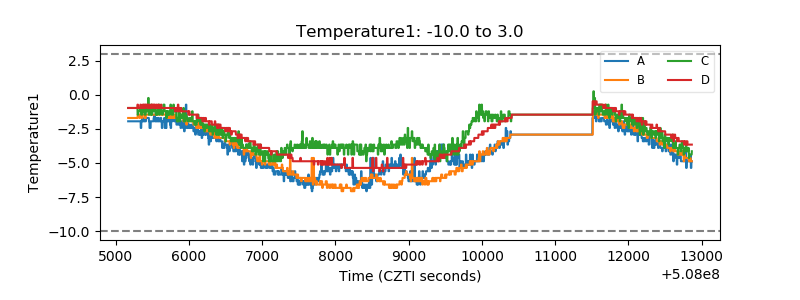 |
| Veto HV Monitor | 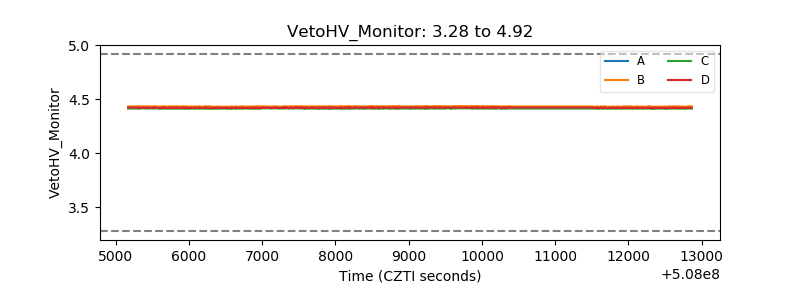 |
| Veto LLD | 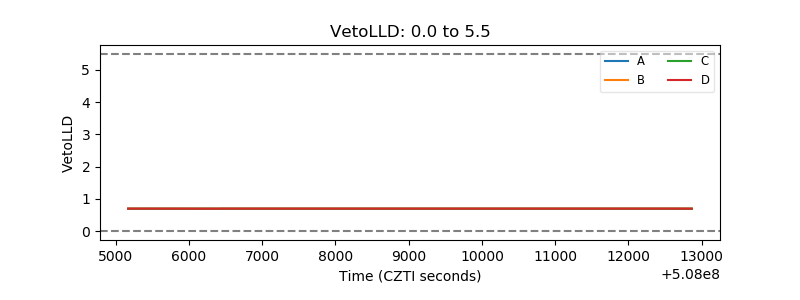 |
| Alpha Counter | 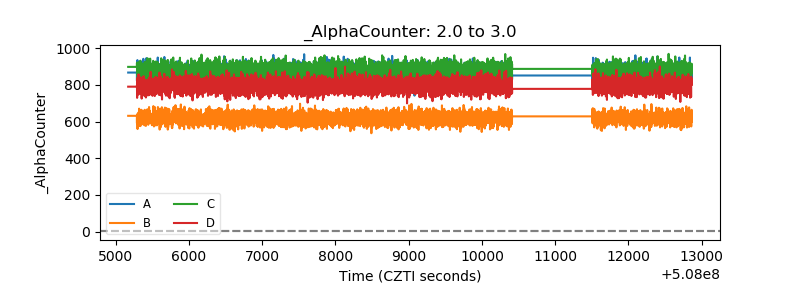 |
| _CPM_Rate | 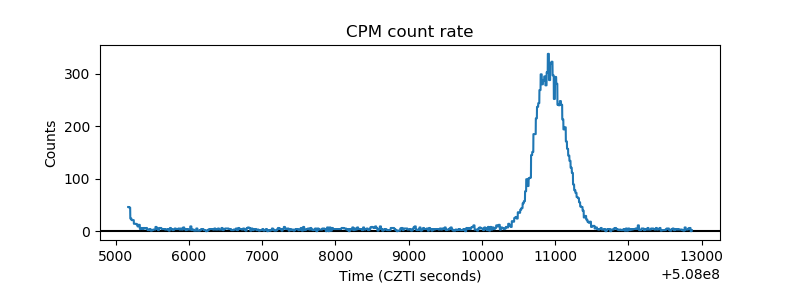 |
| CZT Counter | 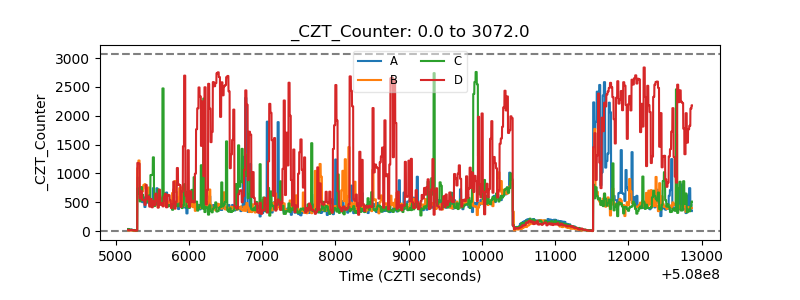 |
| +2.5 Volts monitor | 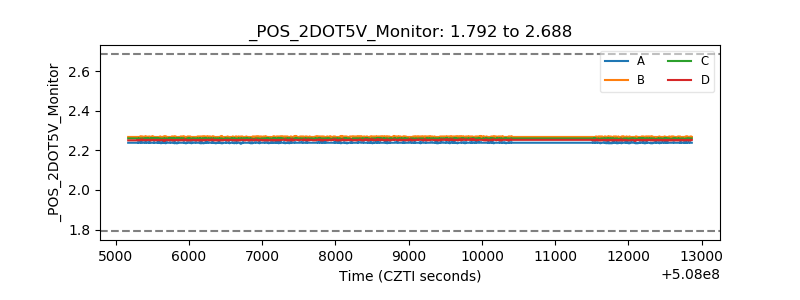 |
| +5 Volts monitor |  |
| _ROLL_ROT | 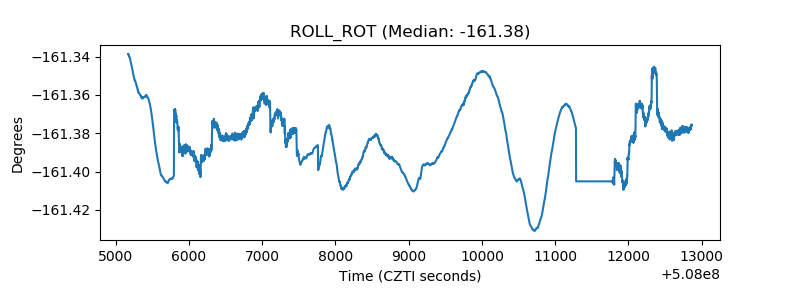 |
| _Roll_DEC | 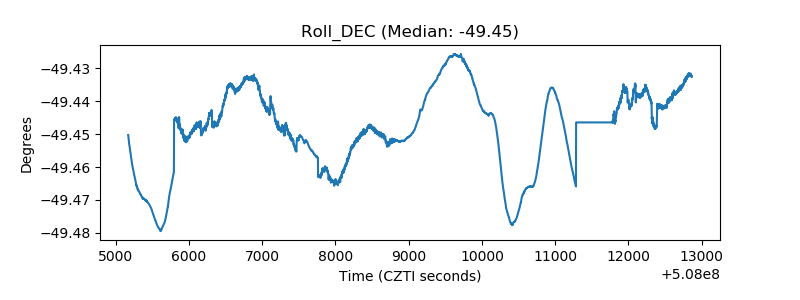 |
| _Roll_RA | 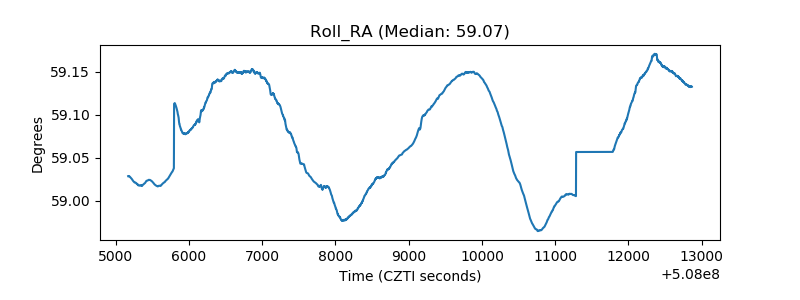 |
| Veto Counter | 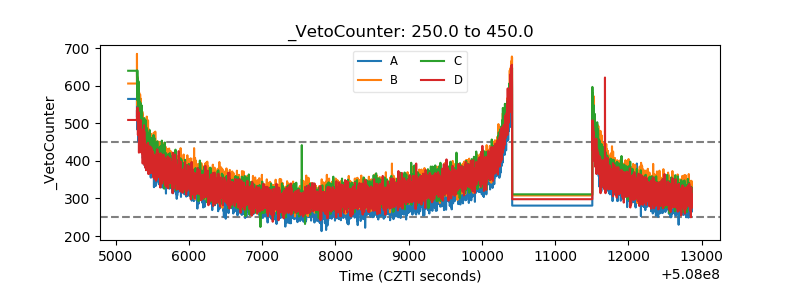 |