| Param | Original file | Final file |
|---|---|---|
| Filename | modeM0/AS1A14_083T03_9000006548_56044cztM0_level2.fits | modeM0/AS1A14_083T03_9000006548_56044cztM0_level2_quad_clean.evt |
| Size (bytes) | 476,472,960 | 90,728,640 |
| Size | 454.4 MB | 86.5 MB |
| Events in quadrant A | 3,891,782 | 598,693 |
| Events in quadrant B | 3,331,876 | 653,470 |
| Events in quadrant C | 3,112,007 | 581,121 |
| Events in quadrant D | 6,790,450 | 455,106 |
| Mode M0 | |||
|---|---|---|---|
| Quadrant | BADHDUFLAG | Total packets | Discarded packets |
| A | 0 | 16385 | 1 |
| B | 0 | 14529 | 1 |
| C | 0 | 14446 | 1 |
| D | 0 | 24882 | 1 |
| Mode SS | |||
|---|---|---|---|
| Quadrant | BADHDUFLAG | Total packets | Discarded packets |
| A | 0 | 134 | 0 |
| B | 0 | 134 | 0 |
| C | 0 | 134 | 0 |
| D | 0 | 134 | 0 |
| Mode M9 | |||
|---|---|---|---|
| Quadrant | BADHDUFLAG | Total packets | Discarded packets |
| A | 0 | 8 | 0 |
| B | 0 | 8 | 0 |
| C | 0 | 8 | 0 |
| D | 0 | 8 | 0 |
| Quadrant | Total seconds | Saturated seconds | Saturation percentage |
|---|---|---|---|
| A | 6575 | 205 | 3.117871% |
| B | 6576 | 90 | 1.368613% |
| C | 6576 | 47 | 0.714720% |
| D | 6576 | 1172 | 17.822384% |
Noise dominated data is calculated using 1-second bins in cleaned event files. If a bin has >2000 counts, and if more than 50% of those come from <1% of pixels, then it is considered to be noise-dominated and hence unusable.
| Quadrant | # 1 sec bins | Bins with >0 counts | Bins with >2000 counts | High rate bins dominated by noise | Noise dominated (total time) | Noise dominated (detector-on time) | Marked lightcurve |
|---|---|---|---|---|---|---|---|
| A | 7400 | 6576 | 165 | 165 | 2.23% | 2.51% | 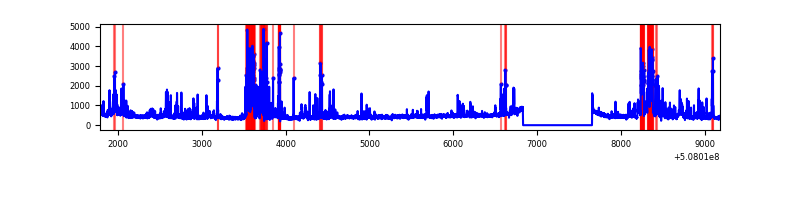 |
| B | 7401 | 6577 | 16 | 16 | 0.22% | 0.24% | 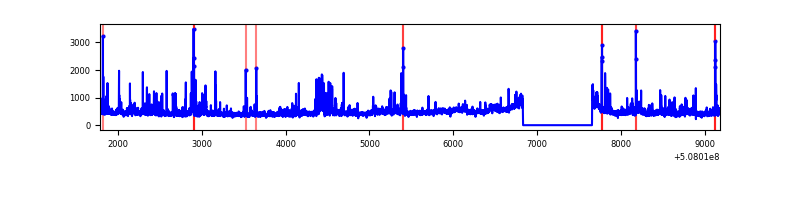 |
| C | 7401 | 6577 | 28 | 28 | 0.38% | 0.43% | 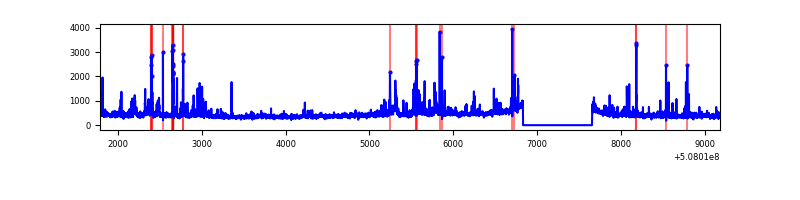 |
| D | 7401 | 6577 | 1084 | 1084 | 14.65% | 16.48% | 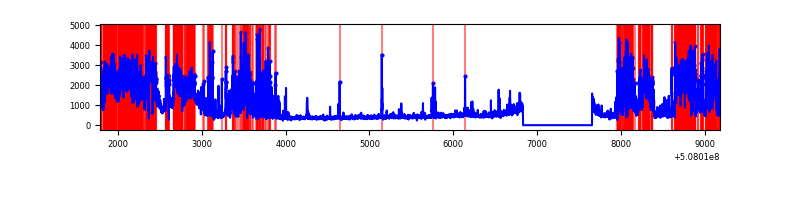 |
Top three noisy pixels from each quadrant. If the there are fewer than three noisy pixels in the level2.evt file, extra rows are filled as -1
| Pixel properties | Quadrant properties | ||||||
|---|---|---|---|---|---|---|---|
| Quadrant | DetID | PixID | Counts | Sigma | Mean | Median | Sigma |
| A | 4 | 249 | 570511 | 3374.44 | 673 | 656 | 168.9 |
| A | 7 | 64 | 405402 | 2396.74 | 673 | 656 | 168.9 |
| A | 0 | 8 | 115459 | 679.82 | 673 | 656 | 168.9 |
| B | 7 | 0 | 139364 | 954.27 | 676 | 651 | 145.4 |
| B | 0 | 213 | 137188 | 939.3 | 676 | 651 | 145.4 |
| B | 5 | 185 | 80572 | 549.81 | 676 | 651 | 145.4 |
| C | 15 | 147 | 236915 | 1314.78 | 655 | 649 | 179.7 |
| C | 12 | 252 | 91097 | 503.33 | 655 | 649 | 179.7 |
| C | 6 | 223 | 81931 | 452.32 | 655 | 649 | 179.7 |
| D | 11 | 129 | 3662971 | 21523.28 | 597 | 570 | 170.2 |
| D | 2 | 249 | 390253 | 2290.1 | 597 | 570 | 170.2 |
| D | 14 | 52 | 105577 | 617.11 | 597 | 570 | 170.2 |
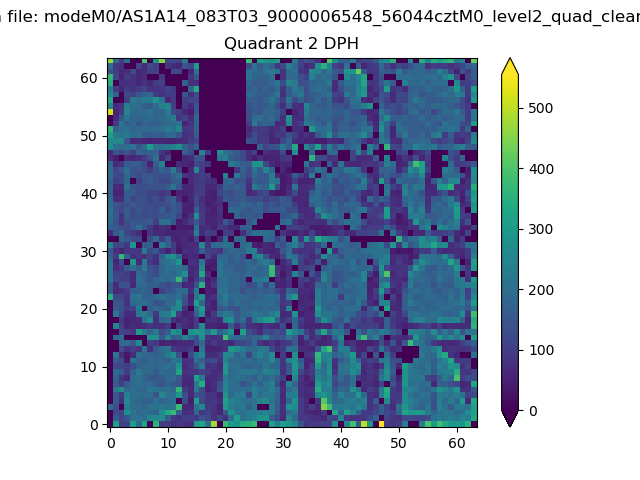
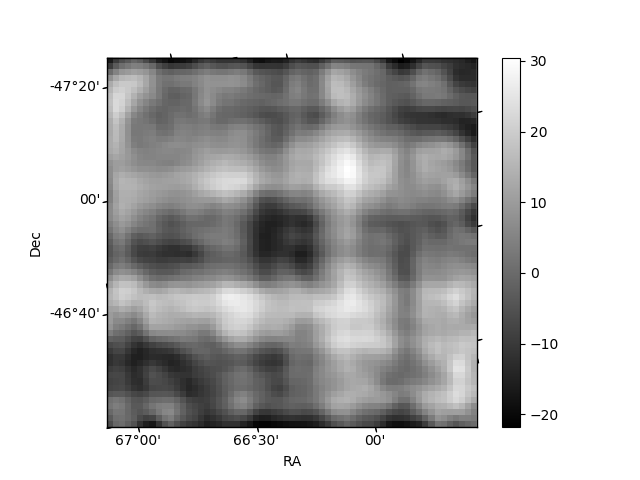
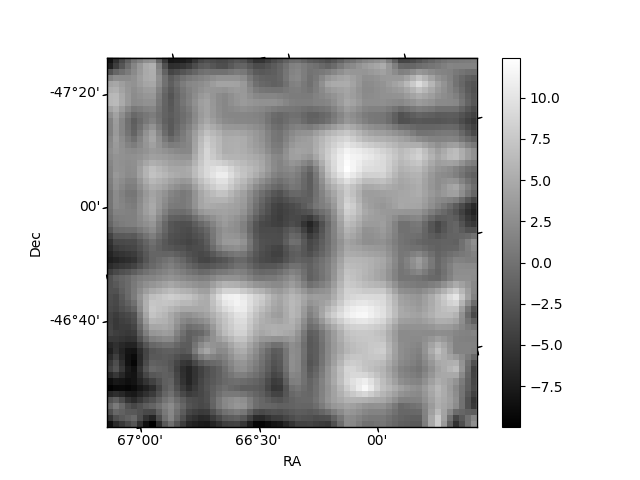
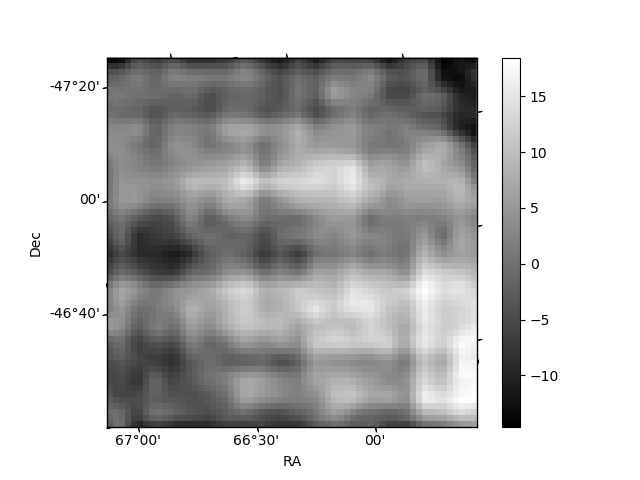
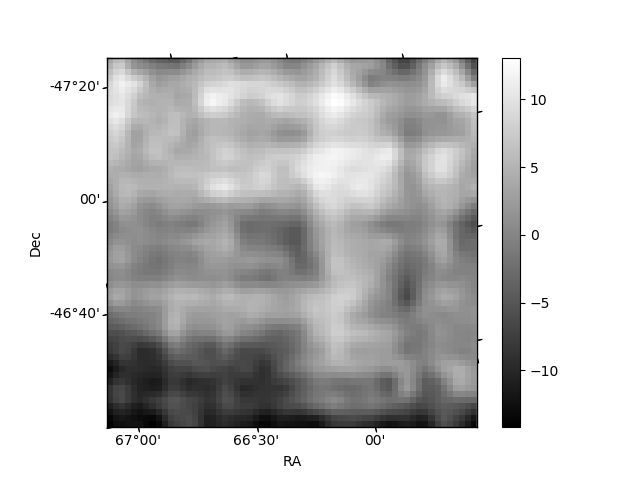
Histogram calculated using DETX and DETY for each event in the final _common_clean file
| Quadrant A | 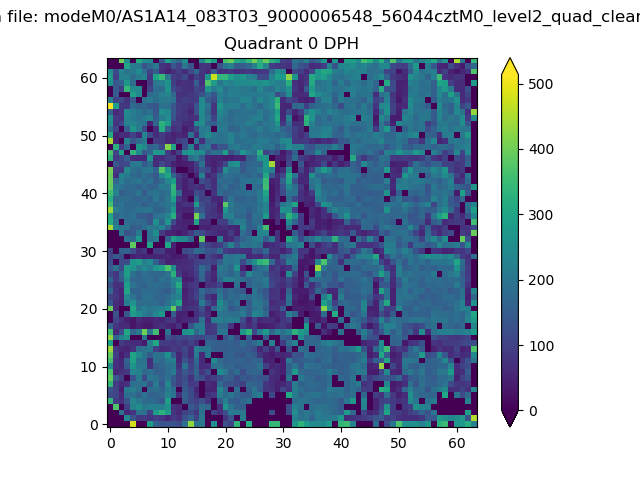 |
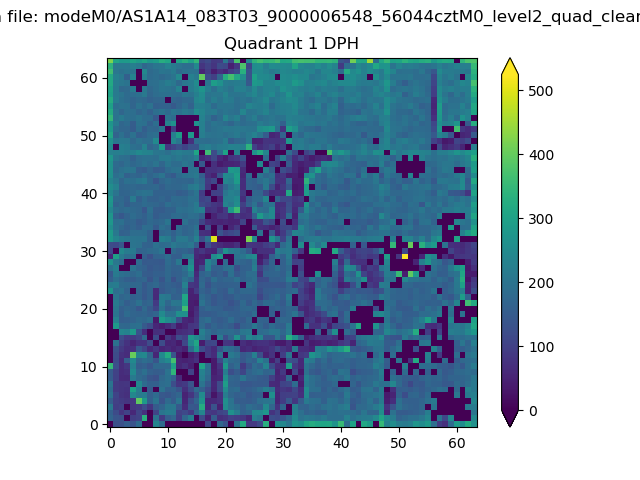 |
Quadrant B |
|---|---|---|---|
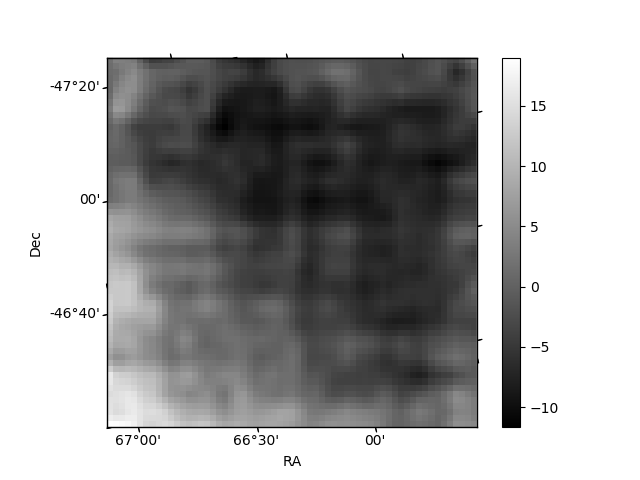
| Quadrant D | 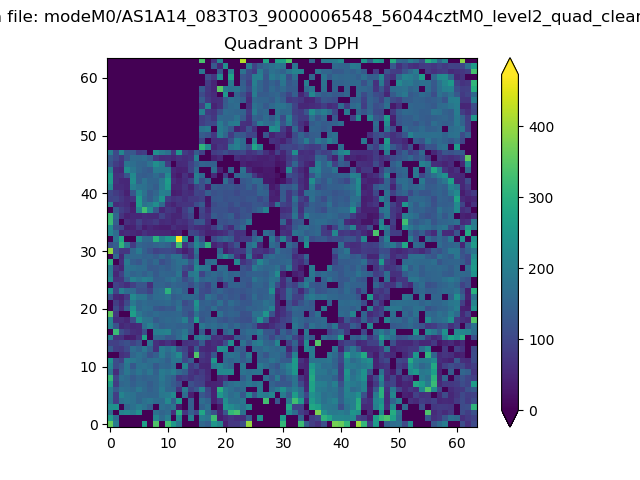 |
 |
Quadrant C |
| Plot type | Count rate plots | Images |
|---|---|---|
| Comparison with Poisson distribution Blue bars denote a histogram of data divided into 1 sec bins. Red curve is a Poisson curve with rate = median count rate of data. |
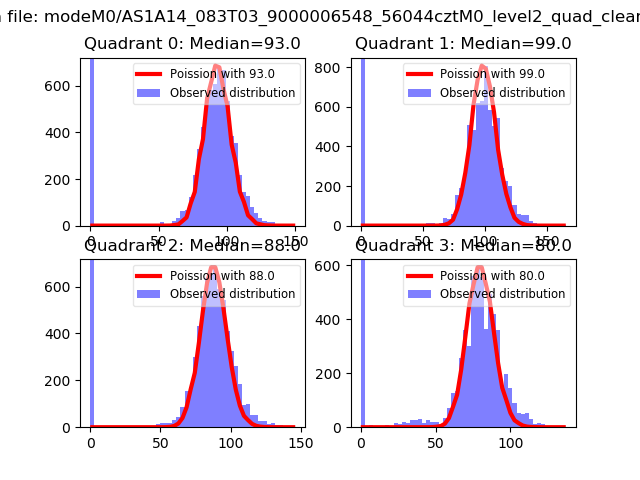 |
 |
| Quadrant-wise count rates Data is divided into 100 sec bins |
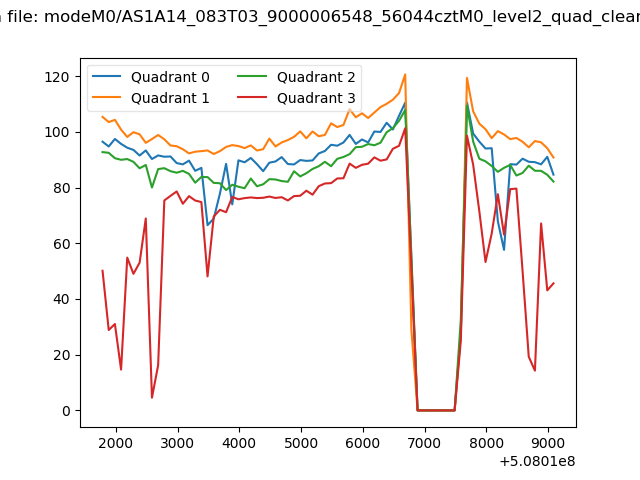 |
|
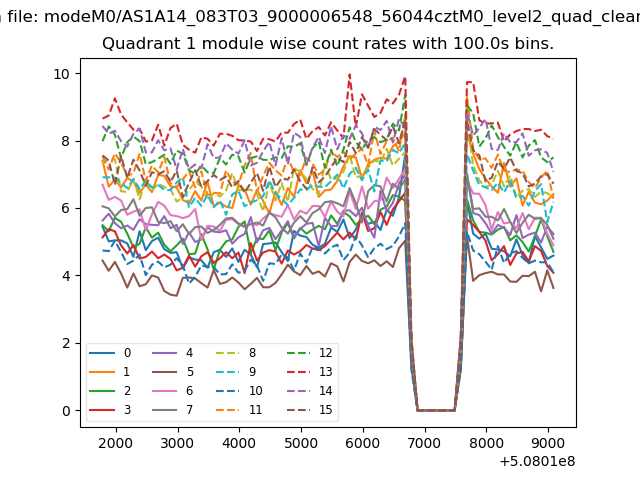
| Module-wise count rates for Quadrant A Data is divided into 100 sec bins |
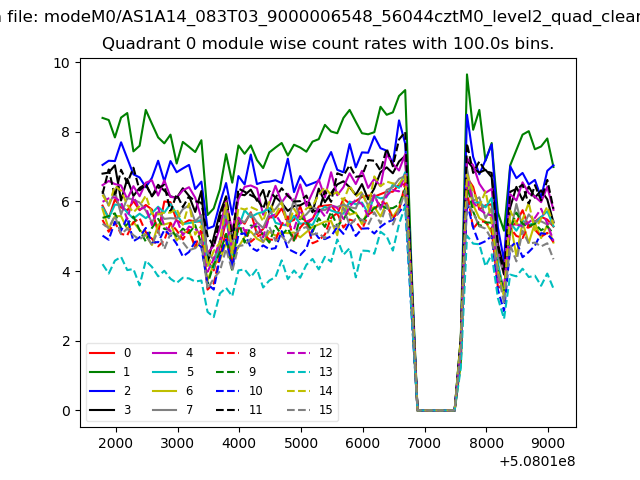 |
 |
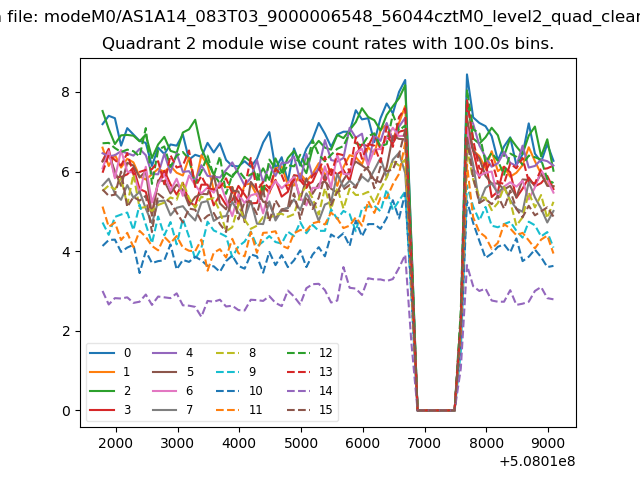
| Module-wise count rates for Quadrant B Data is divided into 100 sec bins |
 |
 |
| Module-wise count rates for Quadrant C Data is divided into 100 sec bins |
 |
 |
| Module-wise count rates for Quadrant D Data is divided into 100 sec bins |
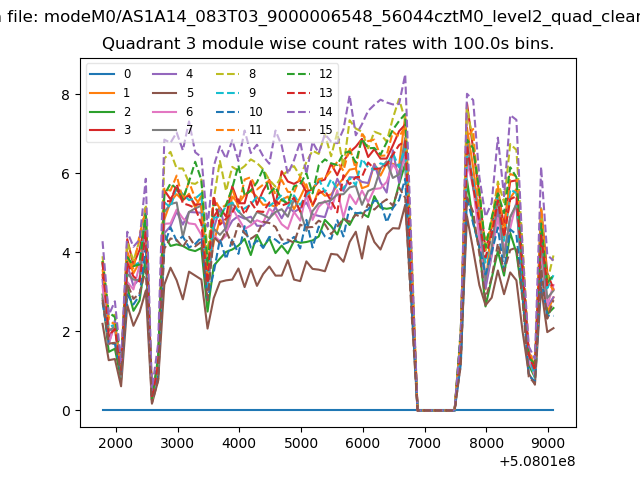 |
 |
| Parameter | Plot |
|---|---|
| CZT HV Monitor | 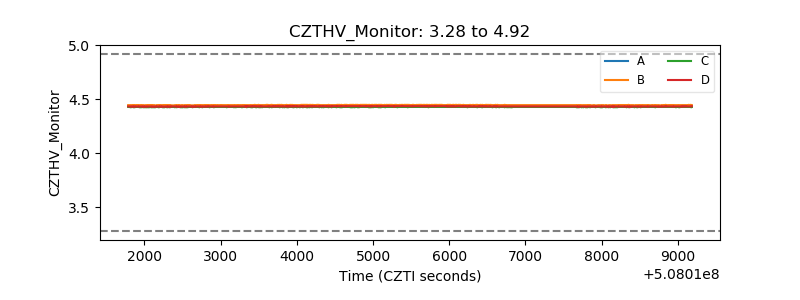 |
| D_VDD | 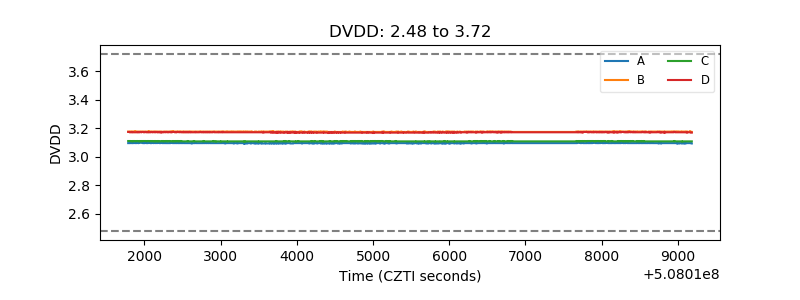 |
| Temperature 1 | 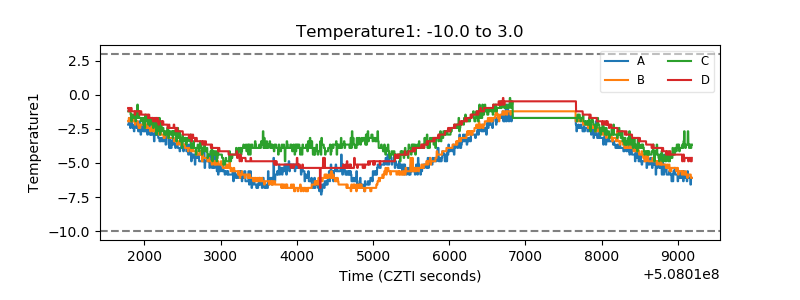 |
| Veto HV Monitor | 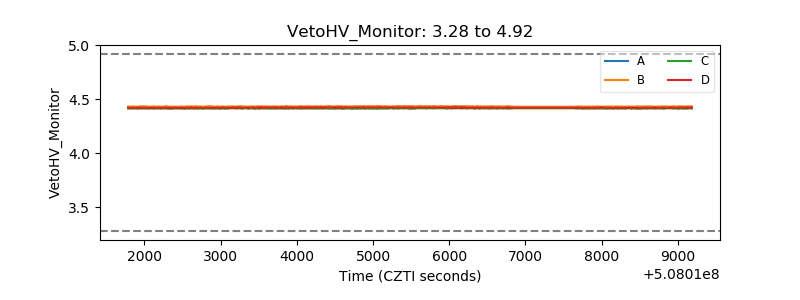 |
| Veto LLD | 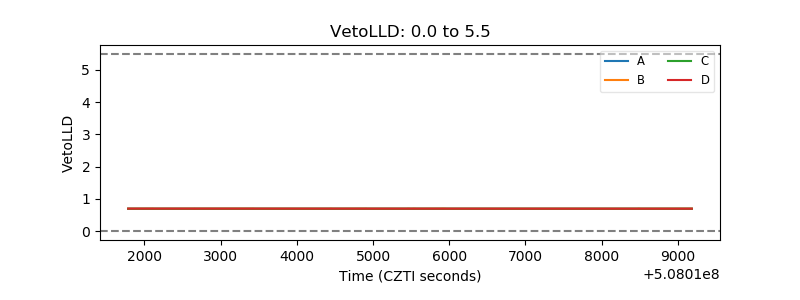 |
| Alpha Counter | 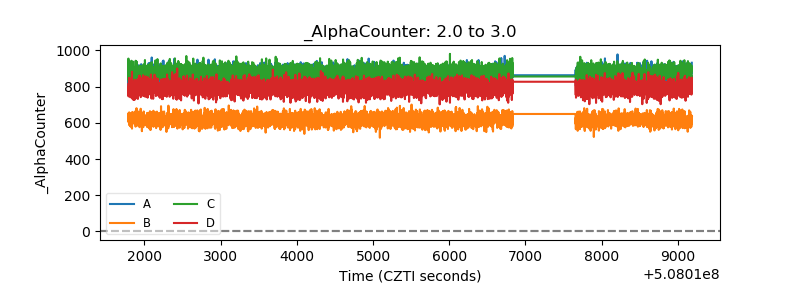 |
| _CPM_Rate | 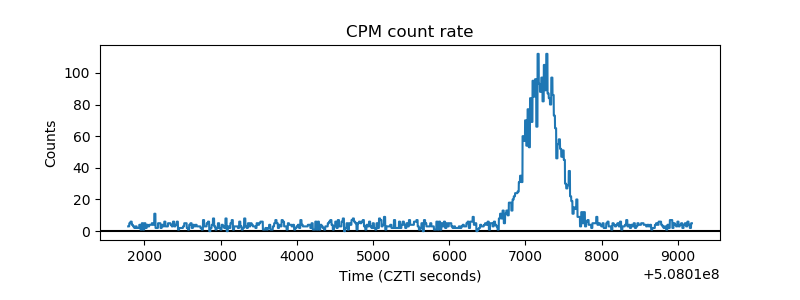 |
| CZT Counter | 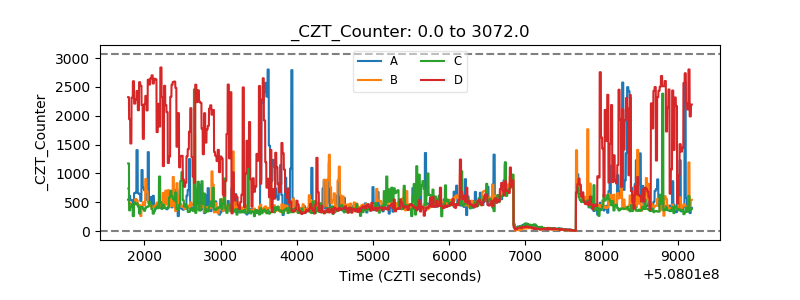 |
| +2.5 Volts monitor | 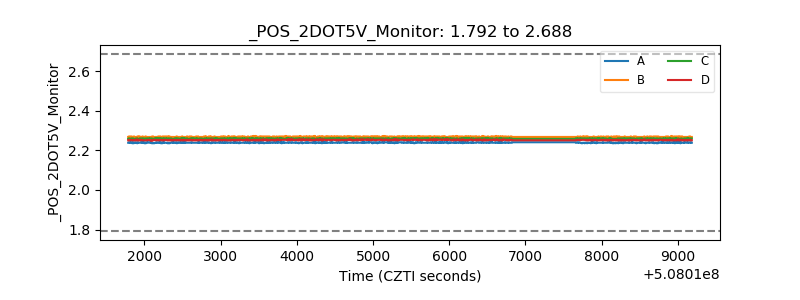 |
| +5 Volts monitor |  |
| _ROLL_ROT | 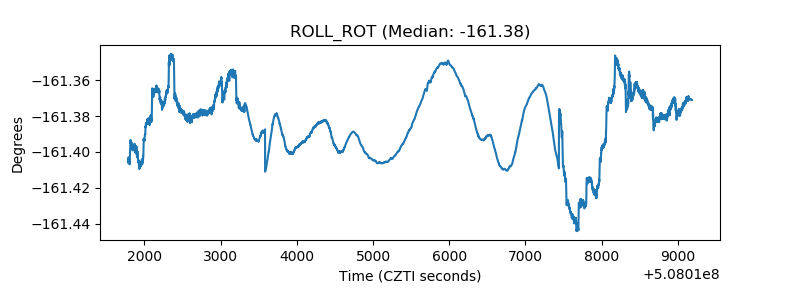 |
| _Roll_DEC | 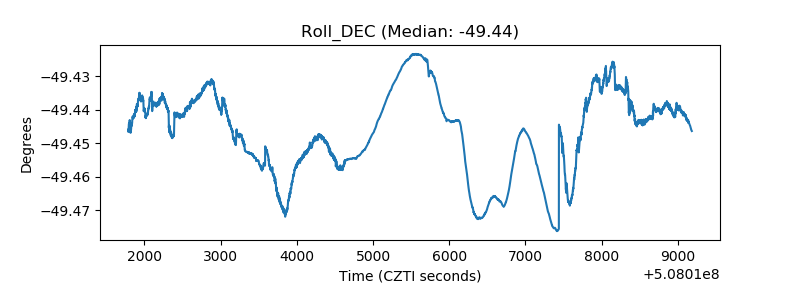 |
| _Roll_RA | 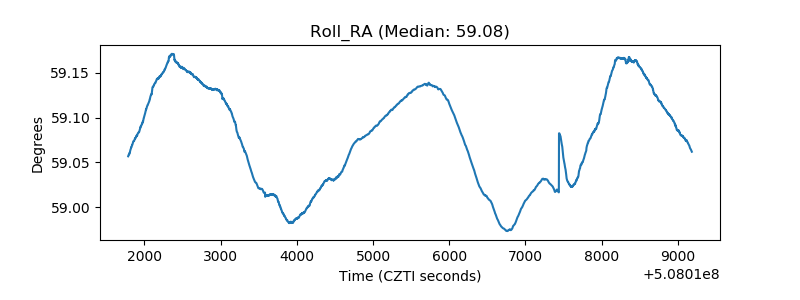 |
| Veto Counter | 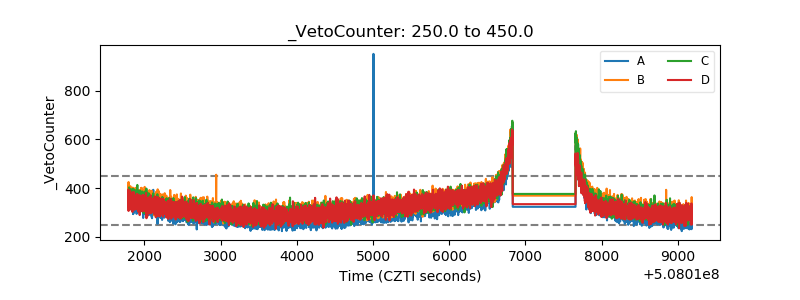 |