| Param | Original file | Final file |
|---|---|---|
| Filename | modeM0/AS1A14_083T03_9000006548_56046cztM0_level2.fits | modeM0/AS1A14_083T03_9000006548_56046cztM0_level2_quad_clean.evt |
| Size (bytes) | 559,909,440 | 110,067,840 |
| Size | 534.0 MB | 105.0 MB |
| Events in quadrant A | 6,491,282 | 683,018 |
| Events in quadrant B | 4,510,660 | 772,153 |
| Events in quadrant C | 4,382,999 | 683,480 |
| Events in quadrant D | 4,725,373 | 642,201 |
| Mode M0 | |||
|---|---|---|---|
| Quadrant | BADHDUFLAG | Total packets | Discarded packets |
| A | 0 | 24948 | 2 |
| B | 0 | 19307 | 2 |
| C | 0 | 19070 | 2 |
| D | 0 | 19844 | 2 |
| Mode SS | |||
|---|---|---|---|
| Quadrant | BADHDUFLAG | Total packets | Discarded packets |
| A | 0 | 162 | 0 |
| B | 0 | 164 | 0 |
| C | 0 | 164 | 0 |
| D | 0 | 164 | 0 |
| Mode M9 | |||
|---|---|---|---|
| Quadrant | BADHDUFLAG | Total packets | Discarded packets |
| A | 0 | 4 | 0 |
| B | 0 | 4 | 0 |
| C | 0 | 4 | 0 |
| D | 0 | 4 | 0 |
| Quadrant | Total seconds | Saturated seconds | Saturation percentage |
|---|---|---|---|
| A | 7932 | 667 | 8.408976% |
| B | 7933 | 217 | 2.735409% |
| C | 7933 | 183 | 2.306820% |
| D | 7933 | 117 | 1.474852% |
Noise dominated data is calculated using 1-second bins in cleaned event files. If a bin has >2000 counts, and if more than 50% of those come from <1% of pixels, then it is considered to be noise-dominated and hence unusable.
| Quadrant | # 1 sec bins | Bins with >0 counts | Bins with >2000 counts | High rate bins dominated by noise | Noise dominated (total time) | Noise dominated (detector-on time) | Marked lightcurve |
|---|---|---|---|---|---|---|---|
| A | 8362 | 7935 | 606 | 606 | 7.25% | 7.64% | 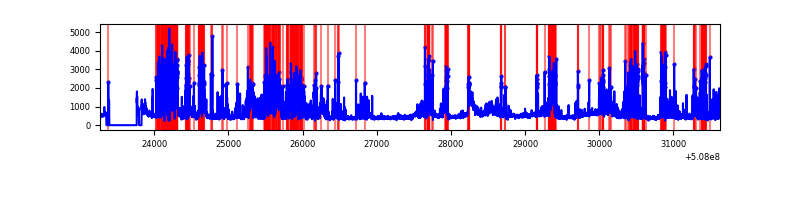 |
| B | 8363 | 7936 | 120 | 120 | 1.43% | 1.51% | 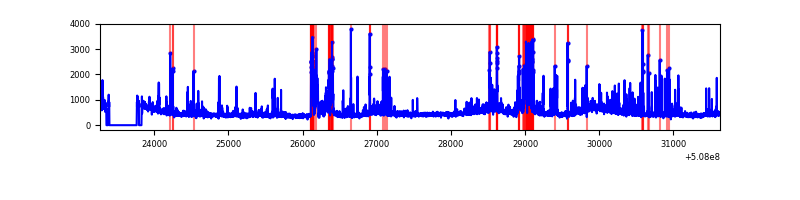 |
| C | 8363 | 7936 | 126 | 126 | 1.51% | 1.59% | 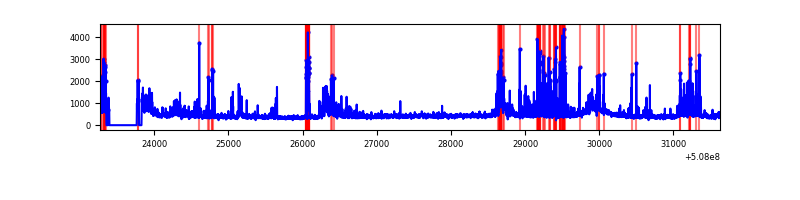 |
| D | 8363 | 7936 | 84 | 84 | 1.00% | 1.06% | 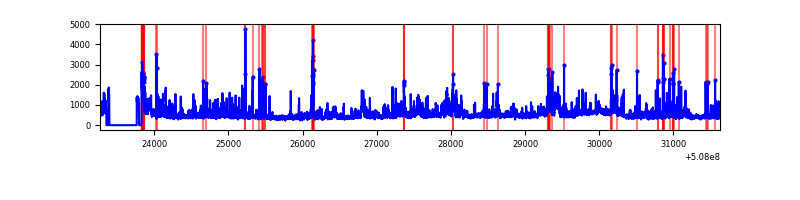 |
Top three noisy pixels from each quadrant. If the there are fewer than three noisy pixels in the level2.evt file, extra rows are filled as -1
| Pixel properties | Quadrant properties | ||||||
|---|---|---|---|---|---|---|---|
| Quadrant | DetID | PixID | Counts | Sigma | Mean | Median | Sigma |
| A | 12 | 115 | 949734 | 4716.1 | 808 | 786 | 201.2 |
| A | 7 | 64 | 937476 | 4655.18 | 808 | 786 | 201.2 |
| A | 4 | 249 | 889609 | 4417.29 | 808 | 786 | 201.2 |
| B | 5 | 185 | 527186 | 2978.52 | 826 | 797 | 176.7 |
| B | 10 | 247 | 146455 | 824.19 | 826 | 797 | 176.7 |
| B | 0 | 213 | 138044 | 776.6 | 826 | 797 | 176.7 |
| C | 15 | 199 | 482778 | 2219.67 | 800 | 793 | 217.1 |
| C | 13 | 3 | 329969 | 1515.95 | 800 | 793 | 217.1 |
| C | 15 | 147 | 110508 | 505.27 | 800 | 793 | 217.1 |
| D | 11 | 129 | 411882 | 1834.57 | 794 | 759 | 224.1 |
| D | 8 | 160 | 201676 | 896.56 | 794 | 759 | 224.1 |
| D | 6 | 239 | 177625 | 789.23 | 794 | 759 | 224.1 |
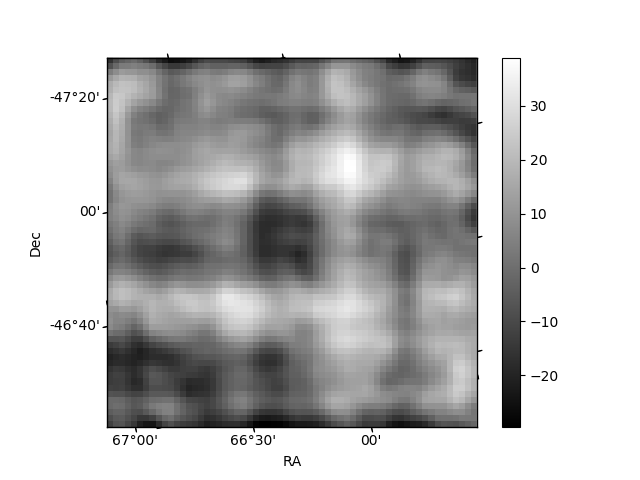
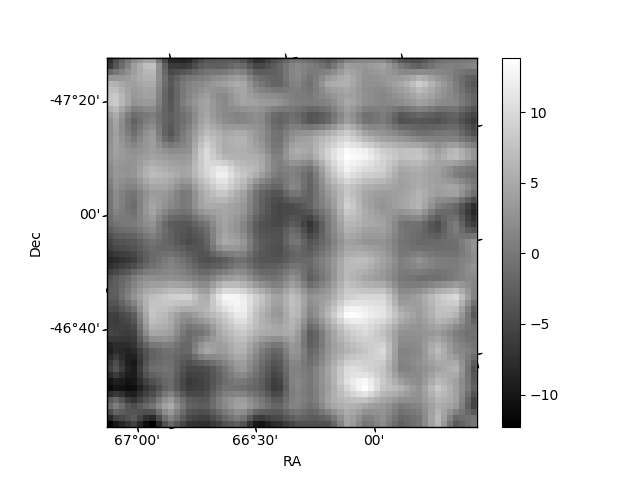
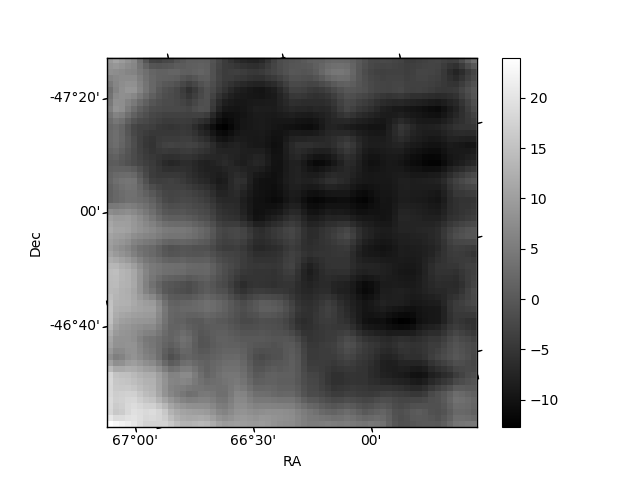
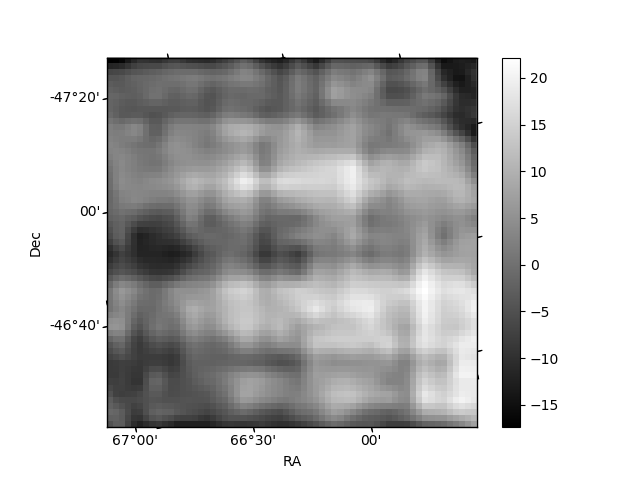
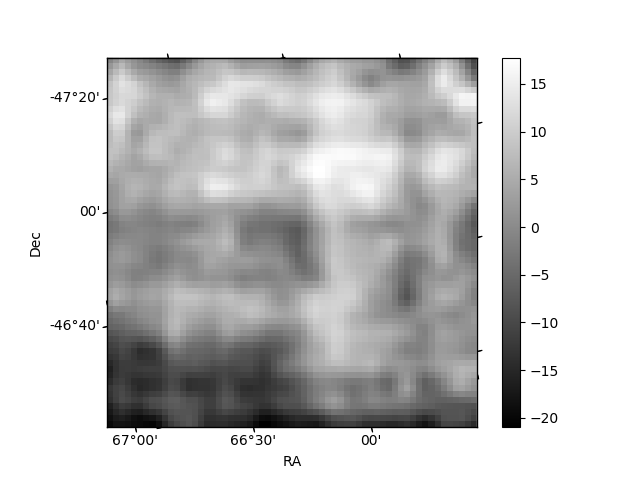
Histogram calculated using DETX and DETY for each event in the final _common_clean file
| Quadrant A | 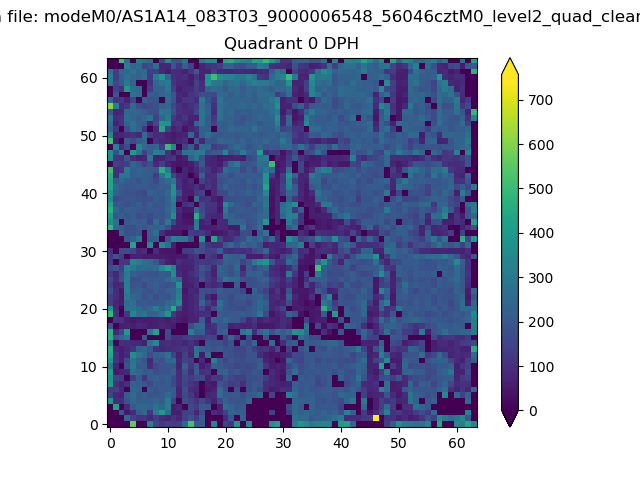 |
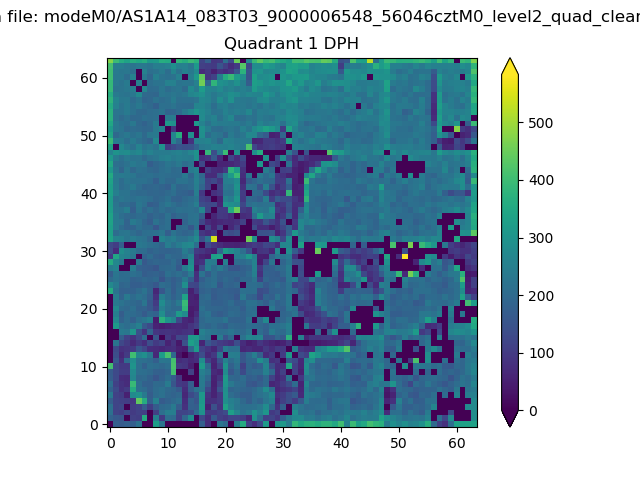 |
Quadrant B |
|---|---|---|---|
| Quadrant D | 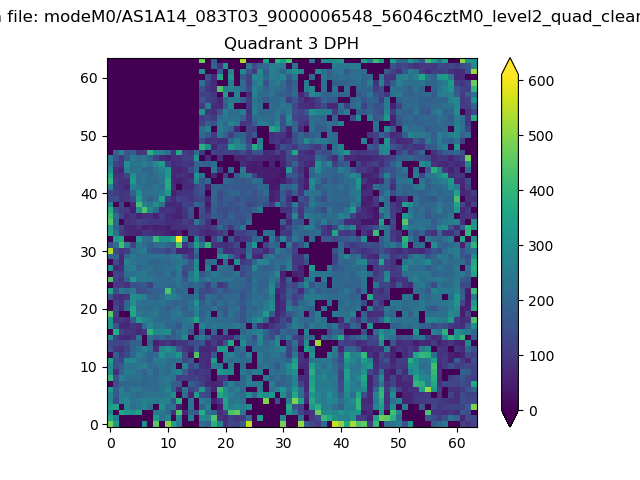 |
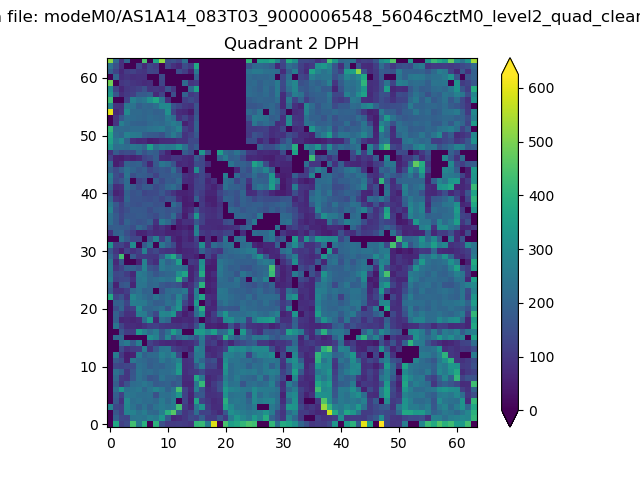 |
Quadrant C |
| Plot type | Count rate plots | Images |
|---|---|---|
| Comparison with Poisson distribution Blue bars denote a histogram of data divided into 1 sec bins. Red curve is a Poisson curve with rate = median count rate of data. |
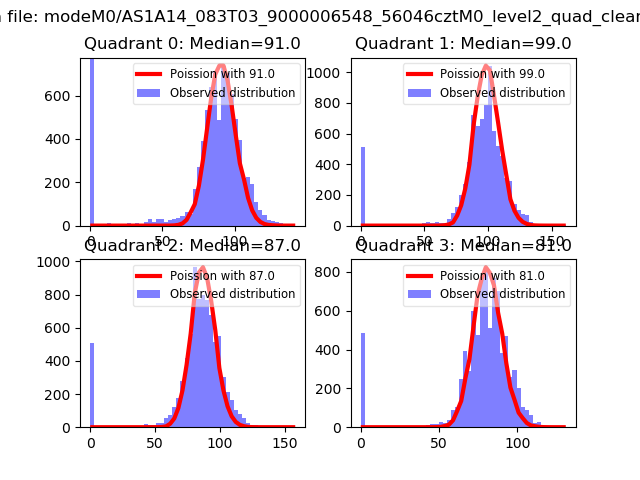 |
 |
| Quadrant-wise count rates Data is divided into 100 sec bins |
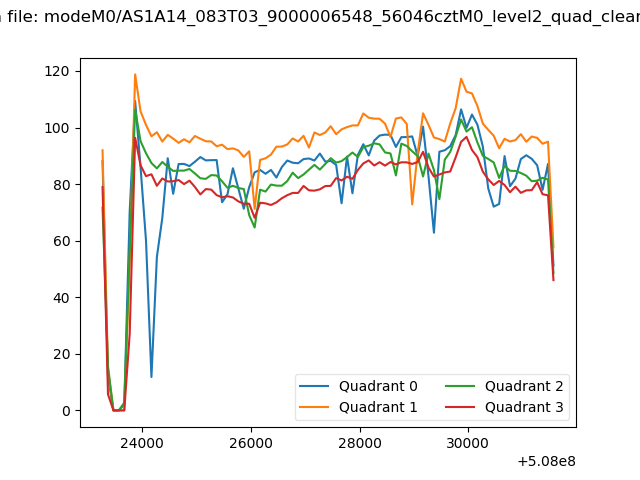 |
|
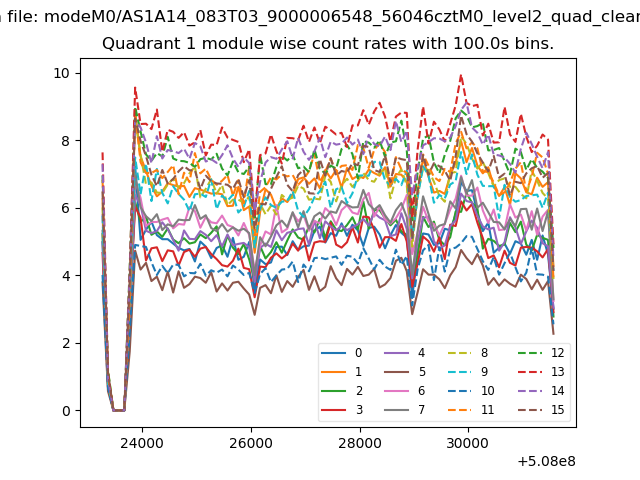
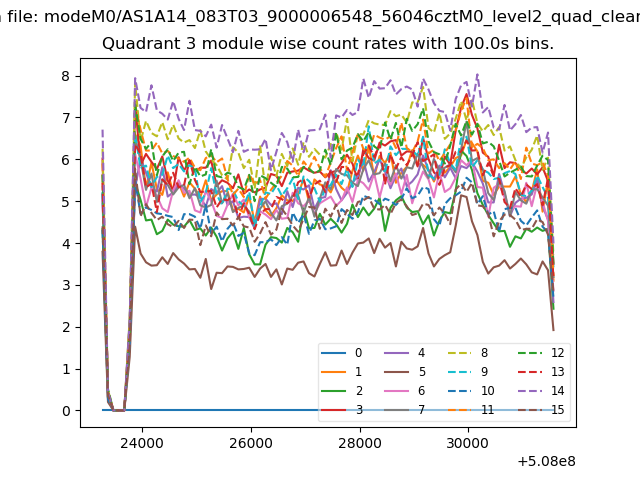
| Module-wise count rates for Quadrant A Data is divided into 100 sec bins |
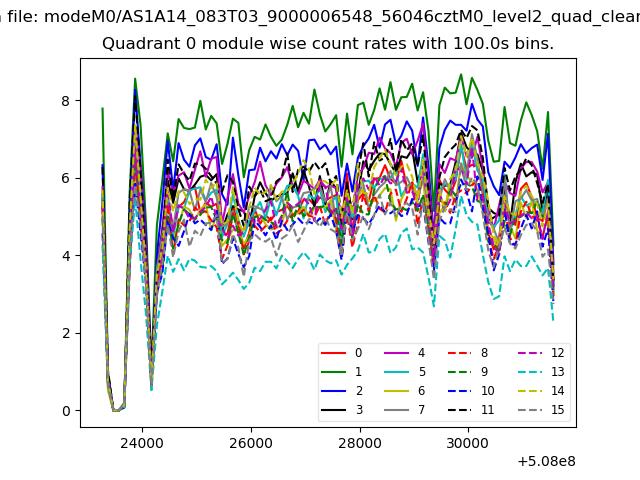 |
 |
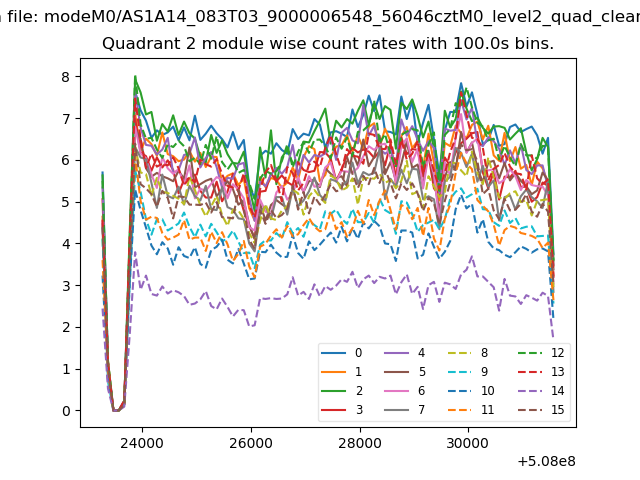
| Module-wise count rates for Quadrant B Data is divided into 100 sec bins |
 |
 |
| Module-wise count rates for Quadrant C Data is divided into 100 sec bins |
 |
 |
| Module-wise count rates for Quadrant D Data is divided into 100 sec bins |
 |
 |
| Parameter | Plot |
|---|---|
| CZT HV Monitor | 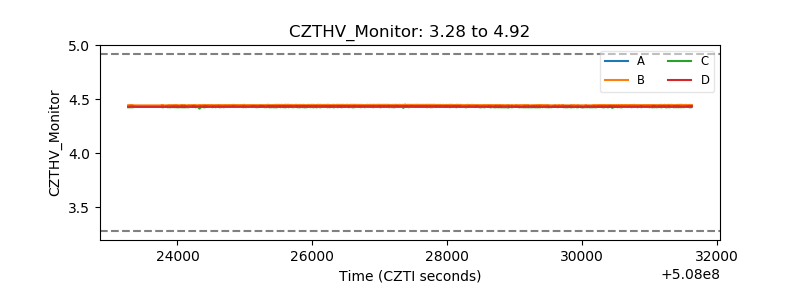 |
| D_VDD | 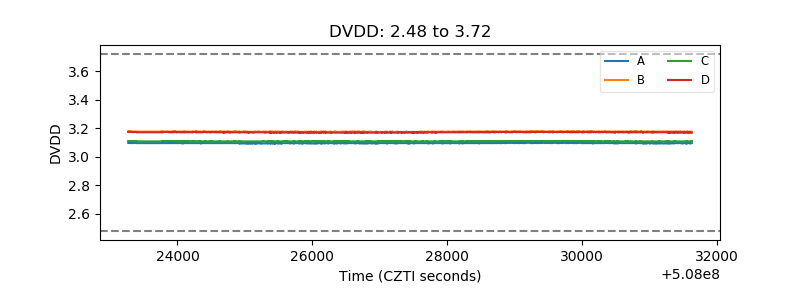 |
| Temperature 1 | 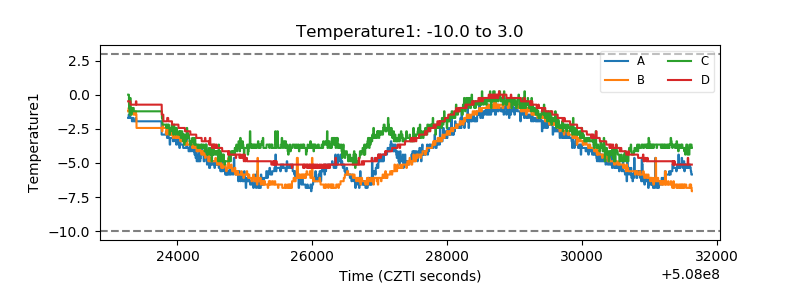 |
| Veto HV Monitor | 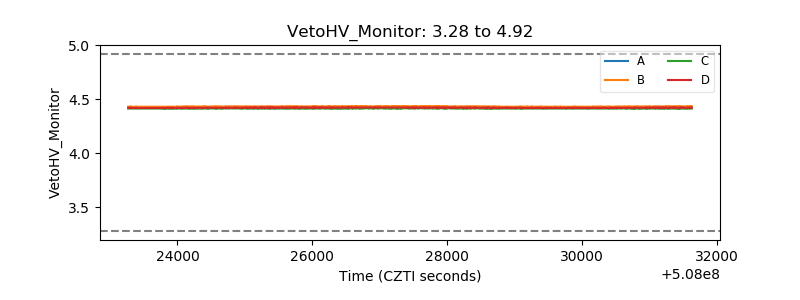 |
| Veto LLD | 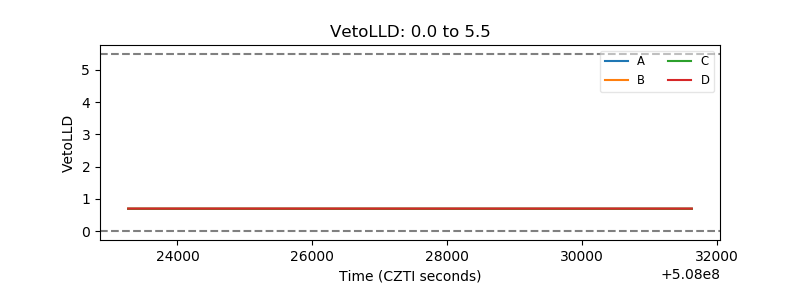 |
| Alpha Counter | 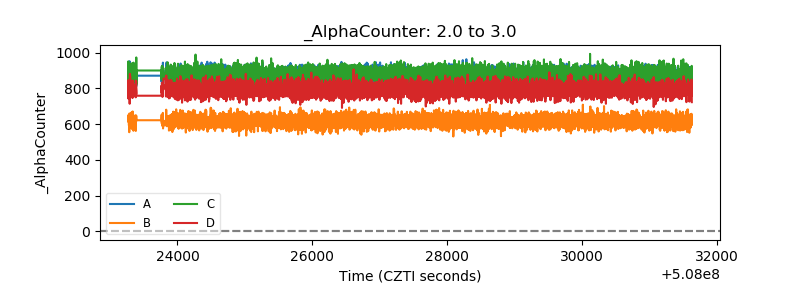 |
| _CPM_Rate | 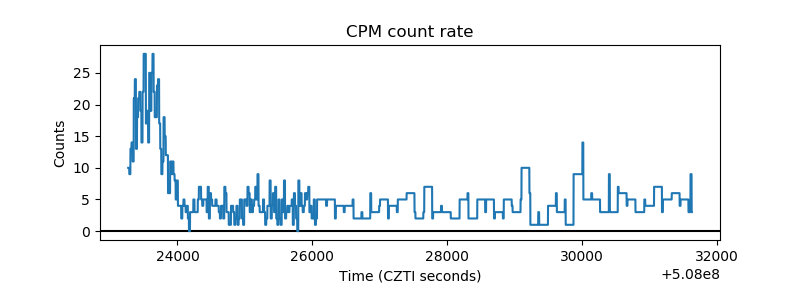 |
| CZT Counter | 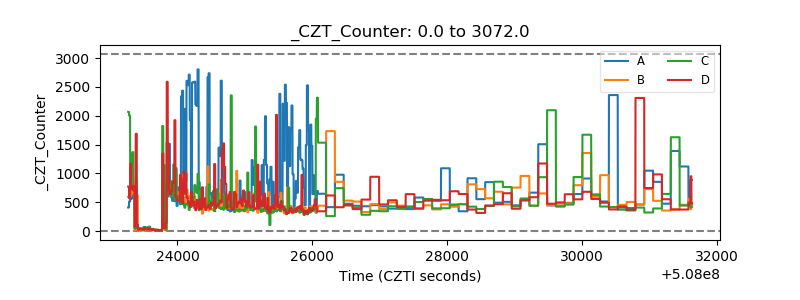 |
| +2.5 Volts monitor | 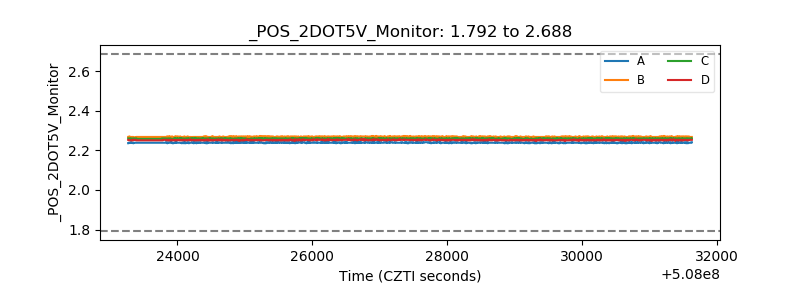 |
| +5 Volts monitor |  |
| _ROLL_ROT | 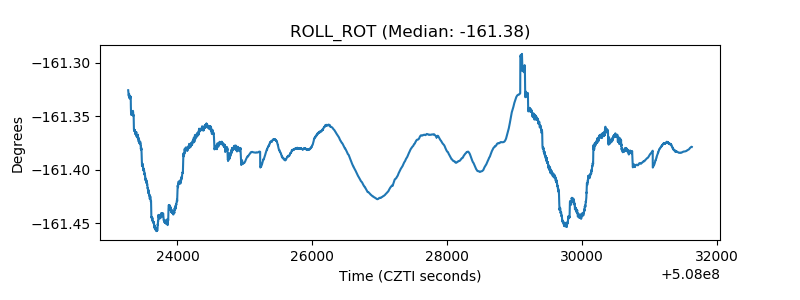 |
| _Roll_DEC | 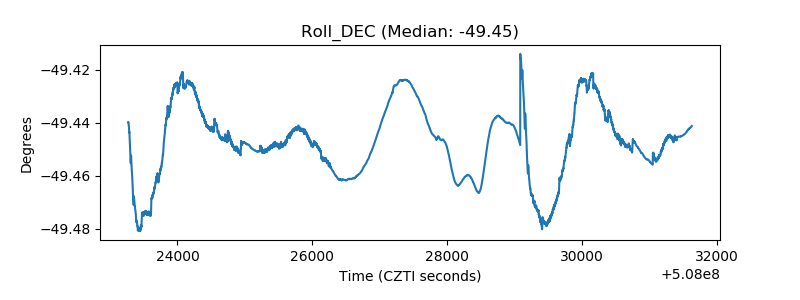 |
| _Roll_RA | 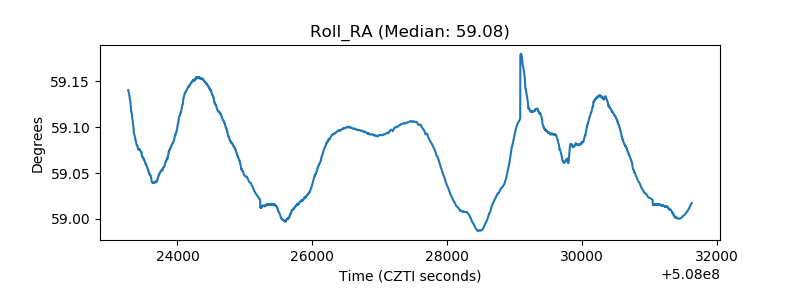 |
| Veto Counter | 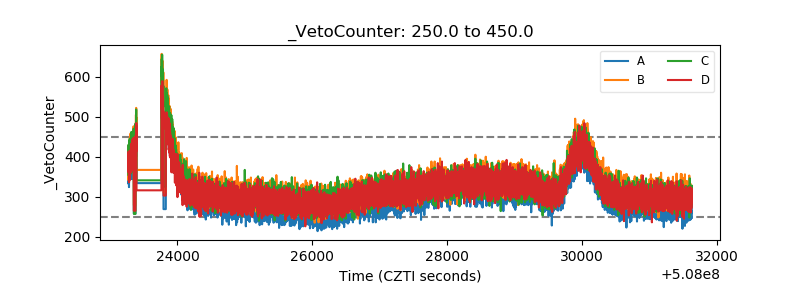 |