| Param | Original file | Final file |
|---|---|---|
| Filename | modeM0/AS1A14_083T03_9000006548_56054cztM0_level2.fits | modeM0/AS1A14_083T03_9000006548_56054cztM0_level2_quad_clean.evt |
| Size (bytes) | 605,545,920 | 73,537,920 |
| Size | 577.5 MB | 70.1 MB |
| Events in quadrant A | 11,110,341 | 231,793 |
| Events in quadrant B | 3,201,463 | 589,406 |
| Events in quadrant C | 3,190,436 | 523,213 |
| Events in quadrant D | 4,459,468 | 474,228 |
| Mode M0 | |||
|---|---|---|---|
| Quadrant | BADHDUFLAG | Total packets | Discarded packets |
| A | 0 | 36986 | 1 |
| B | 0 | 13622 | 1 |
| C | 0 | 13819 | 1 |
| D | 0 | 17237 | 1 |
| Mode SS | |||
|---|---|---|---|
| Quadrant | BADHDUFLAG | Total packets | Discarded packets |
| A | 0 | 120 | 0 |
| B | 0 | 120 | 0 |
| C | 0 | 120 | 0 |
| D | 0 | 120 | 0 |
| Mode M9 | |||
|---|---|---|---|
| Quadrant | BADHDUFLAG | Total packets | Discarded packets |
| A | 0 | 10 | 0 |
| B | 0 | 10 | 0 |
| C | 0 | 10 | 0 |
| D | 0 | 10 | 0 |
| Quadrant | Total seconds | Saturated seconds | Saturation percentage |
|---|---|---|---|
| A | 5833 | 3718 | 63.740785% |
| B | 5833 | 149 | 2.554432% |
| C | 5833 | 150 | 2.571576% |
| D | 5833 | 405 | 6.943254% |
Noise dominated data is calculated using 1-second bins in cleaned event files. If a bin has >2000 counts, and if more than 50% of those come from <1% of pixels, then it is considered to be noise-dominated and hence unusable.
| Quadrant | # 1 sec bins | Bins with >0 counts | Bins with >2000 counts | High rate bins dominated by noise | Noise dominated (total time) | Noise dominated (detector-on time) | Marked lightcurve |
|---|---|---|---|---|---|---|---|
| A | 6844 | 5833 | 3277 | 3277 | 47.88% | 56.18% | 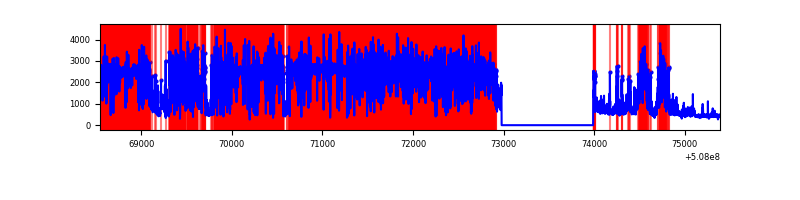 |
| B | 6844 | 5833 | 72 | 72 | 1.05% | 1.23% | 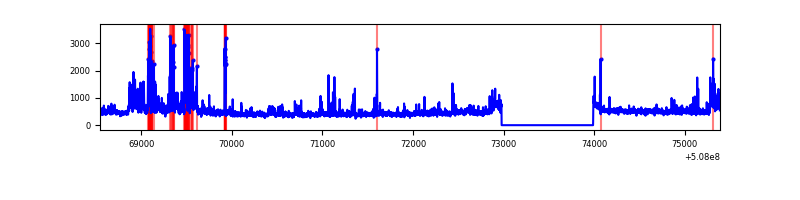 |
| C | 6844 | 5834 | 101 | 101 | 1.48% | 1.73% | 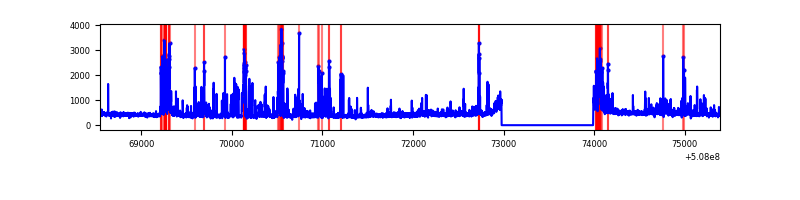 |
| D | 6844 | 5833 | 362 | 362 | 5.29% | 6.21% | 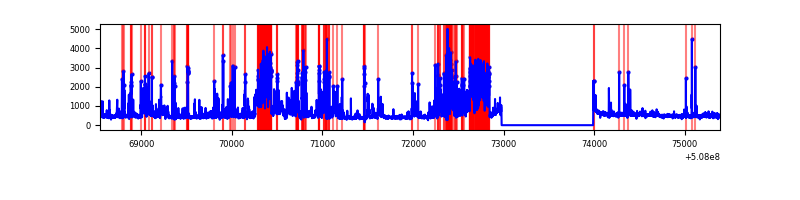 |
Top three noisy pixels from each quadrant. If the there are fewer than three noisy pixels in the level2.evt file, extra rows are filled as -1
| Pixel properties | Quadrant properties | ||||||
|---|---|---|---|---|---|---|---|
| Quadrant | DetID | PixID | Counts | Sigma | Mean | Median | Sigma |
| A | 4 | 249 | 8382661 | 78609.18 | 425 | 412 | 106.6 |
| A | 12 | 115 | 992901 | 9307.62 | 425 | 412 | 106.6 |
| A | 0 | 8 | 32297 | 299.02 | 425 | 412 | 106.6 |
| B | 5 | 185 | 361413 | 2778.34 | 610 | 589 | 129.9 |
| B | 0 | 213 | 145804 | 1118.15 | 610 | 589 | 129.9 |
| B | 5 | 172 | 121271 | 929.25 | 610 | 589 | 129.9 |
| C | 13 | 3 | 325924 | 2000.21 | 593 | 586 | 162.7 |
| C | 15 | 147 | 255136 | 1565.0 | 593 | 586 | 162.7 |
| C | 15 | 230 | 149973 | 918.45 | 593 | 586 | 162.7 |
| D | 6 | 42 | 985457 | 5988.77 | 584 | 559 | 164.5 |
| D | 11 | 129 | 385181 | 2338.73 | 584 | 559 | 164.5 |
| D | 14 | 52 | 193290 | 1171.92 | 584 | 559 | 164.5 |
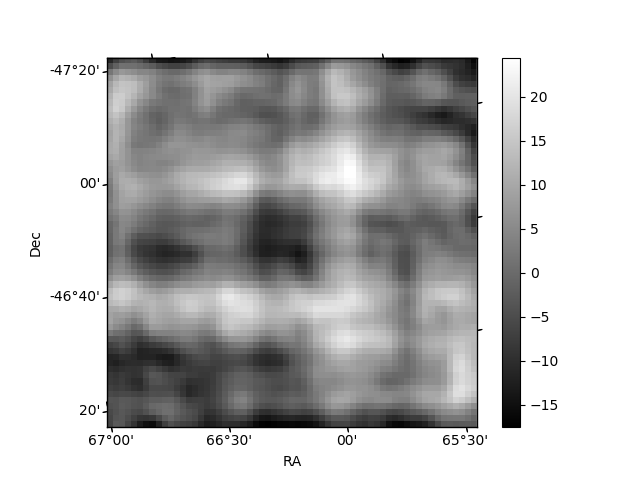
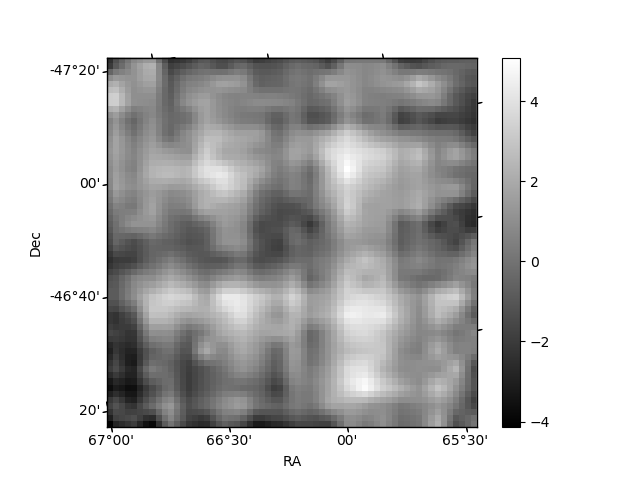
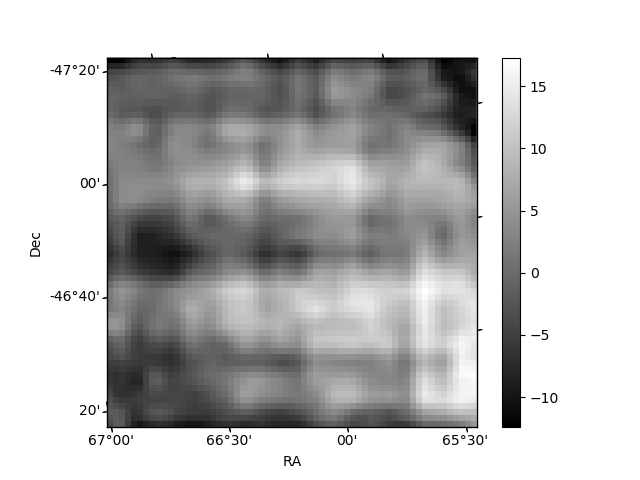
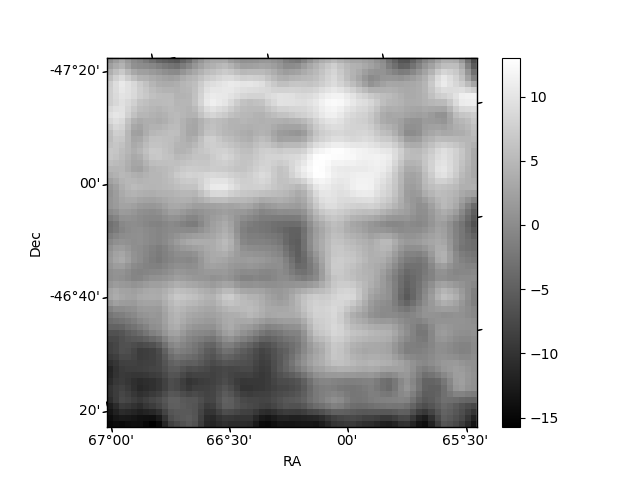
Histogram calculated using DETX and DETY for each event in the final _common_clean file
| Quadrant A | 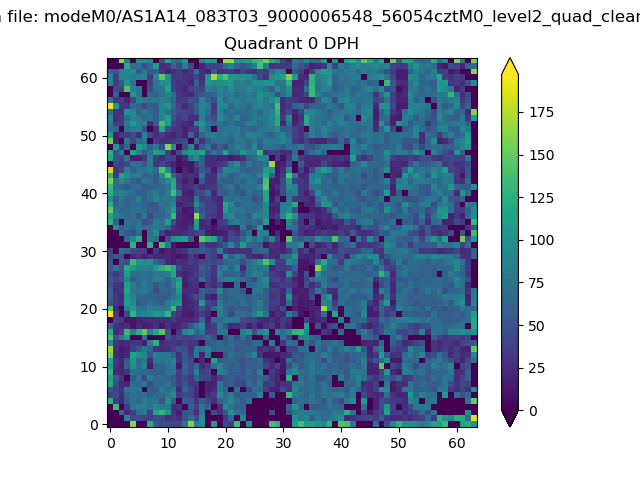 |
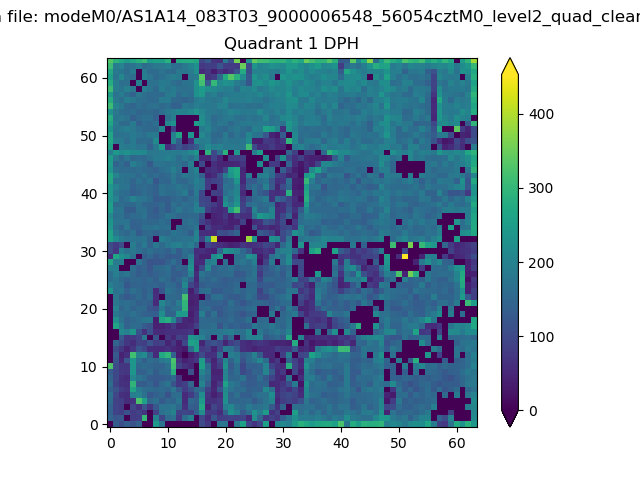 |
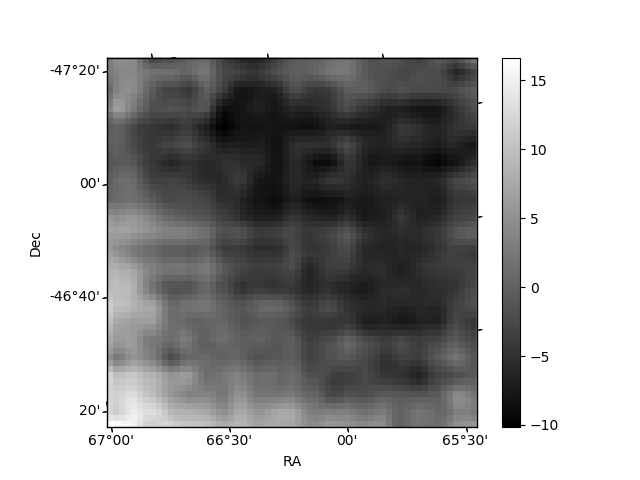
Quadrant B |
|---|---|---|---|
| Quadrant D | 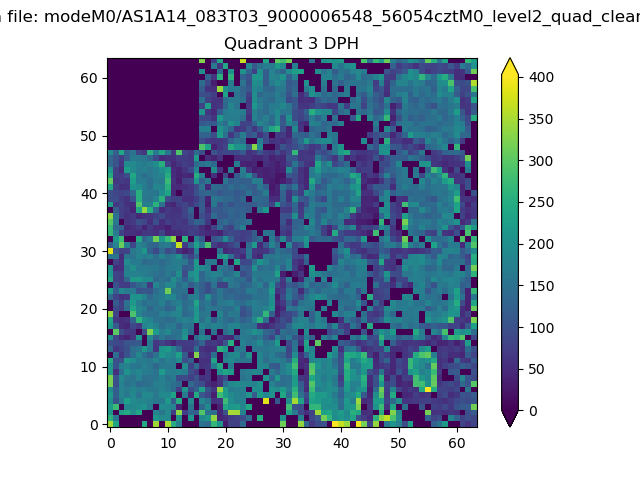 |
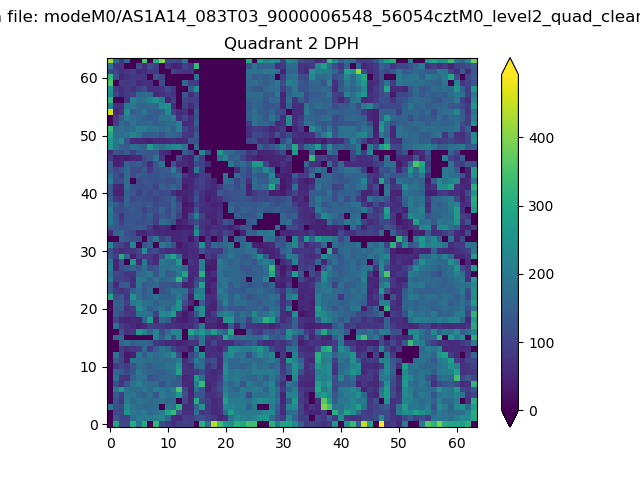 |
Quadrant C |
| Plot type | Count rate plots | Images |
|---|---|---|
| Comparison with Poisson distribution Blue bars denote a histogram of data divided into 1 sec bins. Red curve is a Poisson curve with rate = median count rate of data. |
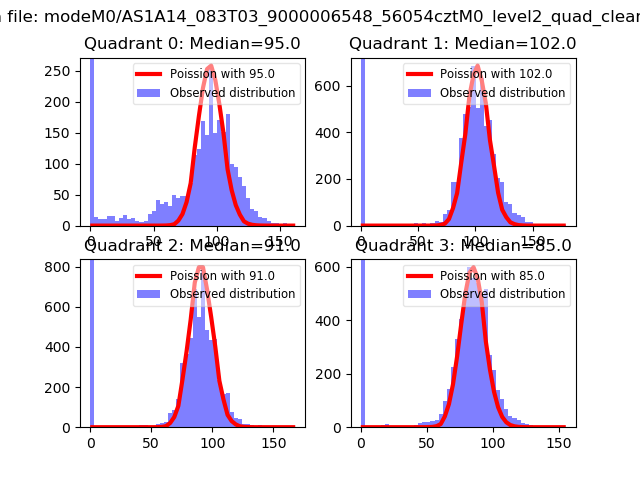 |
 |
| Quadrant-wise count rates Data is divided into 100 sec bins |
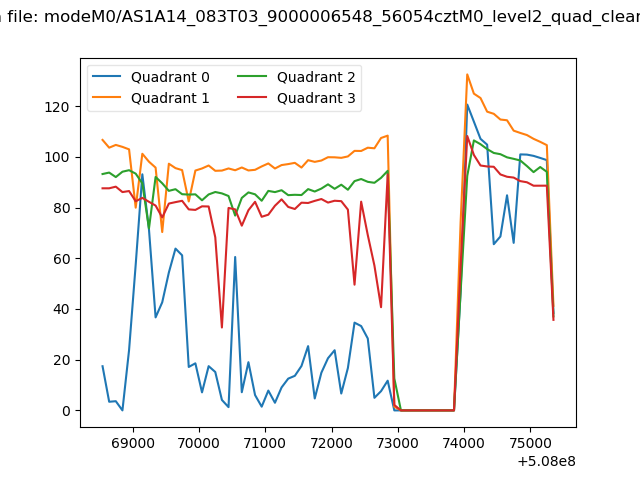 |
|
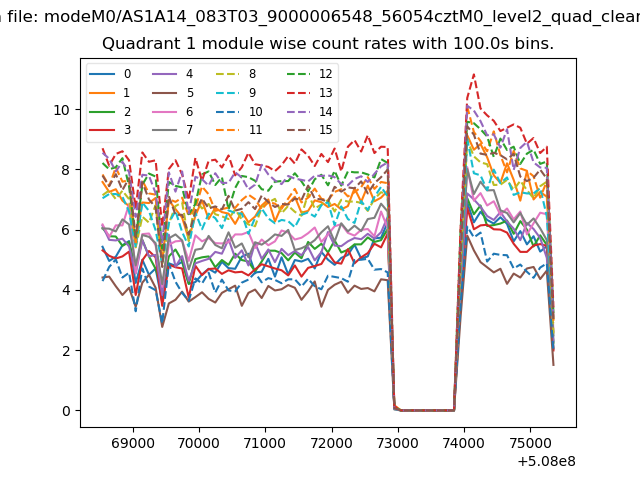
| Module-wise count rates for Quadrant A Data is divided into 100 sec bins |
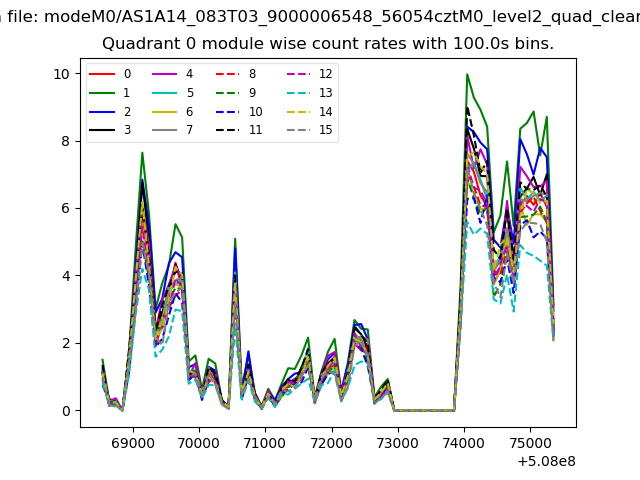 |
 |
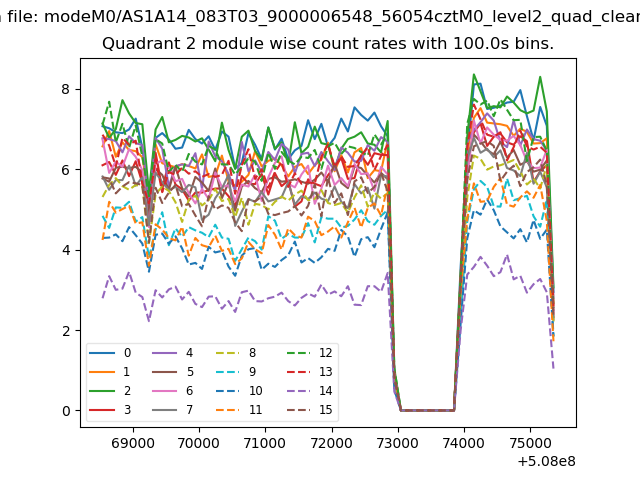
| Module-wise count rates for Quadrant B Data is divided into 100 sec bins |
 |
 |
| Module-wise count rates for Quadrant C Data is divided into 100 sec bins |
 |
 |
| Module-wise count rates for Quadrant D Data is divided into 100 sec bins |
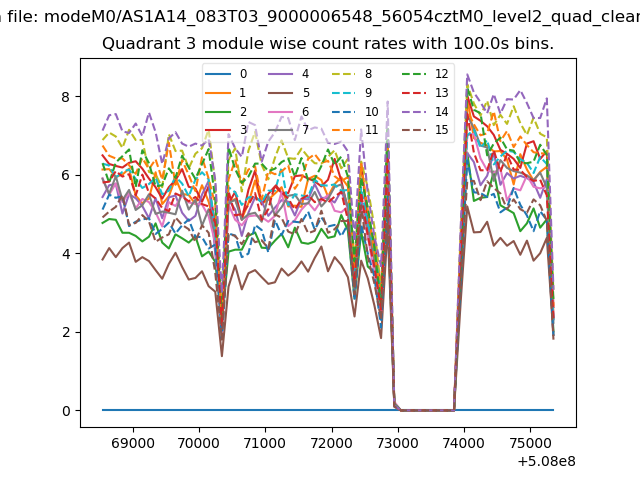 |
 |
| Parameter | Plot |
|---|---|
| CZT HV Monitor | 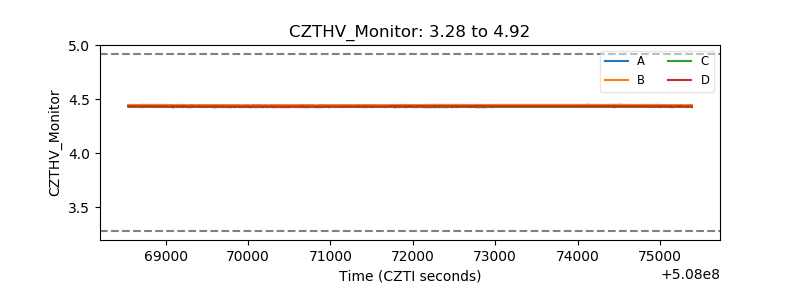 |
| D_VDD | 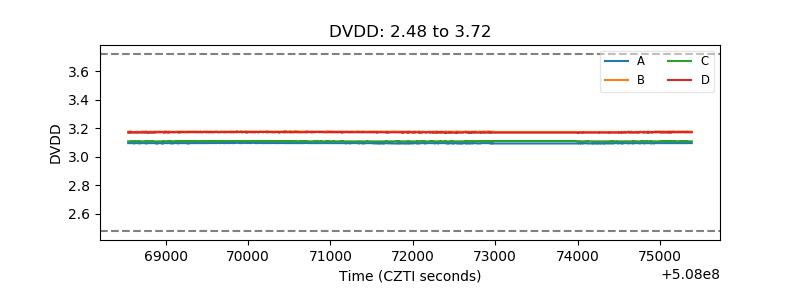 |
| Temperature 1 | 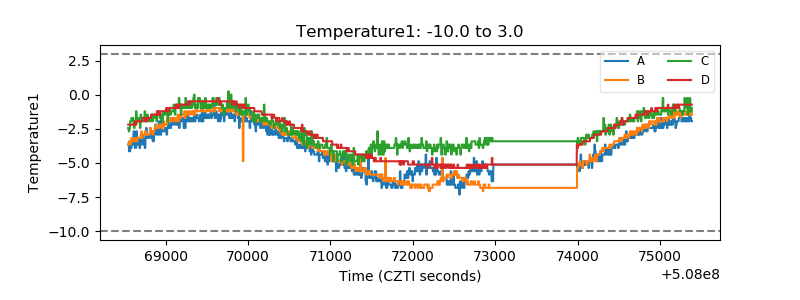 |
| Veto HV Monitor | 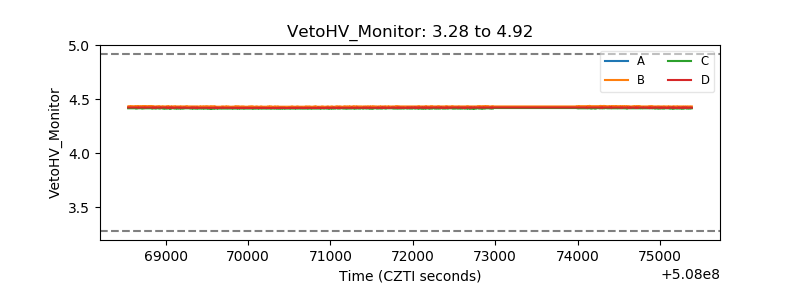 |
| Veto LLD | 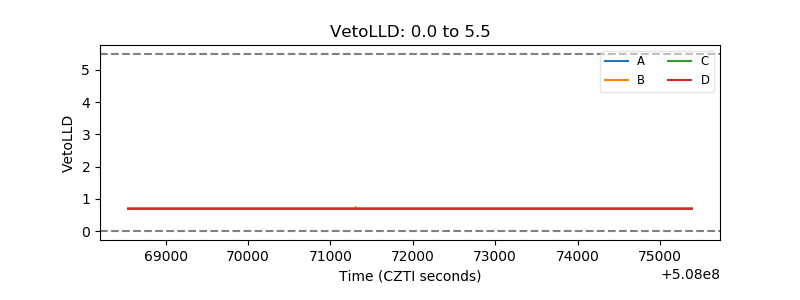 |
| Alpha Counter | 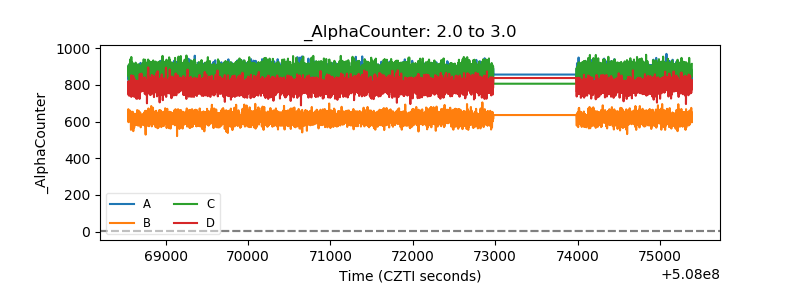 |
| _CPM_Rate | 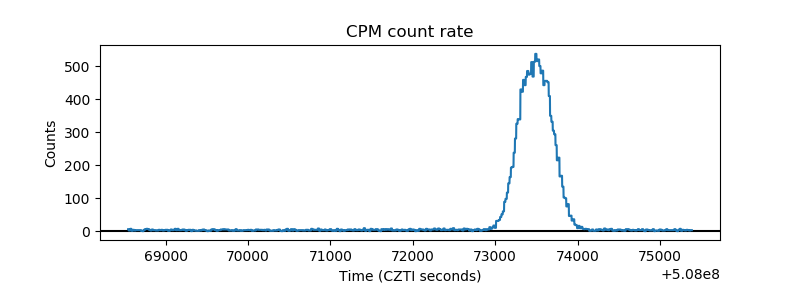 |
| CZT Counter | 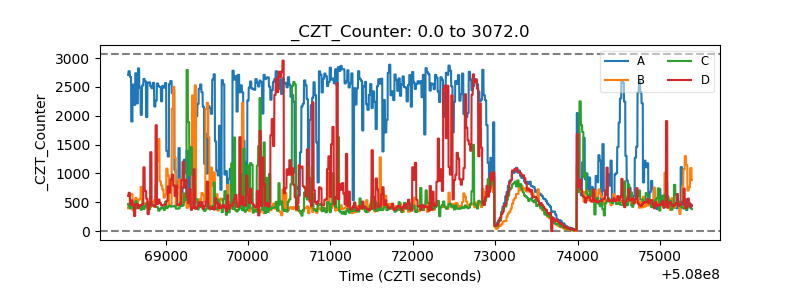 |
| +2.5 Volts monitor |  |
| +5 Volts monitor | 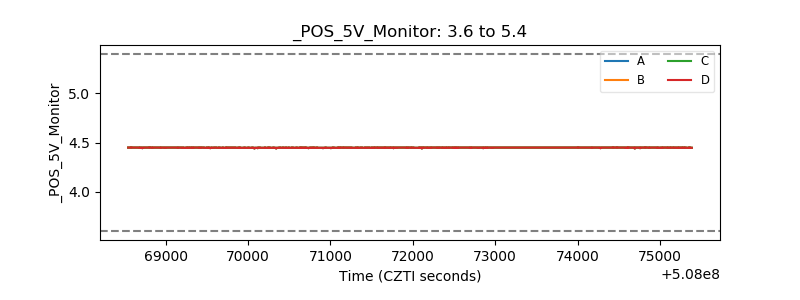 |
| _ROLL_ROT | 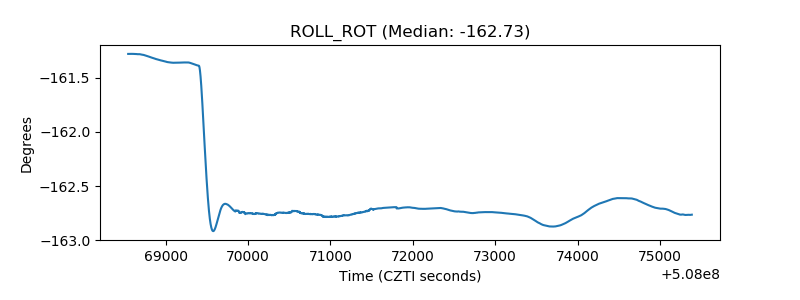 |
| _Roll_DEC | 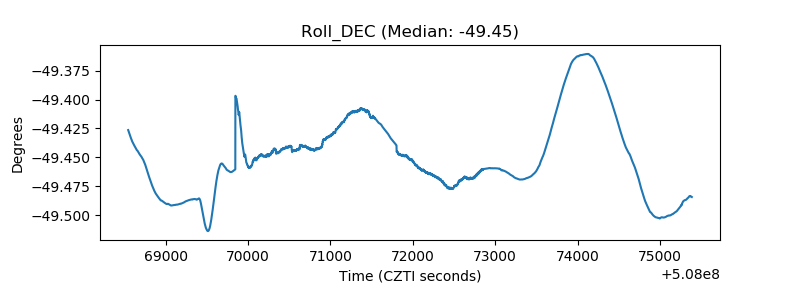 |
| _Roll_RA | 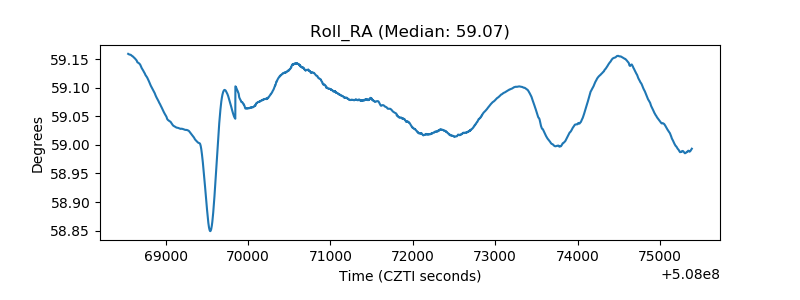 |
| Veto Counter | 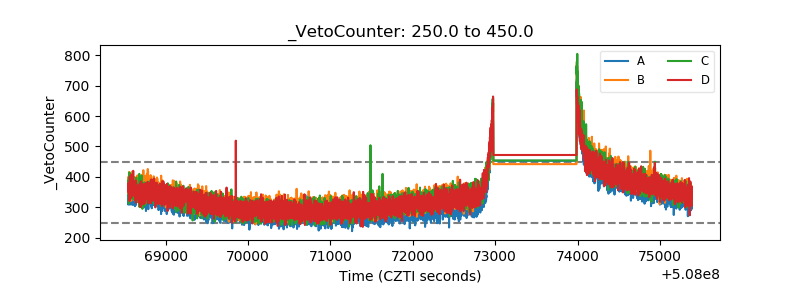 |