| Param | Original file | Final file |
|---|---|---|
| Filename | modeM0/AS1A14_083T03_9000006548_56057cztM0_level2.fits | modeM0/AS1A14_083T03_9000006548_56057cztM0_level2_quad_clean.evt |
| Size (bytes) | 498,075,840 | 93,683,520 |
| Size | 475.0 MB | 89.3 MB |
| Events in quadrant A | 5,920,355 | 588,064 |
| Events in quadrant B | 3,517,323 | 680,329 |
| Events in quadrant C | 3,170,117 | 604,816 |
| Events in quadrant D | 5,322,055 | 508,454 |
| Mode M0 | |||
|---|---|---|---|
| Quadrant | BADHDUFLAG | Total packets | Discarded packets |
| A | 0 | 22205 | 2 |
| B | 0 | 15095 | 2 |
| C | 0 | 14349 | 2 |
| D | 0 | 20357 | 2 |
| Mode SS | |||
|---|---|---|---|
| Quadrant | BADHDUFLAG | Total packets | Discarded packets |
| A | 0 | 130 | 0 |
| B | 0 | 130 | 0 |
| C | 0 | 130 | 0 |
| D | 0 | 130 | 0 |
| Mode M9 | |||
|---|---|---|---|
| Quadrant | BADHDUFLAG | Total packets | Discarded packets |
| A | 0 | 12 | 0 |
| B | 0 | 12 | 0 |
| C | 0 | 12 | 0 |
| D | 0 | 12 | 0 |
| Quadrant | Total seconds | Saturated seconds | Saturation percentage |
|---|---|---|---|
| A | 6529 | 639 | 9.787104% |
| B | 6529 | 141 | 2.159596% |
| C | 6529 | 37 | 0.566702% |
| D | 6529 | 715 | 10.951141% |
Noise dominated data is calculated using 1-second bins in cleaned event files. If a bin has >2000 counts, and if more than 50% of those come from <1% of pixels, then it is considered to be noise-dominated and hence unusable.
| Quadrant | # 1 sec bins | Bins with >0 counts | Bins with >2000 counts | High rate bins dominated by noise | Noise dominated (total time) | Noise dominated (detector-on time) | Marked lightcurve |
|---|---|---|---|---|---|---|---|
| A | 7659 | 6530 | 655 | 655 | 8.55% | 10.03% | 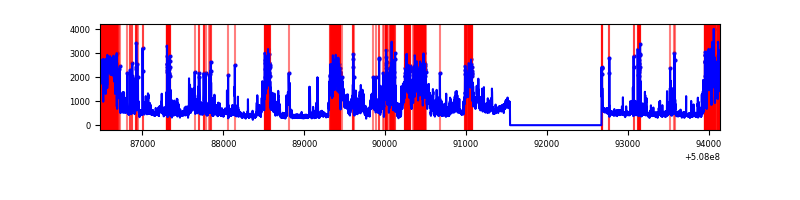 |
| B | 7659 | 6530 | 58 | 58 | 0.76% | 0.89% | 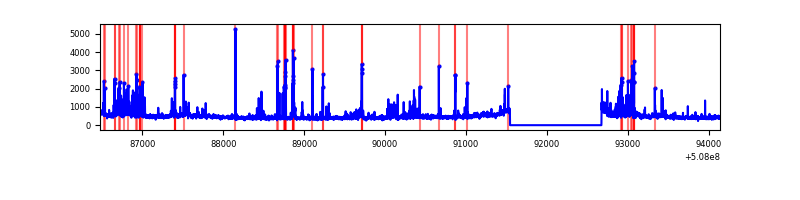 |
| C | 7659 | 6530 | 34 | 34 | 0.44% | 0.52% | 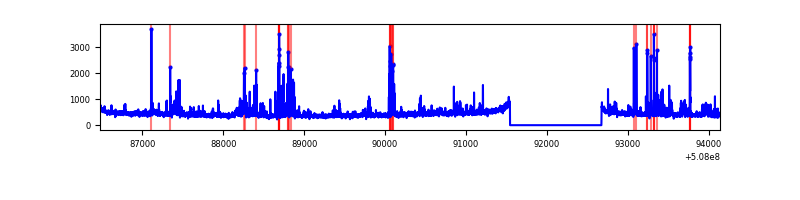 |
| D | 7659 | 6530 | 704 | 704 | 9.19% | 10.78% | 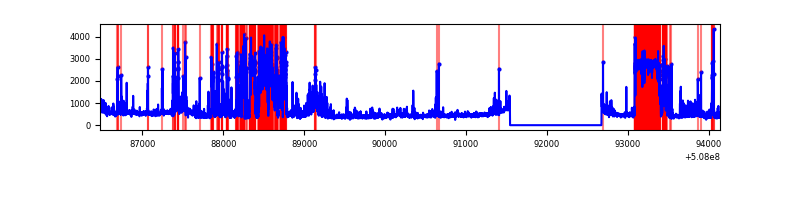 |
Top three noisy pixels from each quadrant. If the there are fewer than three noisy pixels in the level2.evt file, extra rows are filled as -1
| Pixel properties | Quadrant properties | ||||||
|---|---|---|---|---|---|---|---|
| Quadrant | DetID | PixID | Counts | Sigma | Mean | Median | Sigma |
| A | 12 | 115 | 2454181 | 14592.39 | 677 | 660 | 168.1 |
| A | 15 | 32 | 250014 | 1483.04 | 677 | 660 | 168.1 |
| A | 0 | 8 | 240384 | 1425.77 | 677 | 660 | 168.1 |
| B | 5 | 185 | 216286 | 1465.89 | 690 | 666 | 147.1 |
| B | 2 | 249 | 127748 | 863.97 | 690 | 666 | 147.1 |
| B | 10 | 247 | 90918 | 613.58 | 690 | 666 | 147.1 |
| C | 13 | 3 | 333686 | 1802.98 | 670 | 664 | 184.7 |
| C | 15 | 147 | 82200 | 441.44 | 670 | 664 | 184.7 |
| C | 12 | 252 | 75439 | 404.83 | 670 | 664 | 184.7 |
| D | 2 | 16 | 1087585 | 6033.93 | 633 | 604 | 180.1 |
| D | 2 | 249 | 939330 | 5210.95 | 633 | 604 | 180.1 |
| D | 11 | 129 | 491166 | 2723.16 | 633 | 604 | 180.1 |
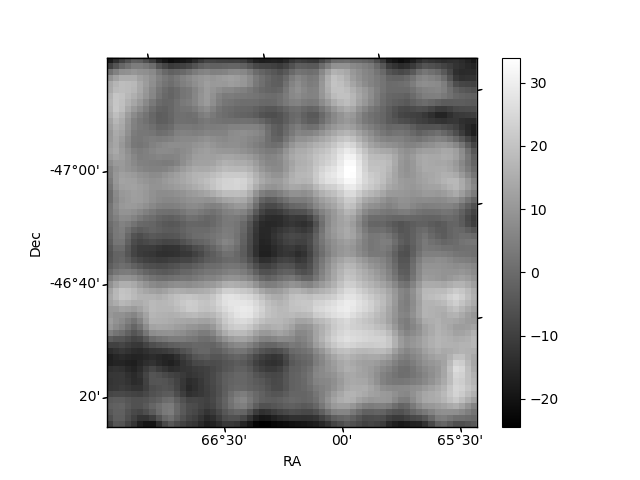
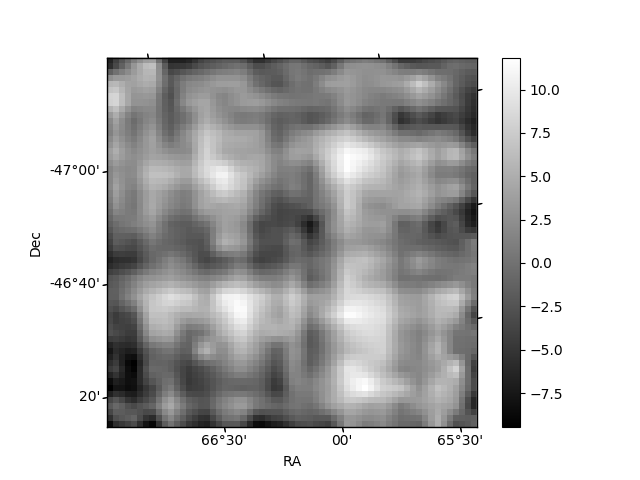
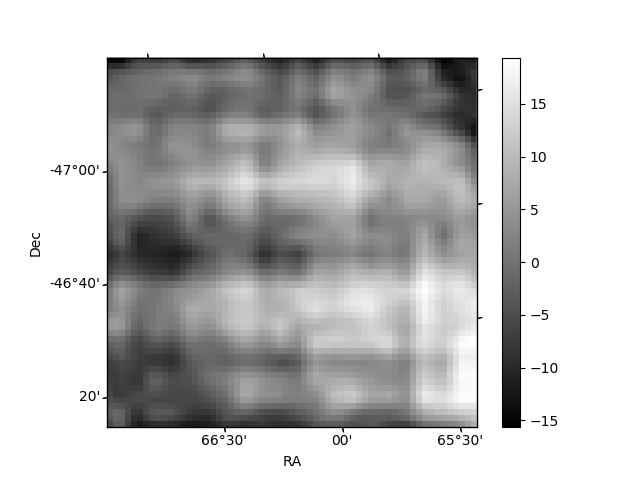
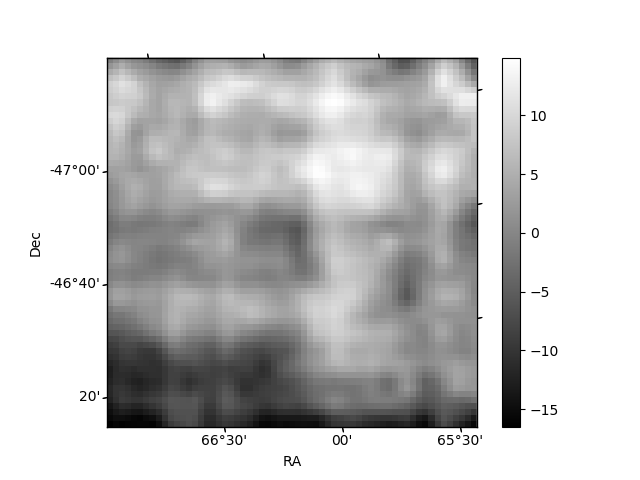
Histogram calculated using DETX and DETY for each event in the final _common_clean file
| Quadrant A | 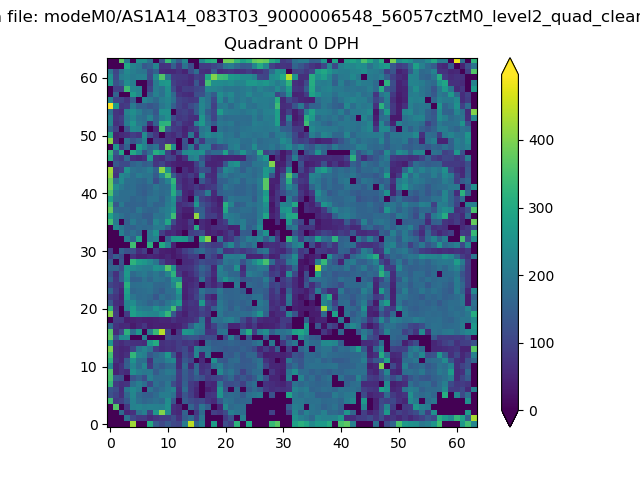 |
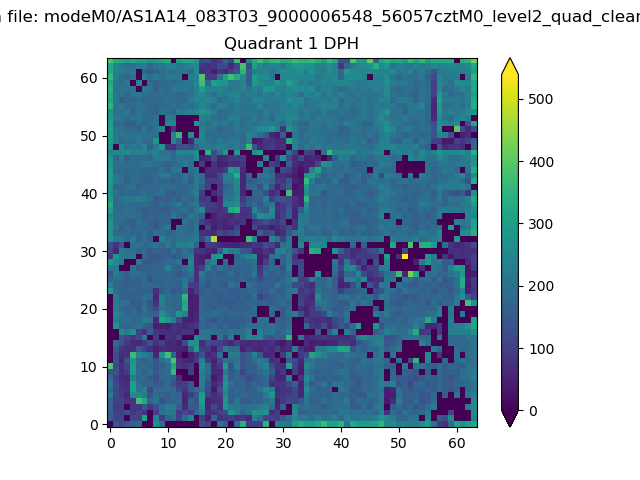 |
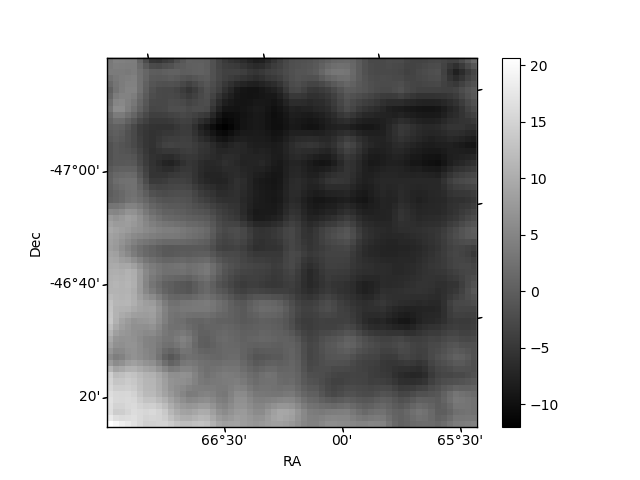
Quadrant B |
|---|---|---|---|
| Quadrant D | 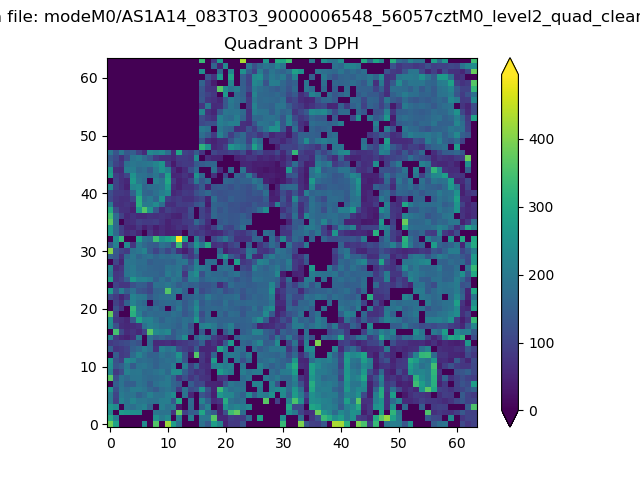 |
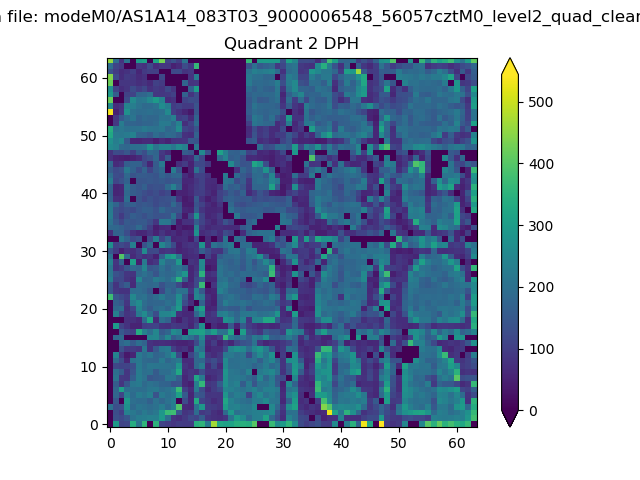 |
Quadrant C |
| Plot type | Count rate plots | Images |
|---|---|---|
| Comparison with Poisson distribution Blue bars denote a histogram of data divided into 1 sec bins. Red curve is a Poisson curve with rate = median count rate of data. |
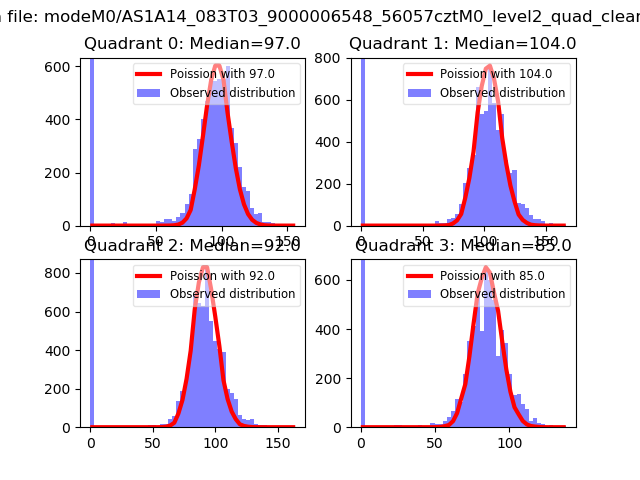 |
 |
| Quadrant-wise count rates Data is divided into 100 sec bins |
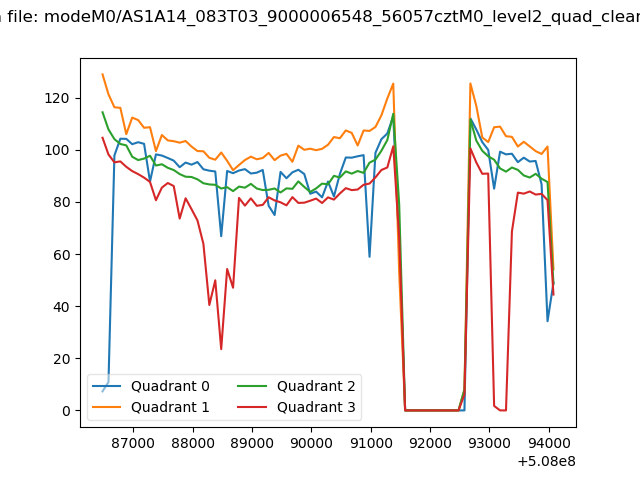 |
|
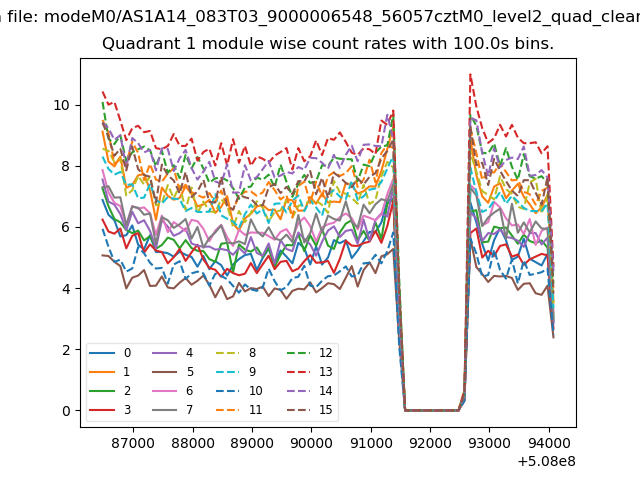
| Module-wise count rates for Quadrant A Data is divided into 100 sec bins |
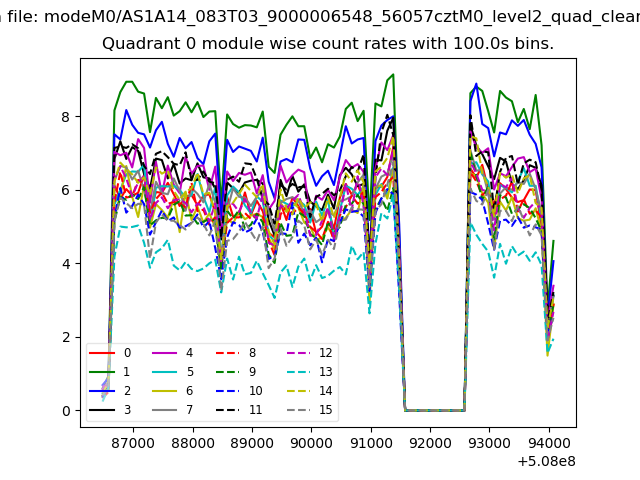 |
 |
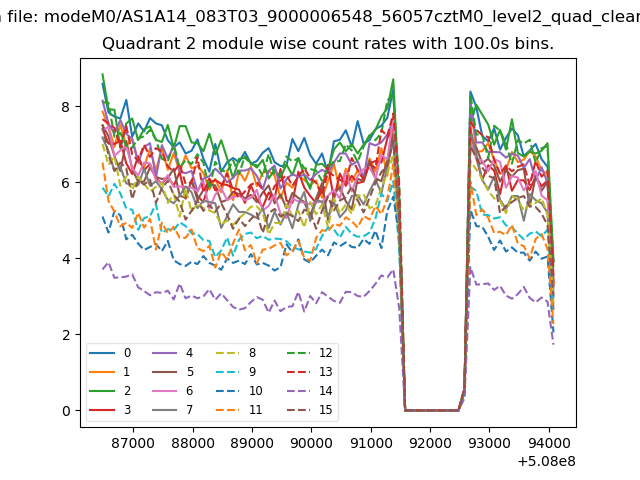
| Module-wise count rates for Quadrant B Data is divided into 100 sec bins |
 |
 |
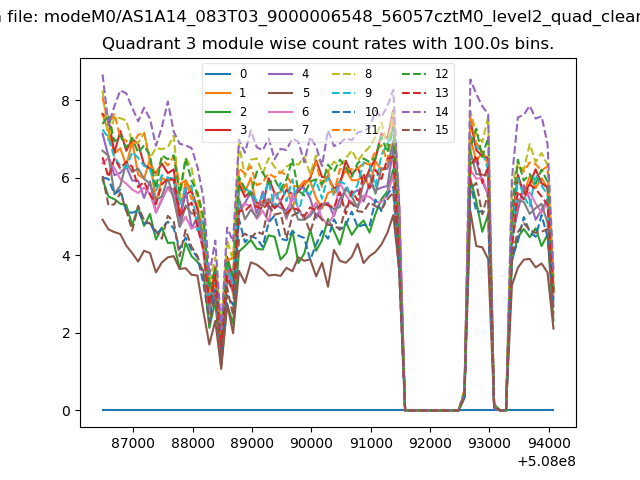
| Module-wise count rates for Quadrant C Data is divided into 100 sec bins |
 |
 |
| Module-wise count rates for Quadrant D Data is divided into 100 sec bins |
 |
 |
| Parameter | Plot |
|---|---|
| CZT HV Monitor | 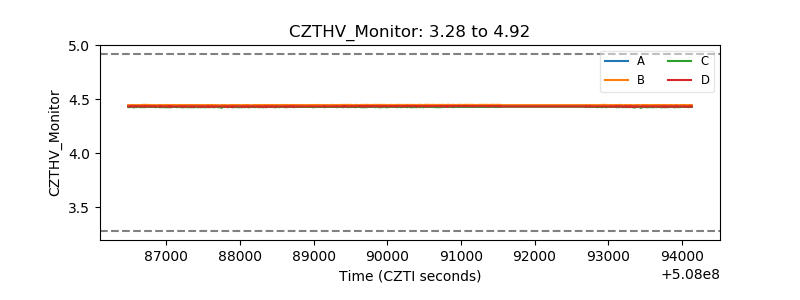 |
| D_VDD | 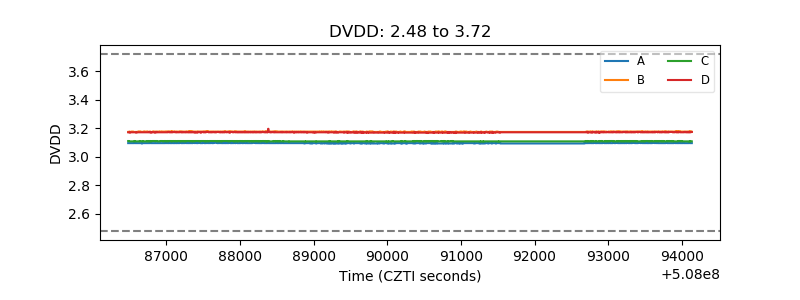 |
| Temperature 1 | 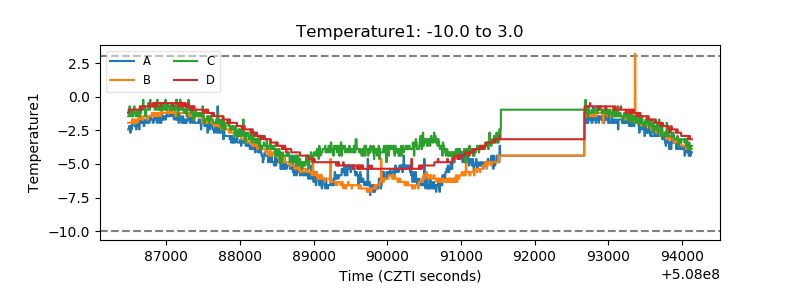 |
| Veto HV Monitor | 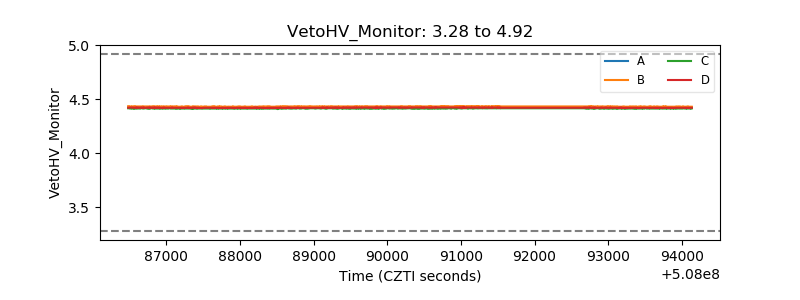 |
| Veto LLD | 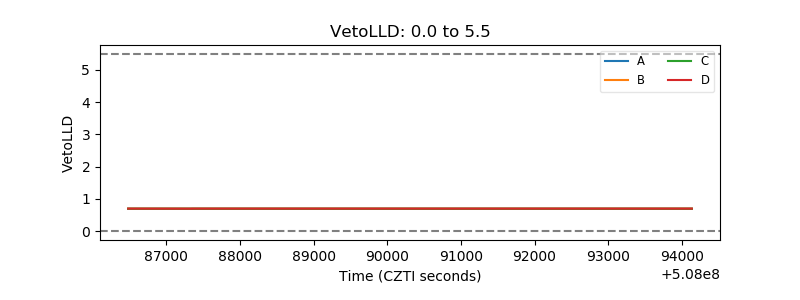 |
| Alpha Counter | 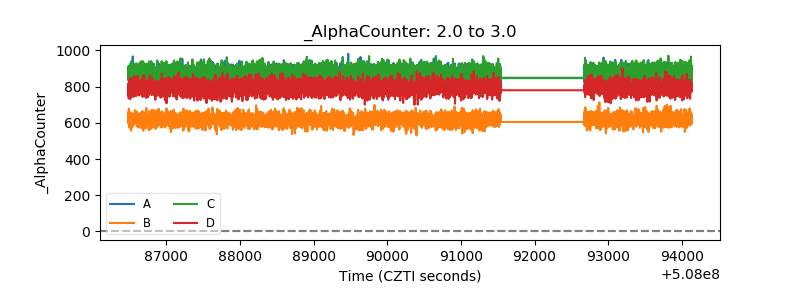 |
| _CPM_Rate | 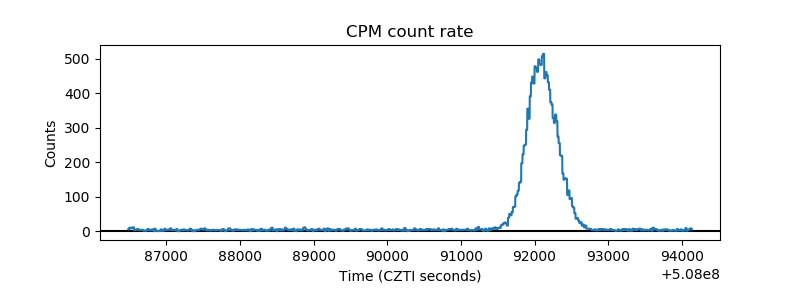 |
| CZT Counter | 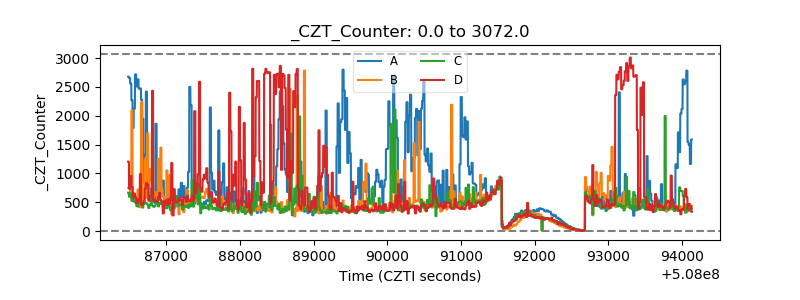 |
| +2.5 Volts monitor | 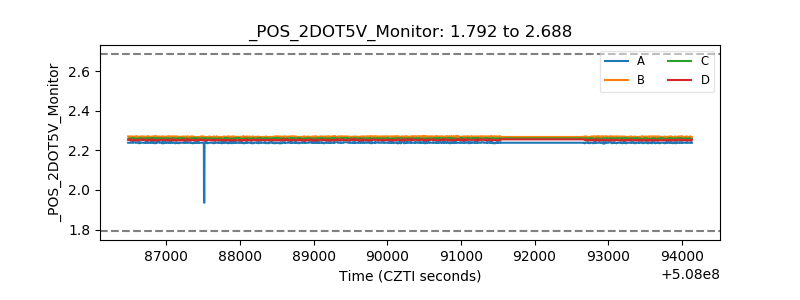 |
| +5 Volts monitor | 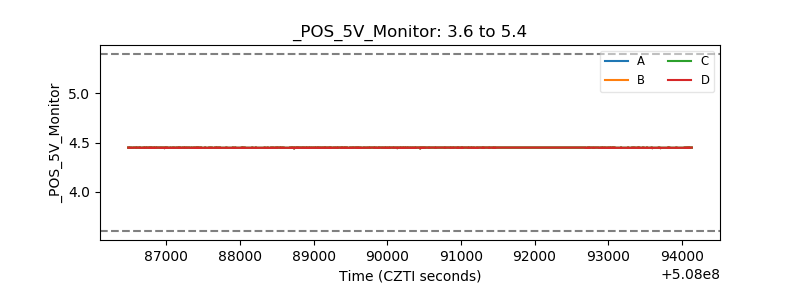 |
| _ROLL_ROT | 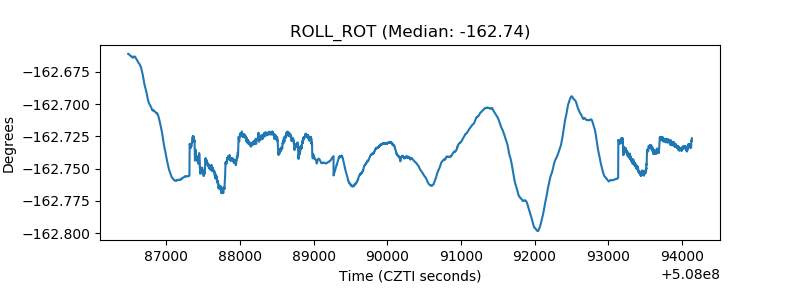 |
| _Roll_DEC | 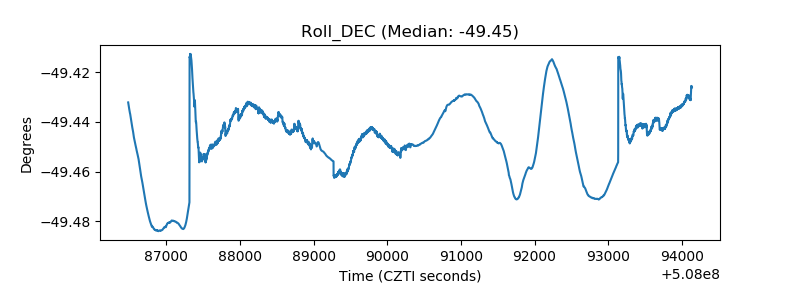 |
| _Roll_RA | 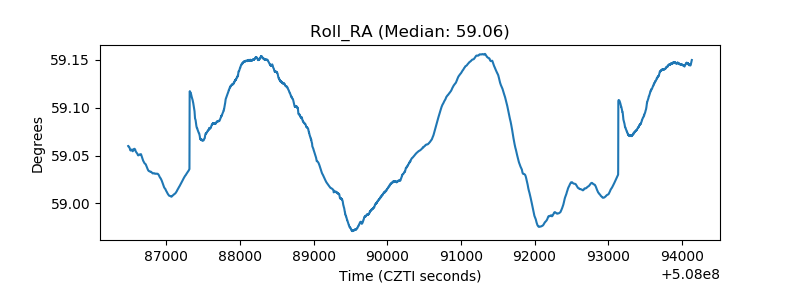 |
| Veto Counter | 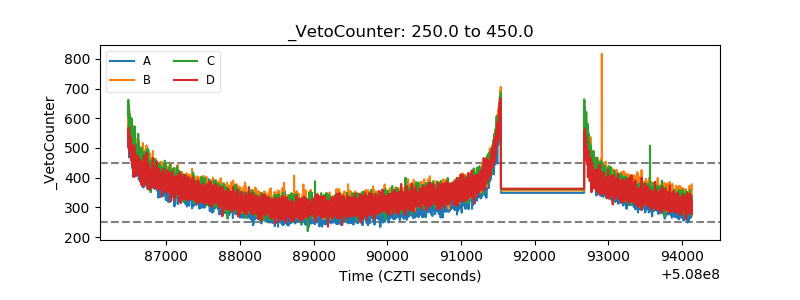 |