| Param | Original file | Final file |
|---|---|---|
| Filename | modeM0/AS1A14_083T03_9000006548_56059cztM0_level2.fits | modeM0/AS1A14_083T03_9000006548_56059cztM0_level2_quad_clean.evt |
| Size (bytes) | 638,550,720 | 87,575,040 |
| Size | 609.0 MB | 83.5 MB |
| Events in quadrant A | 12,540,567 | 289,300 |
| Events in quadrant B | 3,719,200 | 689,370 |
| Events in quadrant C | 3,253,971 | 615,651 |
| Events in quadrant D | 3,584,149 | 573,905 |
| Mode M0 | |||
|---|---|---|---|
| Quadrant | BADHDUFLAG | Total packets | Discarded packets |
| A | 0 | 41974 | 3 |
| B | 0 | 16102 | 3 |
| C | 0 | 15132 | 3 |
| D | 0 | 15992 | 3 |
| Mode SS | |||
|---|---|---|---|
| Quadrant | BADHDUFLAG | Total packets | Discarded packets |
| A | 0 | 142 | 0 |
| B | 0 | 142 | 0 |
| C | 0 | 142 | 0 |
| D | 0 | 142 | 0 |
| Mode M9 | |||
|---|---|---|---|
| Quadrant | BADHDUFLAG | Total packets | Discarded packets |
| A | 0 | 8 | 0 |
| B | 0 | 9 | 0 |
| C | 0 | 9 | 0 |
| D | 0 | 9 | 0 |
| Quadrant | Total seconds | Saturated seconds | Saturation percentage |
|---|---|---|---|
| A | 6937 | 3884 | 55.989621% |
| B | 6937 | 161 | 2.320888% |
| C | 6937 | 69 | 0.994666% |
| D | 6937 | 61 | 0.879343% |
Noise dominated data is calculated using 1-second bins in cleaned event files. If a bin has >2000 counts, and if more than 50% of those come from <1% of pixels, then it is considered to be noise-dominated and hence unusable.
| Quadrant | # 1 sec bins | Bins with >0 counts | Bins with >2000 counts | High rate bins dominated by noise | Noise dominated (total time) | Noise dominated (detector-on time) | Marked lightcurve |
|---|---|---|---|---|---|---|---|
| A | 7587 | 6938 | 3775 | 3775 | 49.76% | 54.41% | 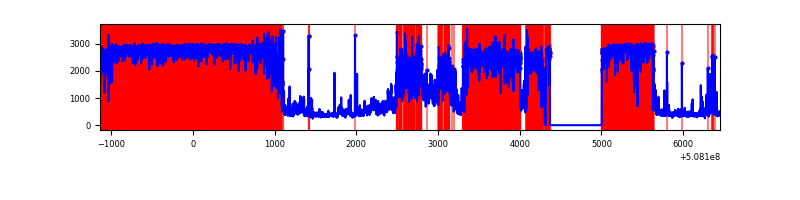 |
| B | 7587 | 6939 | 44 | 44 | 0.58% | 0.63% | 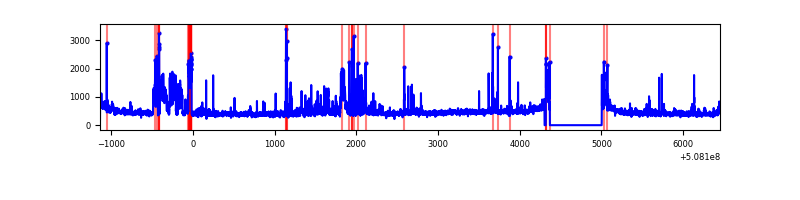 |
| C | 7587 | 6939 | 39 | 39 | 0.51% | 0.56% | 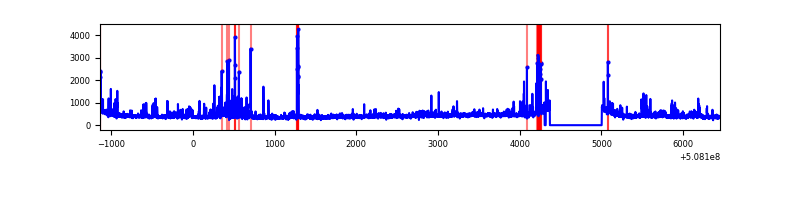 |
| D | 7587 | 6939 | 44 | 44 | 0.58% | 0.63% | 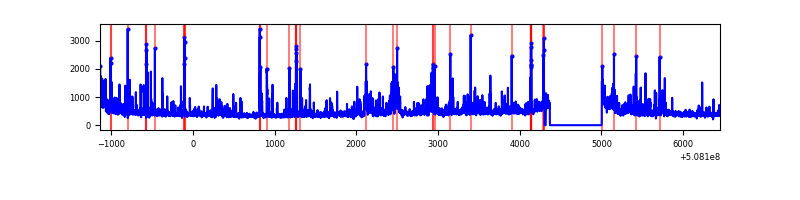 |
Top three noisy pixels from each quadrant. If the there are fewer than three noisy pixels in the level2.evt file, extra rows are filled as -1
| Pixel properties | Quadrant properties | ||||||
|---|---|---|---|---|---|---|---|
| Quadrant | DetID | PixID | Counts | Sigma | Mean | Median | Sigma |
| A | 12 | 115 | 10107404 | 87112.94 | 463 | 452 | 116.0 |
| A | 4 | 249 | 196113 | 1686.42 | 463 | 452 | 116.0 |
| A | 15 | 32 | 148813 | 1278.74 | 463 | 452 | 116.0 |
| B | 5 | 172 | 458115 | 2982.78 | 720 | 693 | 153.4 |
| B | 10 | 247 | 150130 | 974.46 | 720 | 693 | 153.4 |
| B | 0 | 213 | 52477 | 337.68 | 720 | 693 | 153.4 |
| C | 13 | 3 | 171932 | 892.94 | 701 | 694 | 191.8 |
| C | 12 | 252 | 119523 | 619.65 | 701 | 694 | 191.8 |
| C | 15 | 230 | 81826 | 423.07 | 701 | 694 | 191.8 |
| D | 11 | 129 | 314081 | 1616.95 | 692 | 662 | 193.8 |
| D | 6 | 42 | 209538 | 1077.6 | 692 | 662 | 193.8 |
| D | 2 | 31 | 59395 | 303.01 | 692 | 662 | 193.8 |
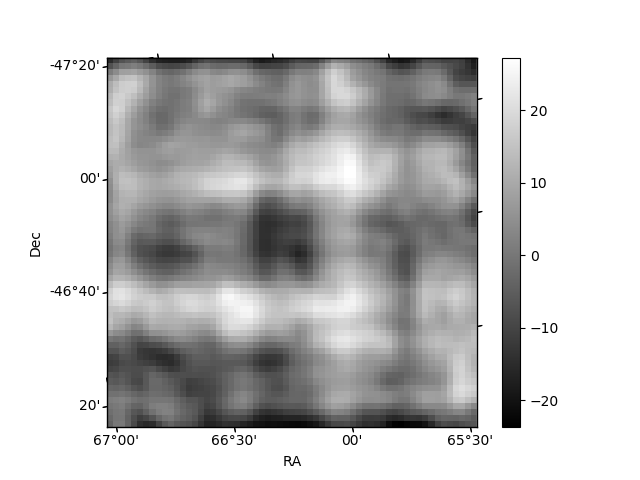
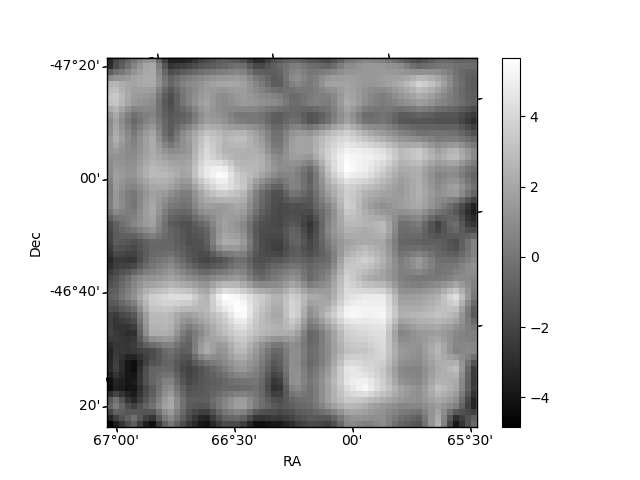
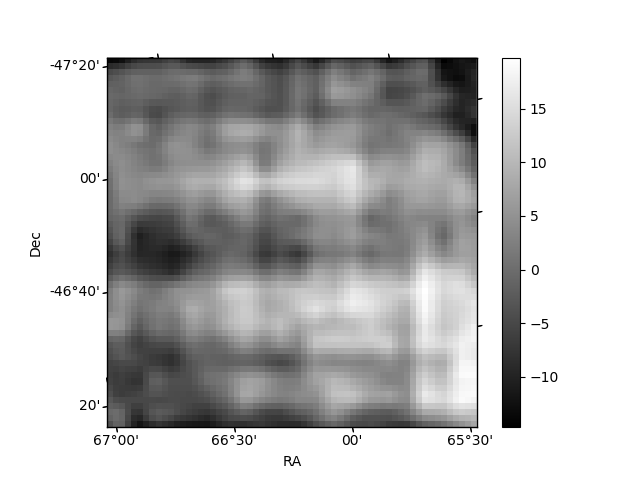
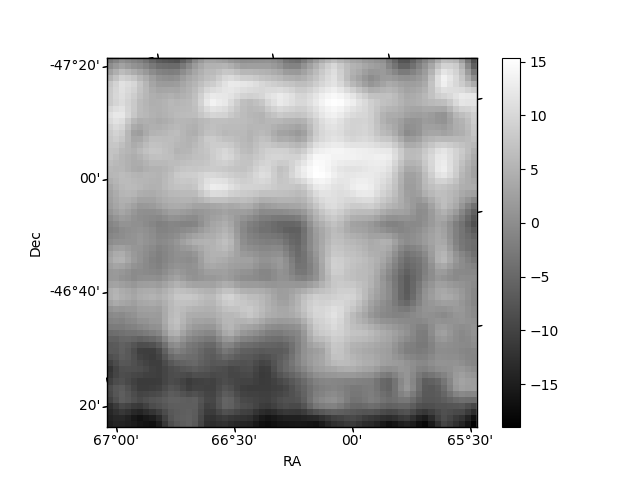
Histogram calculated using DETX and DETY for each event in the final _common_clean file
| Quadrant A | 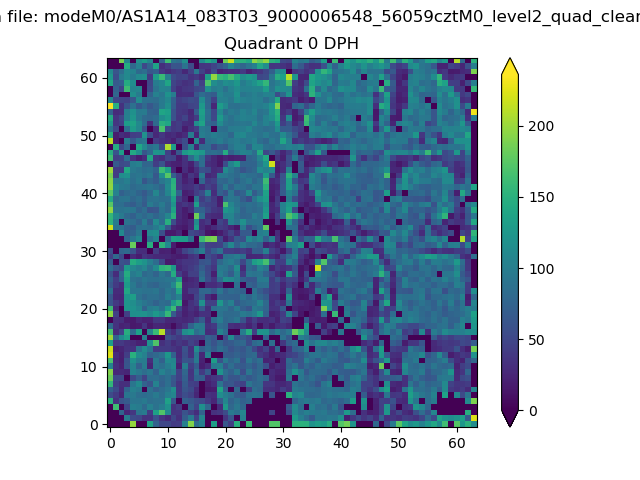 |
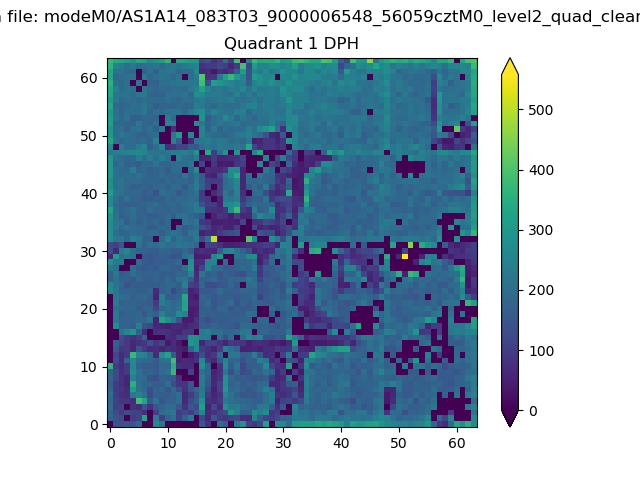 |
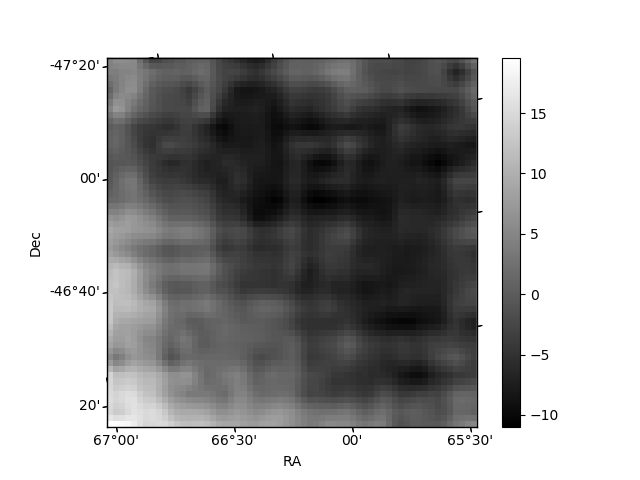
Quadrant B |
|---|---|---|---|
| Quadrant D | 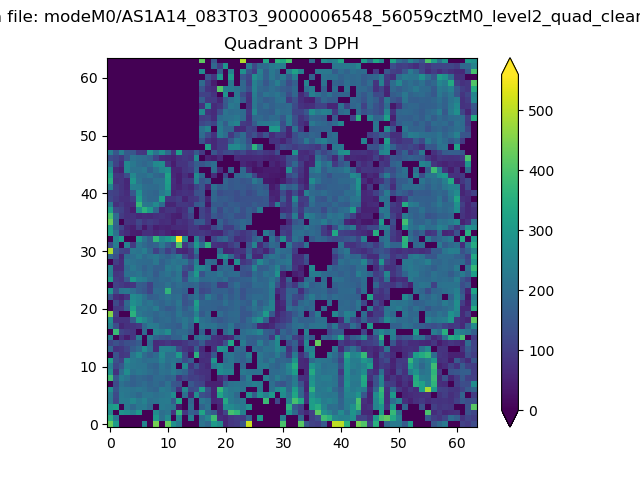 |
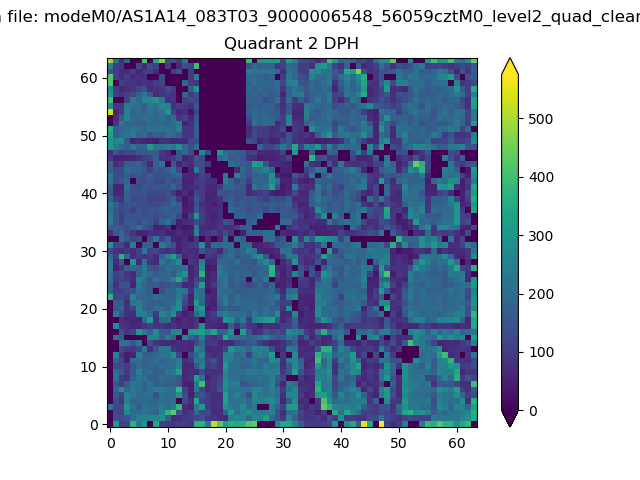 |
Quadrant C |
| Plot type | Count rate plots | Images |
|---|---|---|
| Comparison with Poisson distribution Blue bars denote a histogram of data divided into 1 sec bins. Red curve is a Poisson curve with rate = median count rate of data. |
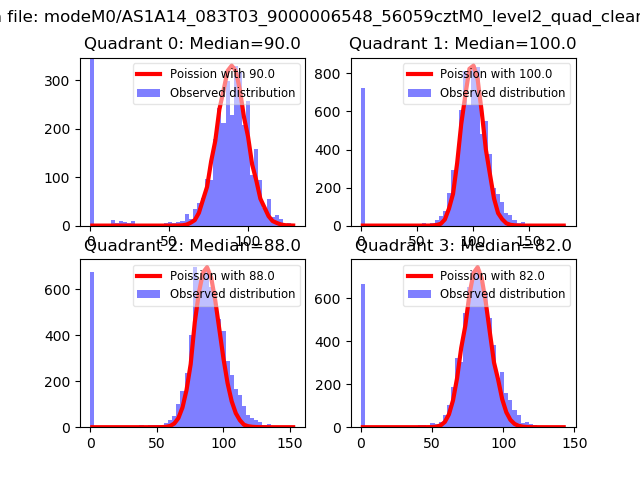 |
 |
| Quadrant-wise count rates Data is divided into 100 sec bins |
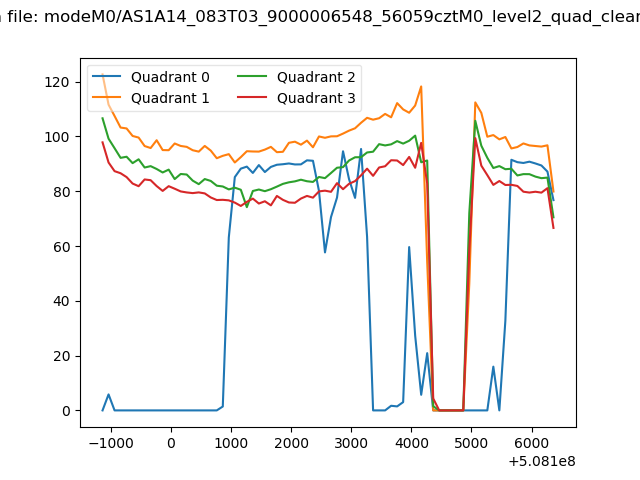 |
|
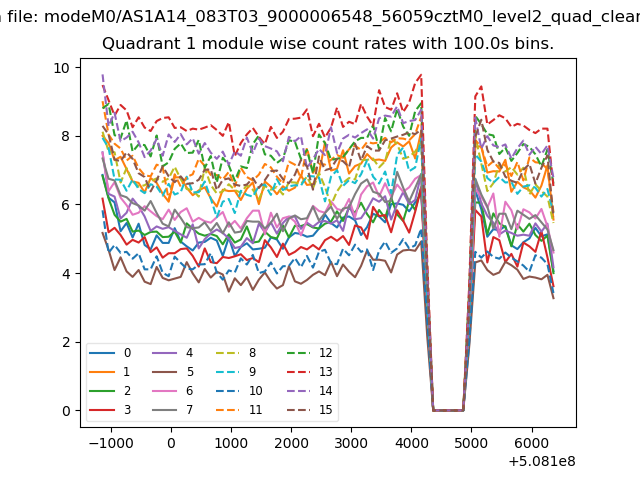
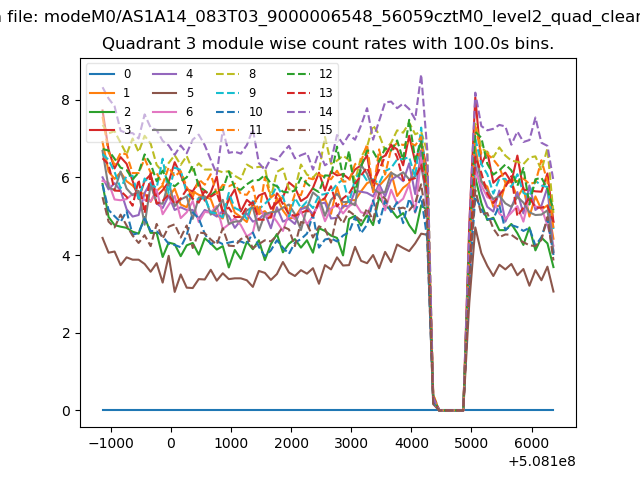
| Module-wise count rates for Quadrant A Data is divided into 100 sec bins |
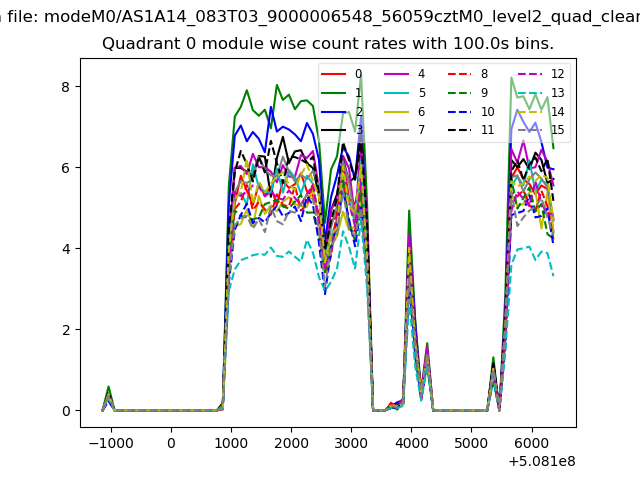 |
 |
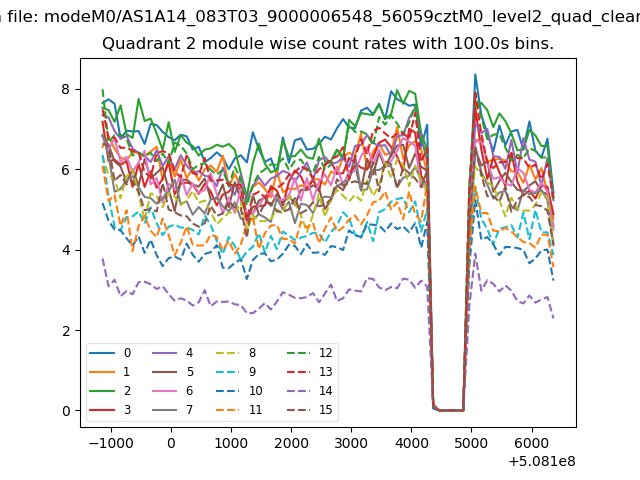
| Module-wise count rates for Quadrant B Data is divided into 100 sec bins |
 |
 |
| Module-wise count rates for Quadrant C Data is divided into 100 sec bins |
 |
 |
| Module-wise count rates for Quadrant D Data is divided into 100 sec bins |
 |
 |
| Parameter | Plot |
|---|---|
| CZT HV Monitor | 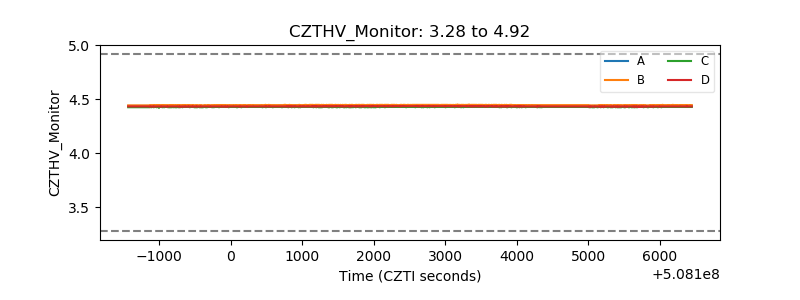 |
| D_VDD | 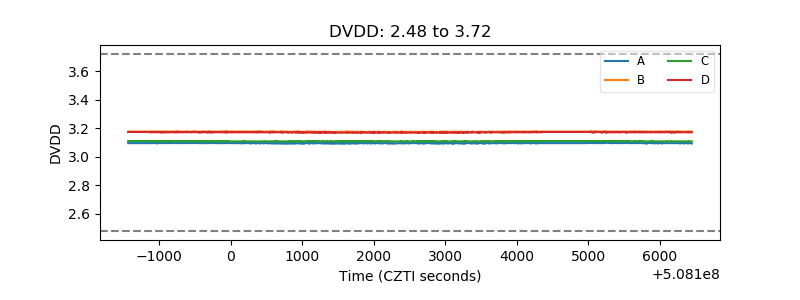 |
| Temperature 1 | 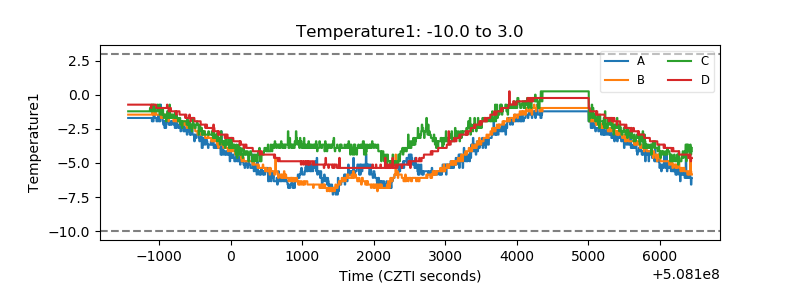 |
| Veto HV Monitor | 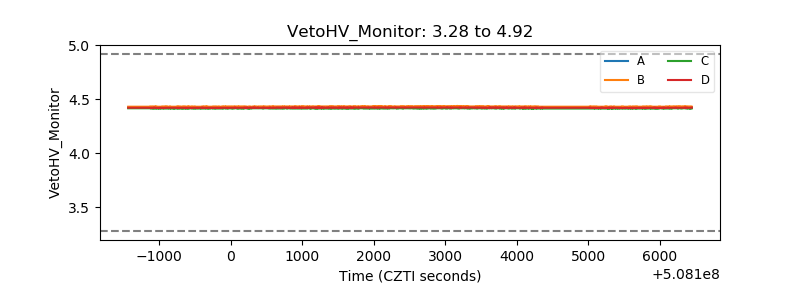 |
| Veto LLD | 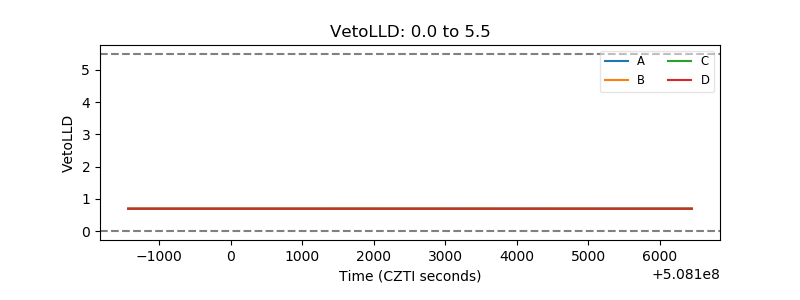 |
| Alpha Counter | 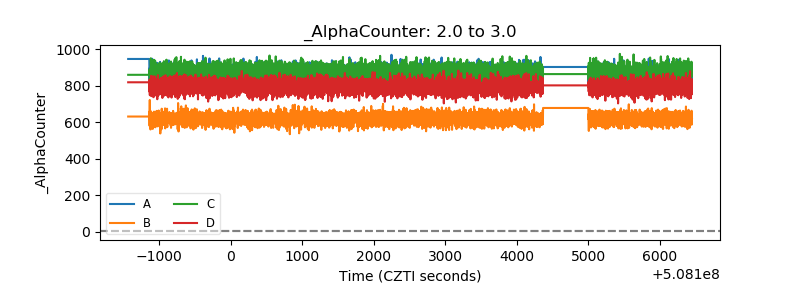 |
| _CPM_Rate | 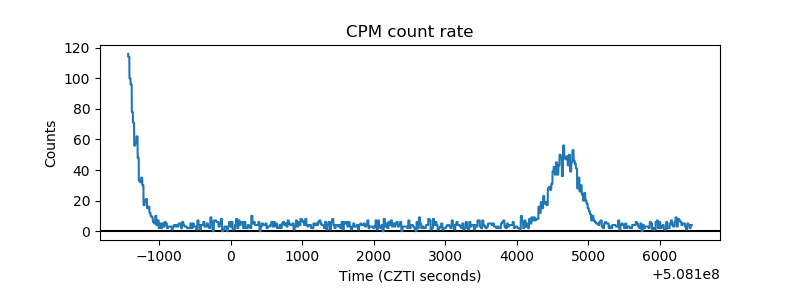 |
| CZT Counter | 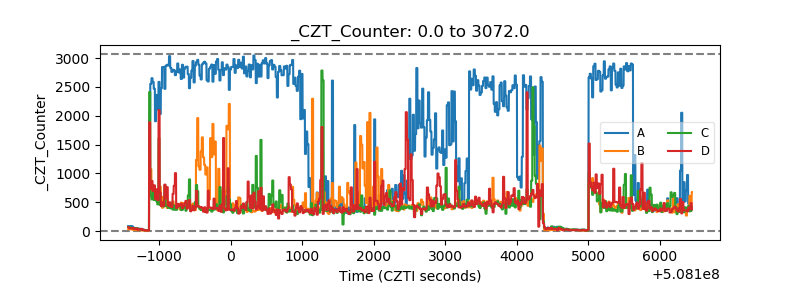 |
| +2.5 Volts monitor | 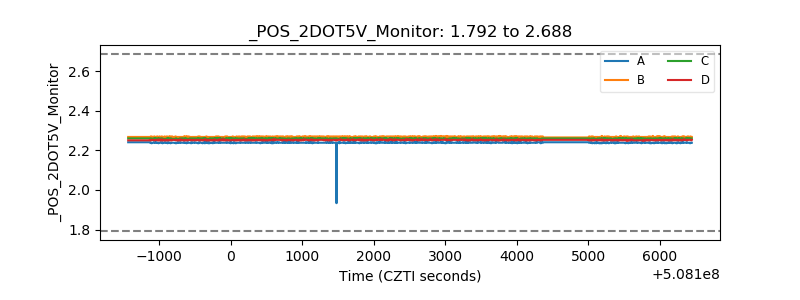 |
| +5 Volts monitor |  |
| _ROLL_ROT | 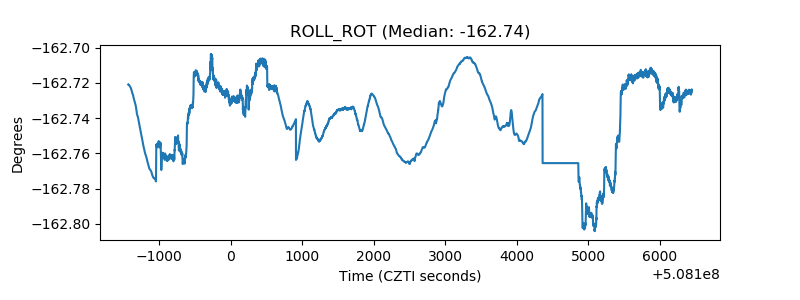 |
| _Roll_DEC | 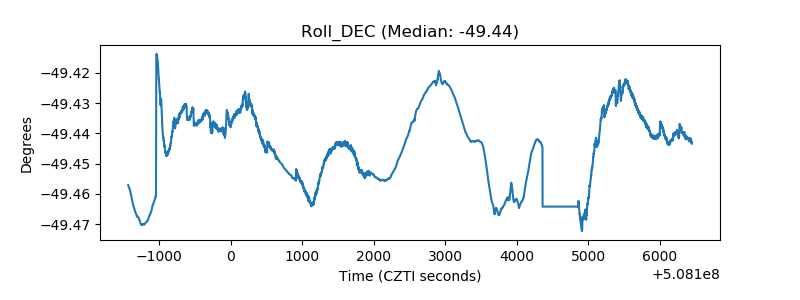 |
| _Roll_RA | 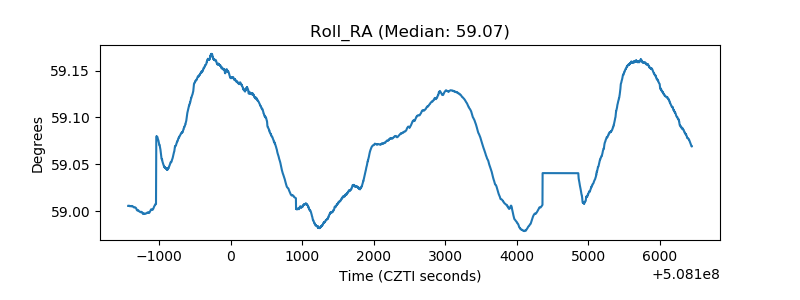 |
| Veto Counter | 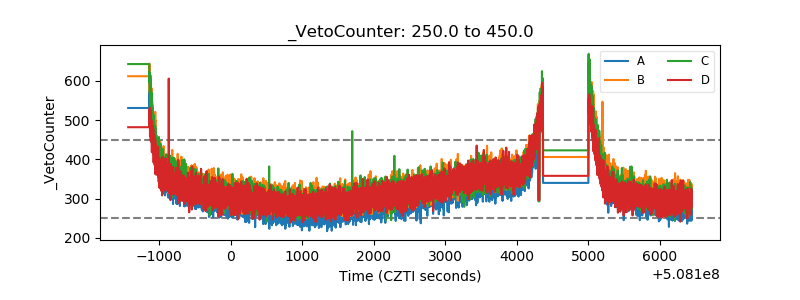 |