| Param | Original file | Final file |
|---|---|---|
| Filename | modeM0/AS1A14_083T03_9000006548_56060cztM0_level2.fits | modeM0/AS1A14_083T03_9000006548_56060cztM0_level2_quad_clean.evt |
| Size (bytes) | 472,377,600 | 107,861,760 |
| Size | 450.5 MB | 102.9 MB |
| Events in quadrant A | 4,963,577 | 659,379 |
| Events in quadrant B | 4,296,696 | 754,006 |
| Events in quadrant C | 3,553,936 | 685,103 |
| Events in quadrant D | 4,075,368 | 634,606 |
| Mode M0 | |||
|---|---|---|---|
| Quadrant | BADHDUFLAG | Total packets | Discarded packets |
| A | 0 | 20649 | 2 |
| B | 0 | 18428 | 2 |
| C | 0 | 16669 | 2 |
| D | 0 | 17965 | 3 |
| Mode SS | |||
|---|---|---|---|
| Quadrant | BADHDUFLAG | Total packets | Discarded packets |
| A | 0 | 154 | 0 |
| B | 0 | 154 | 0 |
| C | 0 | 154 | 0 |
| D | 0 | 154 | 0 |
| Mode M9 | |||
|---|---|---|---|
| Quadrant | BADHDUFLAG | Total packets | Discarded packets |
| A | 0 | 2 | 0 |
| B | 0 | 3 | 0 |
| C | 0 | 3 | 0 |
| D | 0 | 3 | 0 |
| Quadrant | Total seconds | Saturated seconds | Saturation percentage |
|---|---|---|---|
| A | 7664 | 654 | 8.533403% |
| B | 7664 | 291 | 3.796973% |
| C | 7664 | 55 | 0.717641% |
| D | 7663 | 108 | 1.409370% |
Noise dominated data is calculated using 1-second bins in cleaned event files. If a bin has >2000 counts, and if more than 50% of those come from <1% of pixels, then it is considered to be noise-dominated and hence unusable.
| Quadrant | # 1 sec bins | Bins with >0 counts | Bins with >2000 counts | High rate bins dominated by noise | Noise dominated (total time) | Noise dominated (detector-on time) | Marked lightcurve |
|---|---|---|---|---|---|---|---|
| A | 7679 | 7665 | 631 | 631 | 8.22% | 8.23% |  |
| B | 7679 | 7665 | 150 | 150 | 1.95% | 1.96% | 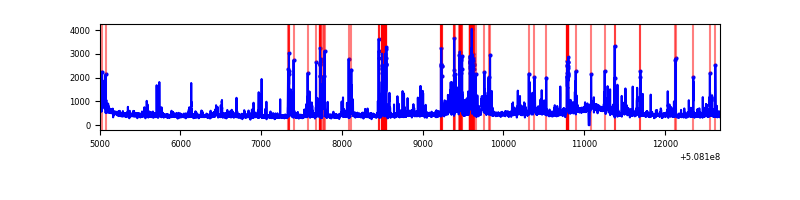 |
| C | 7679 | 7665 | 22 | 22 | 0.29% | 0.29% |  |
| D | 7678 | 7664 | 61 | 61 | 0.79% | 0.80% | 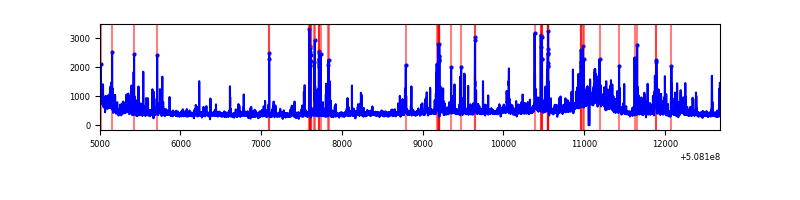 |
Top three noisy pixels from each quadrant. If the there are fewer than three noisy pixels in the level2.evt file, extra rows are filled as -1
| Pixel properties | Quadrant properties | ||||||
|---|---|---|---|---|---|---|---|
| Quadrant | DetID | PixID | Counts | Sigma | Mean | Median | Sigma |
| A | 12 | 115 | 1515293 | 8045.99 | 756 | 739 | 188.2 |
| A | 15 | 32 | 180377 | 954.32 | 756 | 739 | 188.2 |
| A | 0 | 8 | 113155 | 597.2 | 756 | 739 | 188.2 |
| B | 2 | 249 | 453513 | 2675.0 | 800 | 770 | 169.2 |
| B | 10 | 247 | 137780 | 809.51 | 800 | 770 | 169.2 |
| B | 9 | 251 | 112804 | 661.95 | 800 | 770 | 169.2 |
| C | 13 | 3 | 163006 | 752.75 | 789 | 779 | 215.5 |
| C | 15 | 147 | 98403 | 452.98 | 789 | 779 | 215.5 |
| C | 12 | 252 | 94559 | 435.15 | 789 | 779 | 215.5 |
| D | 11 | 129 | 306651 | 1396.2 | 782 | 747 | 219.1 |
| D | 6 | 42 | 120368 | 545.97 | 782 | 747 | 219.1 |
| D | 14 | 52 | 115831 | 525.26 | 782 | 747 | 219.1 |
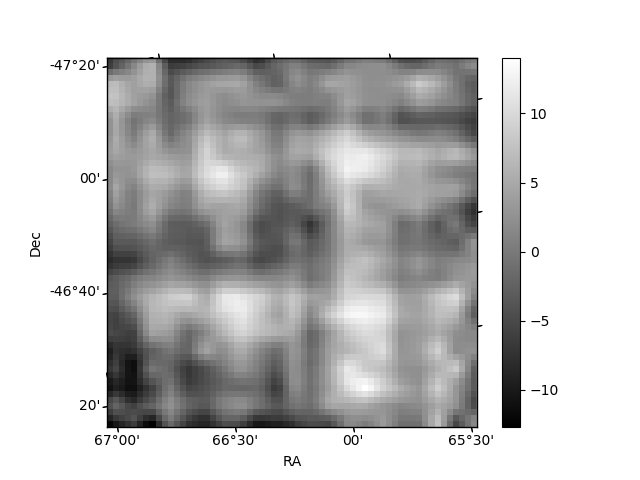
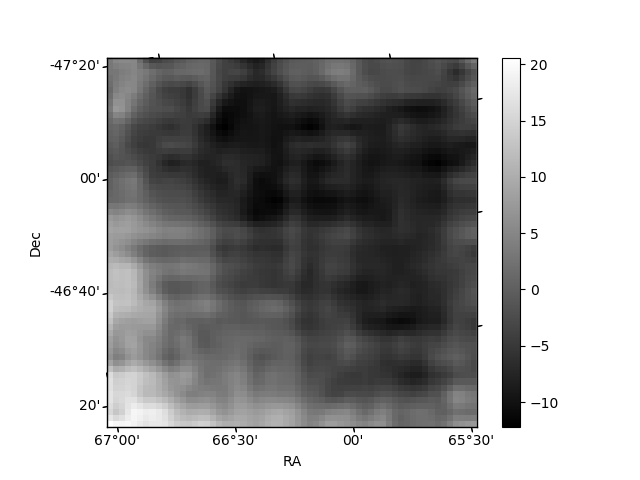
Histogram calculated using DETX and DETY for each event in the final _common_clean file
| Quadrant A | 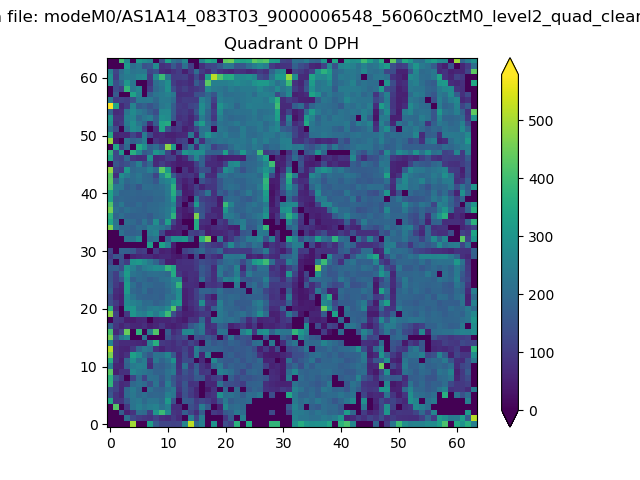 |
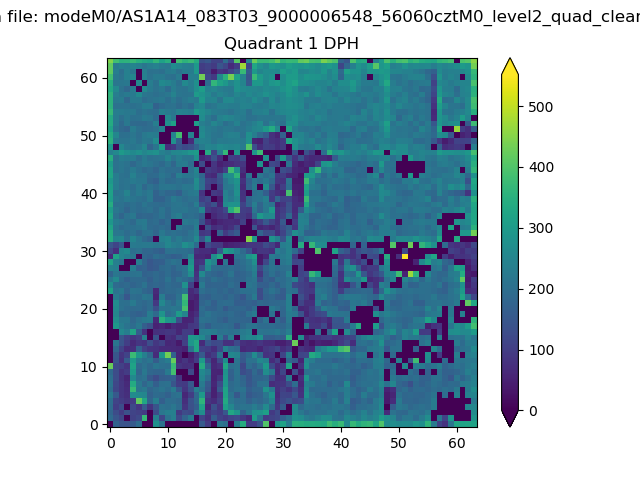 |
Quadrant B |
|---|---|---|---|
| Quadrant D |  |
 |
Quadrant C |
| Plot type | Count rate plots | Images |
|---|---|---|
| Comparison with Poisson distribution Blue bars denote a histogram of data divided into 1 sec bins. Red curve is a Poisson curve with rate = median count rate of data. |
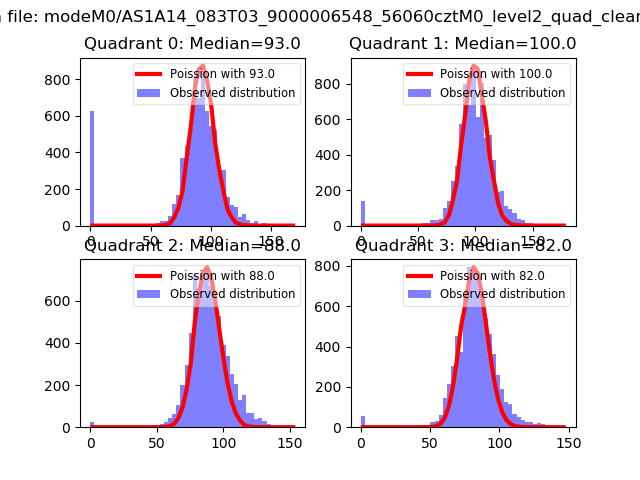 |
 |
| Quadrant-wise count rates Data is divided into 100 sec bins |
 |
|
| Module-wise count rates for Quadrant A Data is divided into 100 sec bins |
 |
 |
| Module-wise count rates for Quadrant B Data is divided into 100 sec bins |
 |
 |
| Module-wise count rates for Quadrant C Data is divided into 100 sec bins |
 |
 |
| Module-wise count rates for Quadrant D Data is divided into 100 sec bins |
 |
 |
| Parameter | Plot |
|---|---|
| CZT HV Monitor | 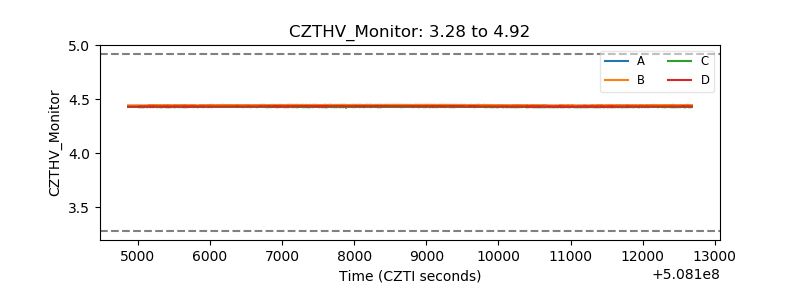 |
| D_VDD | 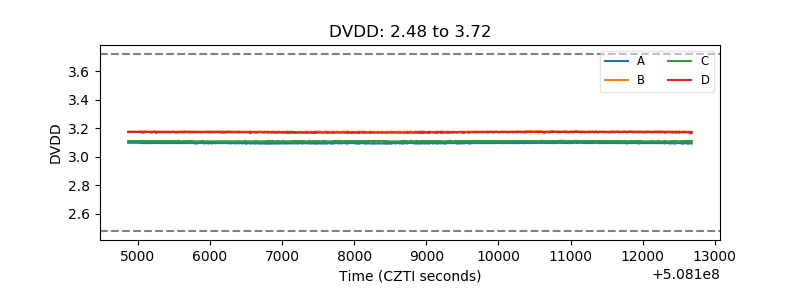 |
| Temperature 1 |  |
| Veto HV Monitor |  |
| Veto LLD |  |
| Alpha Counter |  |
| _CPM_Rate | 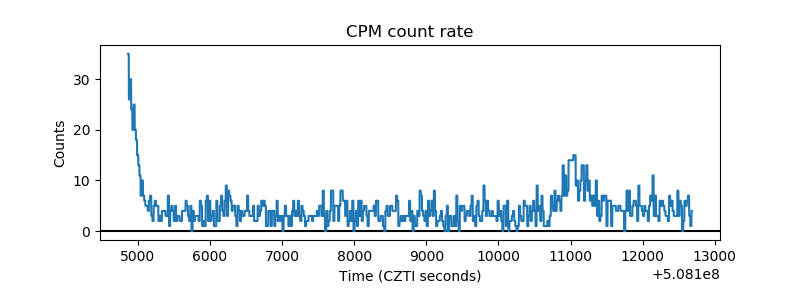 |
| CZT Counter |  |
| +2.5 Volts monitor |  |
| +5 Volts monitor | 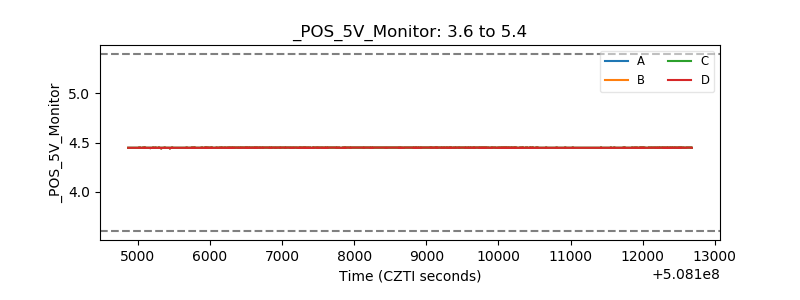 |
| _ROLL_ROT |  |
| _Roll_DEC |  |
| _Roll_RA |  |
| Veto Counter |  |