| Param | Original file | Final file |
|---|---|---|
| Filename | modeM0/AS1A14_083T03_9000006548_56062cztM0_level2.fits | modeM0/AS1A14_083T03_9000006548_56062cztM0_level2_quad_clean.evt |
| Size (bytes) | 454,253,760 | 114,114,240 |
| Size | 433.2 MB | 108.8 MB |
| Events in quadrant A | 3,969,650 | 740,694 |
| Events in quadrant B | 4,496,147 | 790,276 |
| Events in quadrant C | 3,695,392 | 703,986 |
| Events in quadrant D | 4,024,962 | 658,098 |
| Mode M0 | |||
|---|---|---|---|
| Quadrant | BADHDUFLAG | Total packets | Discarded packets |
| A | 0 | 18157 | 1 |
| B | 0 | 19210 | 0 |
| C | 0 | 17422 | 0 |
| D | 0 | 18271 | 0 |
| Mode SS | |||
|---|---|---|---|
| Quadrant | BADHDUFLAG | Total packets | Discarded packets |
| A | 0 | 162 | 0 |
| B | 0 | 162 | 0 |
| C | 0 | 162 | 0 |
| D | 0 | 162 | 0 |
| Quadrant | Total seconds | Saturated seconds | Saturation percentage |
|---|---|---|---|
| A | 8085 | 69 | 0.853432% |
| B | 8085 | 205 | 2.535560% |
| C | 8085 | 58 | 0.717378% |
| D | 8086 | 43 | 0.531783% |
Noise dominated data is calculated using 1-second bins in cleaned event files. If a bin has >2000 counts, and if more than 50% of those come from <1% of pixels, then it is considered to be noise-dominated and hence unusable.
| Quadrant | # 1 sec bins | Bins with >0 counts | Bins with >2000 counts | High rate bins dominated by noise | Noise dominated (total time) | Noise dominated (detector-on time) | Marked lightcurve |
|---|---|---|---|---|---|---|---|
| A | 8085 | 8085 | 51 | 51 | 0.63% | 0.63% | 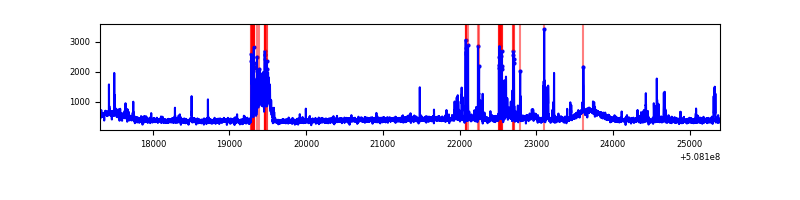 |
| B | 8085 | 8085 | 121 | 121 | 1.50% | 1.50% | 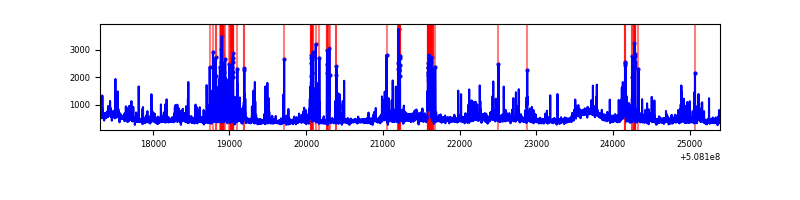 |
| C | 8085 | 8085 | 47 | 47 | 0.58% | 0.58% | 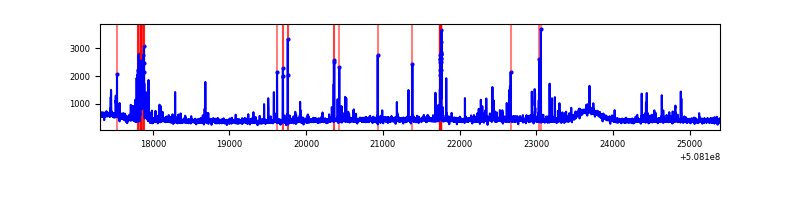 |
| D | 8086 | 8086 | 40 | 40 | 0.49% | 0.49% | 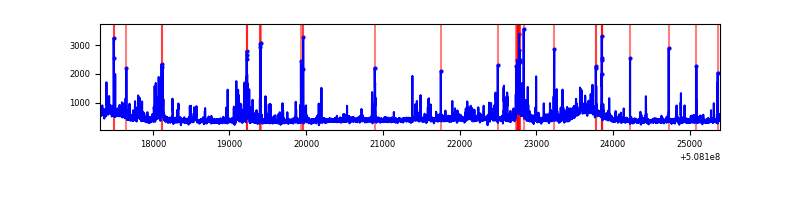 |
Top three noisy pixels from each quadrant. If the there are fewer than three noisy pixels in the level2.evt file, extra rows are filled as -1
| Pixel properties | Quadrant properties | ||||||
|---|---|---|---|---|---|---|---|
| Quadrant | DetID | PixID | Counts | Sigma | Mean | Median | Sigma |
| A | 7 | 14 | 287136 | 1347.89 | 852 | 831 | 212.4 |
| A | 15 | 32 | 207144 | 971.3 | 852 | 831 | 212.4 |
| A | 0 | 8 | 63939 | 297.1 | 852 | 831 | 212.4 |
| B | 2 | 249 | 446951 | 2465.26 | 846 | 816 | 181.0 |
| B | 0 | 213 | 196716 | 1082.51 | 846 | 816 | 181.0 |
| B | 10 | 247 | 153413 | 843.22 | 846 | 816 | 181.0 |
| C | 6 | 223 | 120762 | 526.08 | 834 | 826 | 228.0 |
| C | 15 | 230 | 117059 | 509.84 | 834 | 826 | 228.0 |
| C | 12 | 252 | 86374 | 375.24 | 834 | 826 | 228.0 |
| D | 6 | 42 | 226220 | 974.22 | 823 | 786 | 231.4 |
| D | 11 | 129 | 79001 | 338.01 | 823 | 786 | 231.4 |
| D | 8 | 245 | 77983 | 333.61 | 823 | 786 | 231.4 |
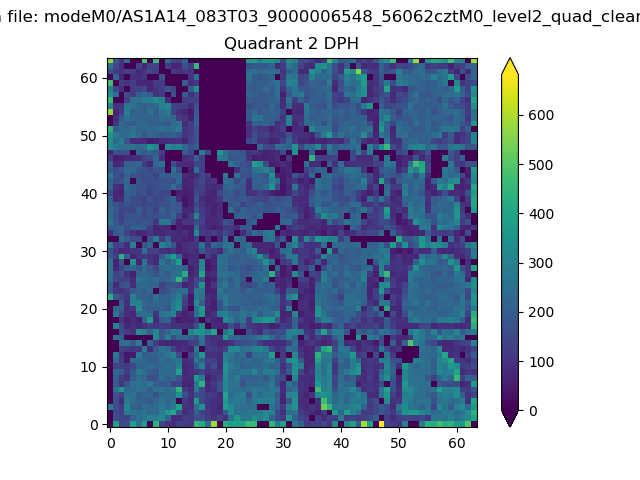
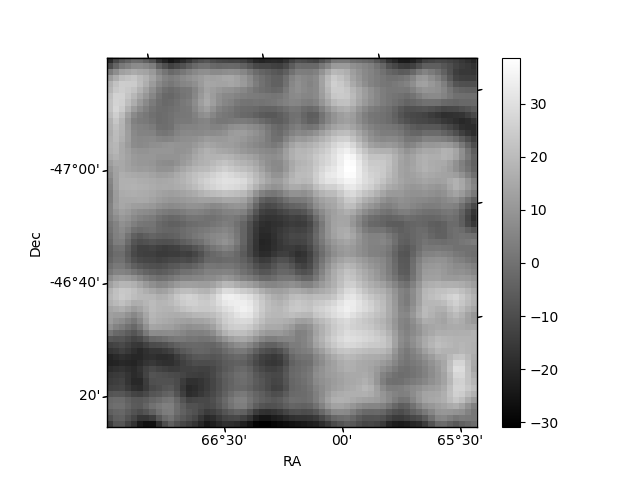
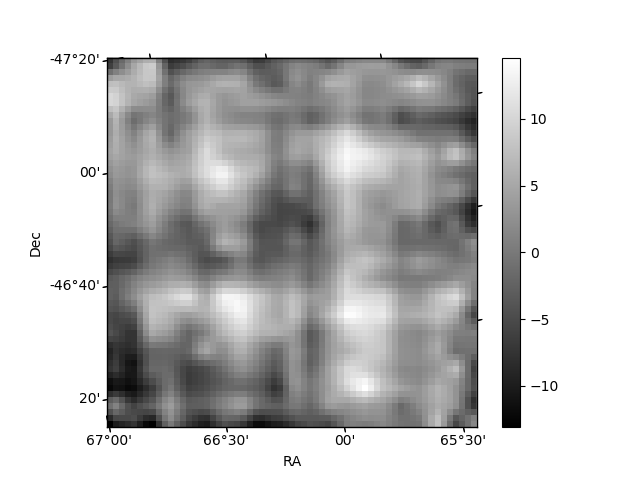
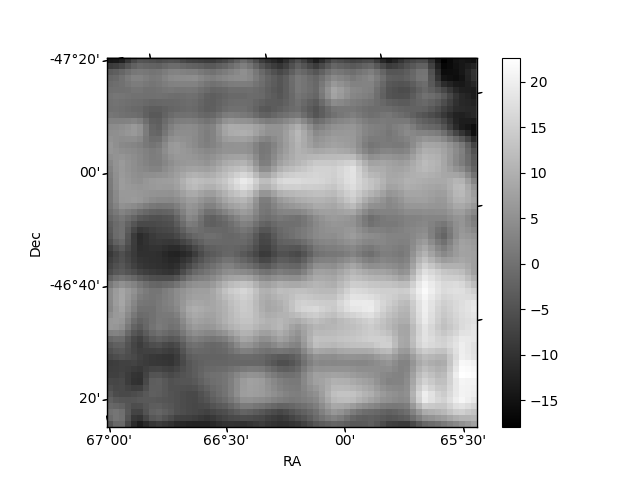
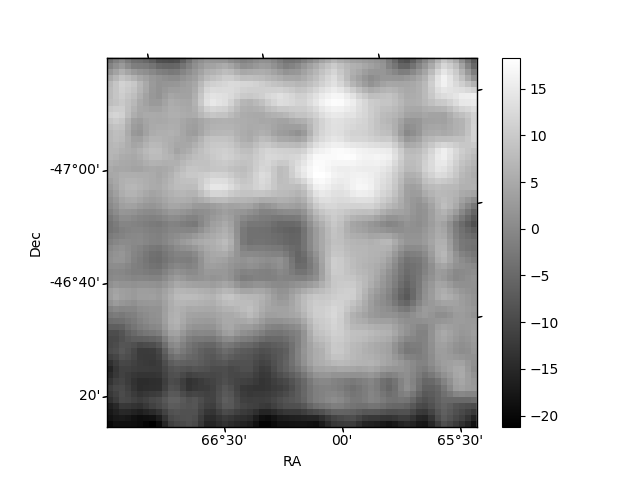
Histogram calculated using DETX and DETY for each event in the final _common_clean file
| Quadrant A | 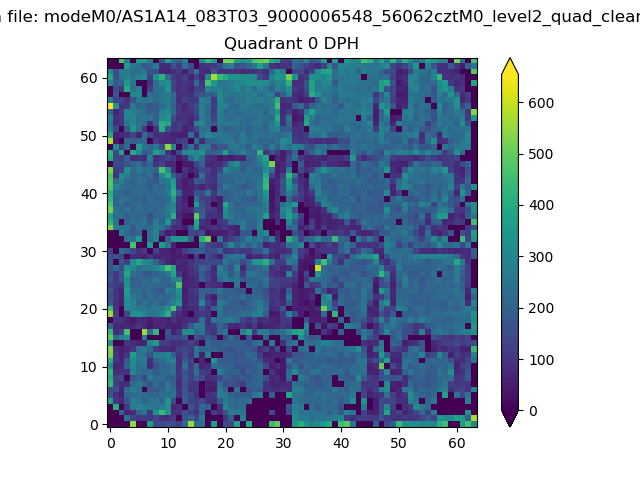 |
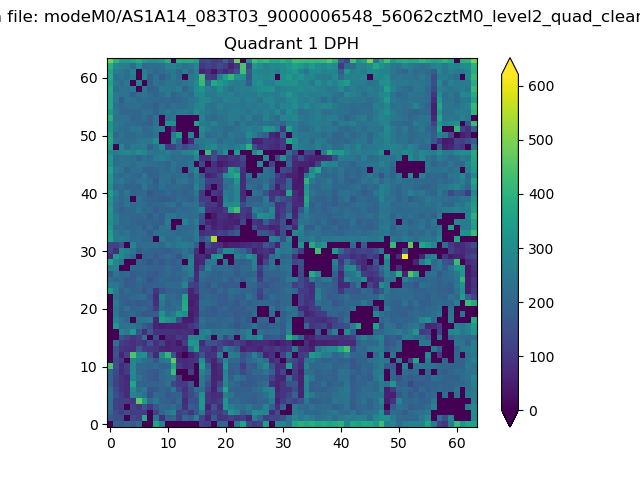 |
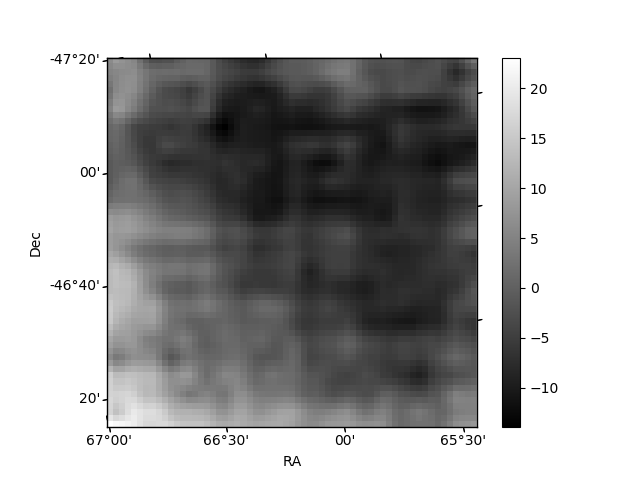
Quadrant B |
|---|---|---|---|
| Quadrant D | 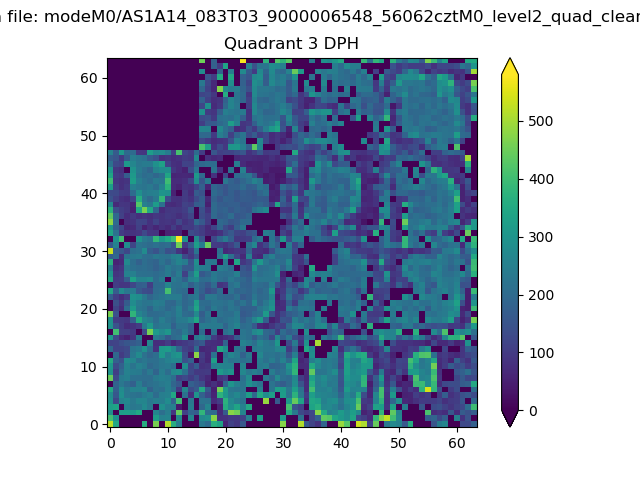 |
 |
Quadrant C |
| Plot type | Count rate plots | Images |
|---|---|---|
| Comparison with Poisson distribution Blue bars denote a histogram of data divided into 1 sec bins. Red curve is a Poisson curve with rate = median count rate of data. |
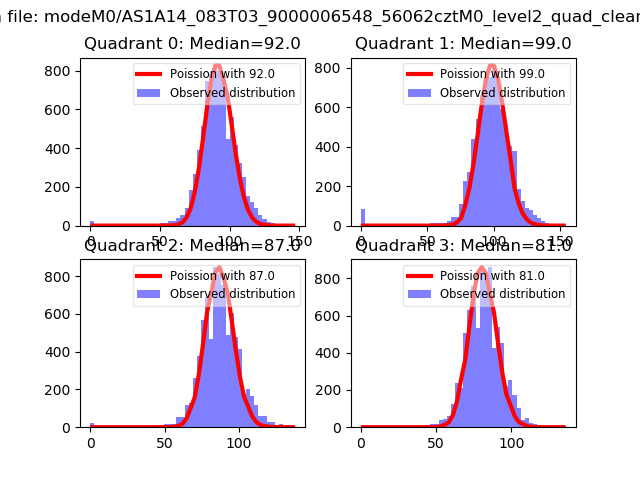 |
 |
| Quadrant-wise count rates Data is divided into 100 sec bins |
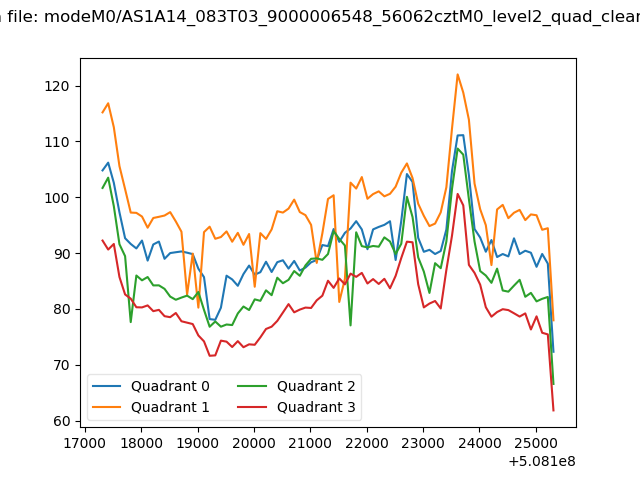 |
|
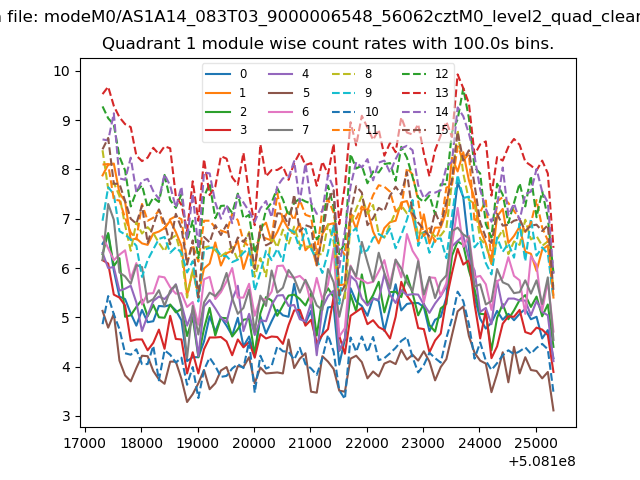
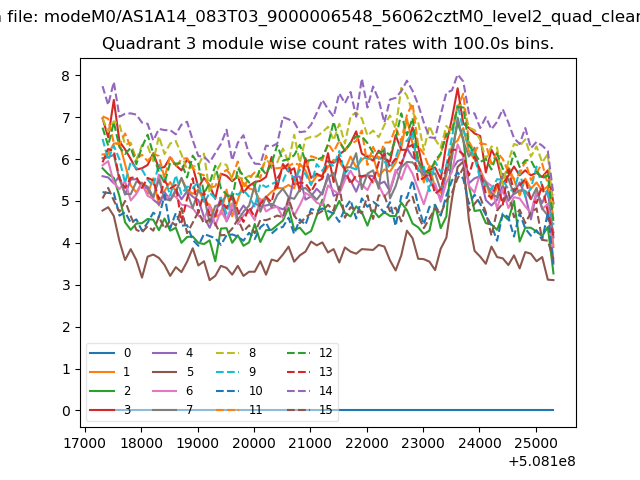
| Module-wise count rates for Quadrant A Data is divided into 100 sec bins |
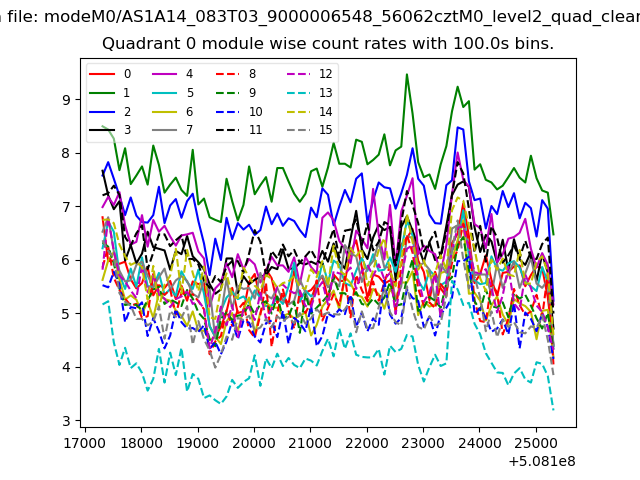 |
 |
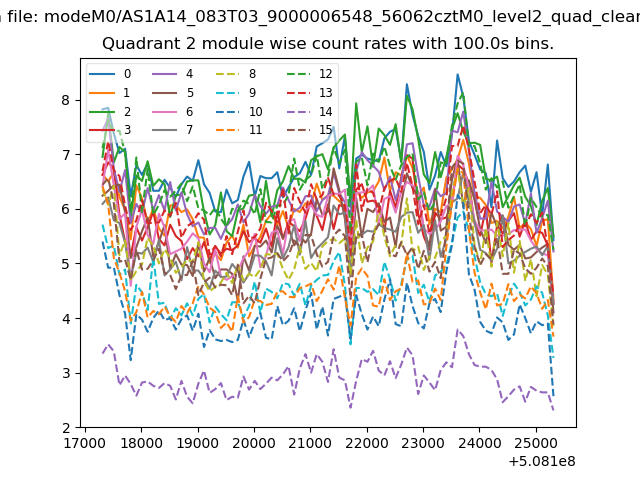
| Module-wise count rates for Quadrant B Data is divided into 100 sec bins |
 |
 |
| Module-wise count rates for Quadrant C Data is divided into 100 sec bins |
 |
 |
| Module-wise count rates for Quadrant D Data is divided into 100 sec bins |
 |
 |
| Parameter | Plot |
|---|---|
| CZT HV Monitor | 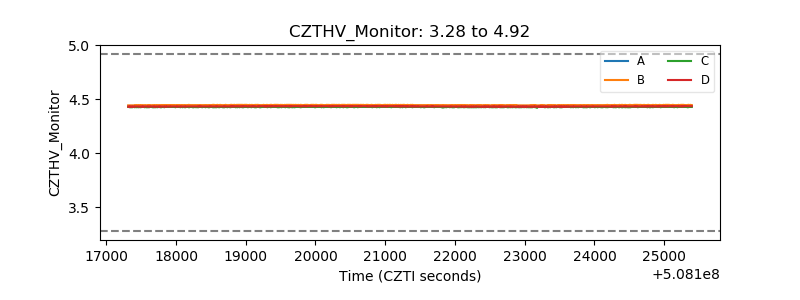 |
| D_VDD | 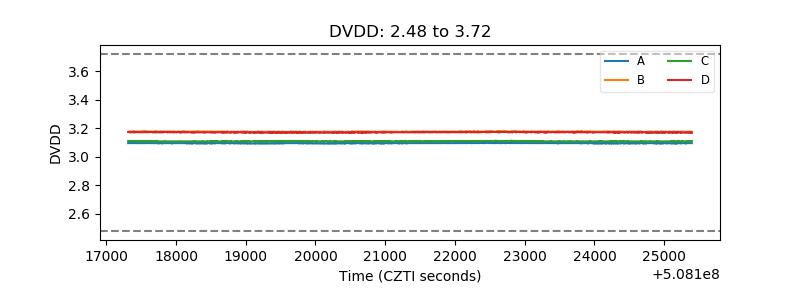 |
| Temperature 1 | 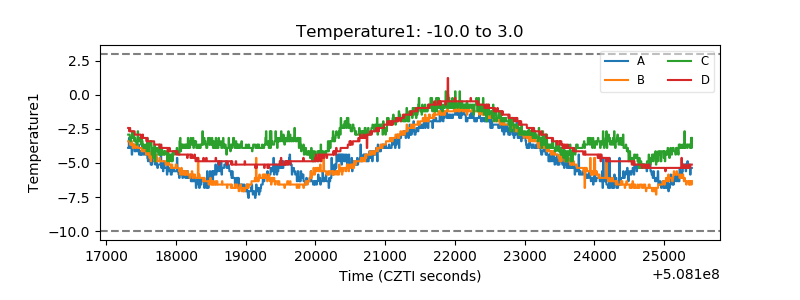 |
| Veto HV Monitor | 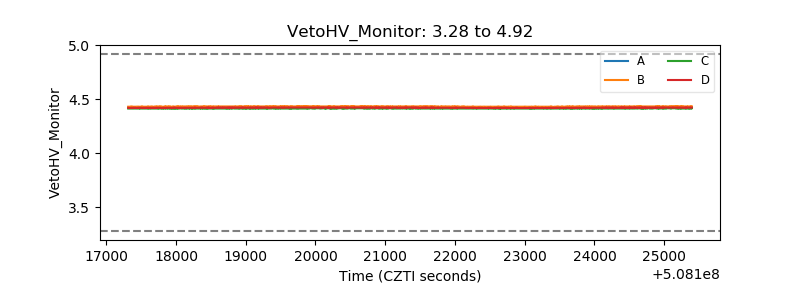 |
| Veto LLD | 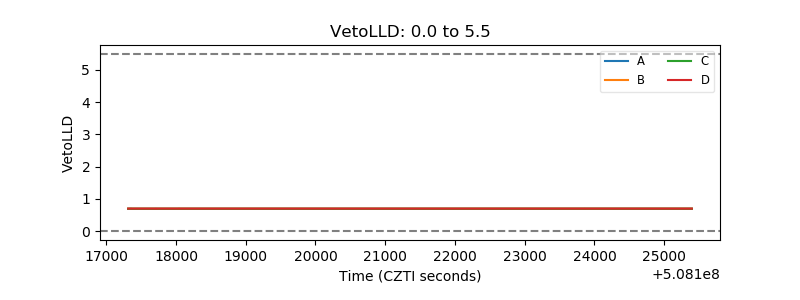 |
| Alpha Counter | 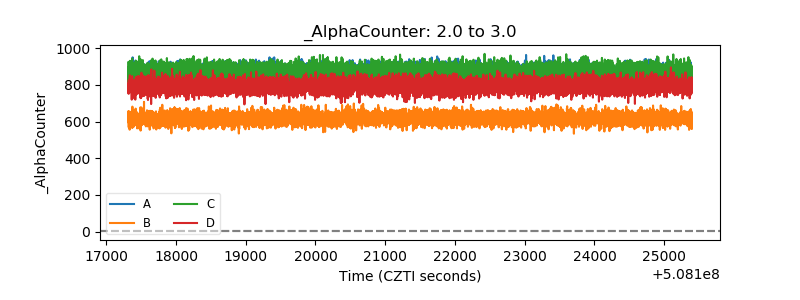 |
| _CPM_Rate | 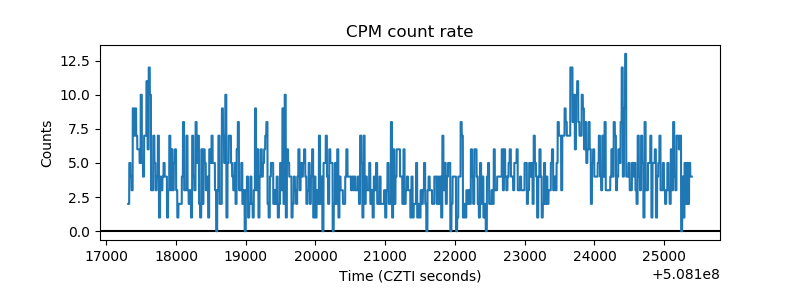 |
| CZT Counter | 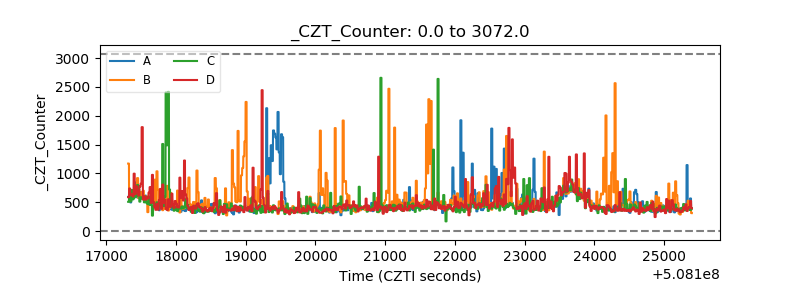 |
| +2.5 Volts monitor | 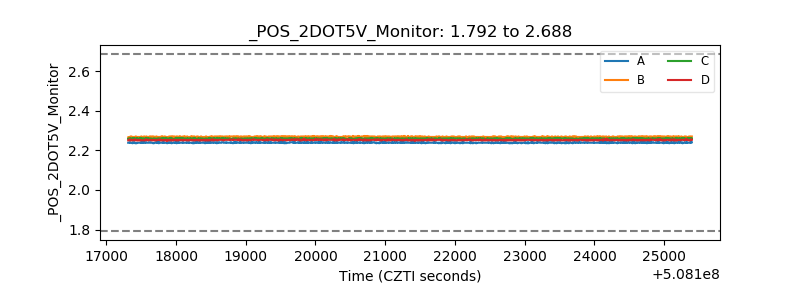 |
| +5 Volts monitor | 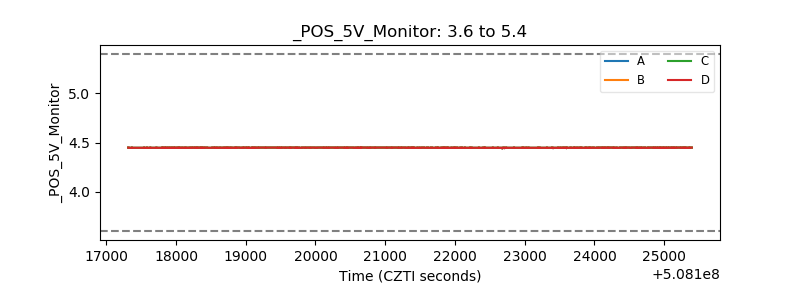 |
| _ROLL_ROT | 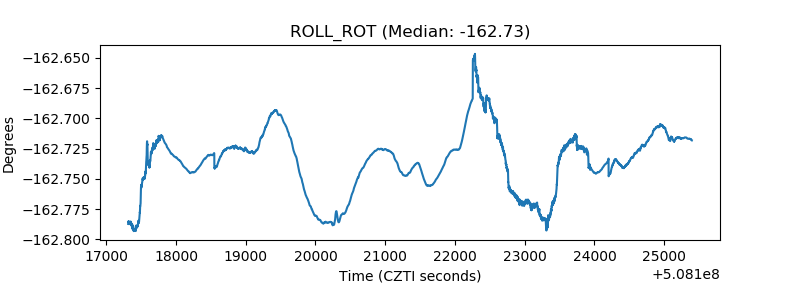 |
| _Roll_DEC | 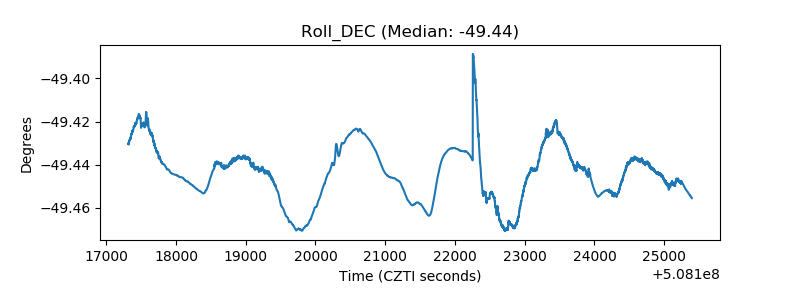 |
| _Roll_RA | 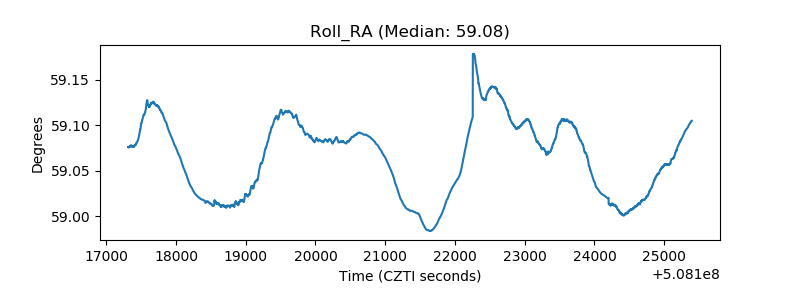 |
| Veto Counter | 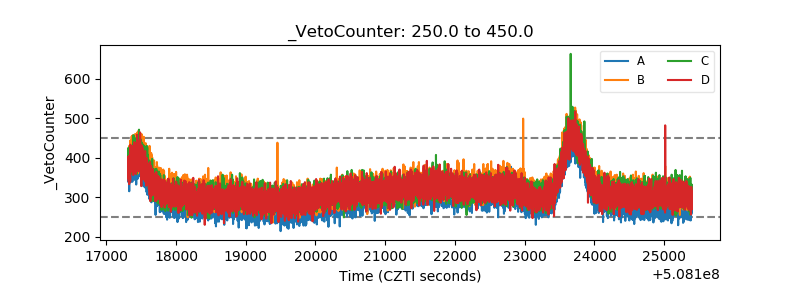 |