| Param | Original file | Final file |
|---|---|---|
| Filename | modeM0/AS1A14_083T03_9000006548_56065cztM0_level2.fits | modeM0/AS1A14_083T03_9000006548_56065cztM0_level2_quad_clean.evt |
| Size (bytes) | 1,106,619,840 | 274,400,640 |
| Size | 1.0 GB | 261.7 MB |
| Events in quadrant A | 10,297,398 | 1,765,431 |
| Events in quadrant B | 10,189,935 | 1,895,514 |
| Events in quadrant C | 8,748,016 | 1,703,473 |
| Events in quadrant D | 10,194,832 | 1,580,694 |
| Mode M0 | |||
|---|---|---|---|
| Quadrant | BADHDUFLAG | Total packets | Discarded packets |
| A | 0 | 45427 | 3 |
| B | 0 | 44647 | 3 |
| C | 0 | 41846 | 3 |
| D | 0 | 45348 | 3 |
| Mode SS | |||
|---|---|---|---|
| Quadrant | BADHDUFLAG | Total packets | Discarded packets |
| A | 0 | 406 | 0 |
| B | 0 | 406 | 0 |
| C | 0 | 406 | 0 |
| D | 0 | 406 | 0 |
| Mode M9 | |||
|---|---|---|---|
| Quadrant | BADHDUFLAG | Total packets | Discarded packets |
| A | 0 | 12 | 0 |
| B | 0 | 12 | 0 |
| C | 0 | 12 | 0 |
| D | 0 | 12 | 0 |
| Quadrant | Total seconds | Saturated seconds | Saturation percentage |
|---|---|---|---|
| A | 19774 | 461 | 2.331344% |
| B | 19774 | 640 | 3.236573% |
| C | 19774 | 307 | 1.552544% |
| D | 19775 | 409 | 2.068268% |
Noise dominated data is calculated using 1-second bins in cleaned event files. If a bin has >2000 counts, and if more than 50% of those come from <1% of pixels, then it is considered to be noise-dominated and hence unusable.
| Quadrant | # 1 sec bins | Bins with >0 counts | Bins with >2000 counts | High rate bins dominated by noise | Noise dominated (total time) | Noise dominated (detector-on time) | Marked lightcurve |
|---|---|---|---|---|---|---|---|
| A | 21074 | 19775 | 178 | 178 | 0.84% | 0.90% | 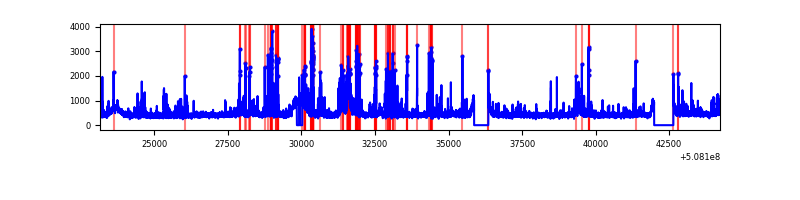 |
| B | 21074 | 19774 | 180 | 180 | 0.85% | 0.91% | 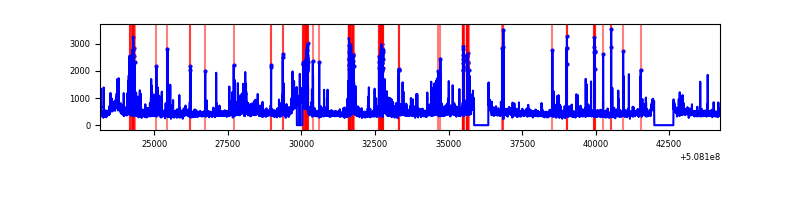 |
| C | 21074 | 19775 | 52 | 52 | 0.25% | 0.26% | 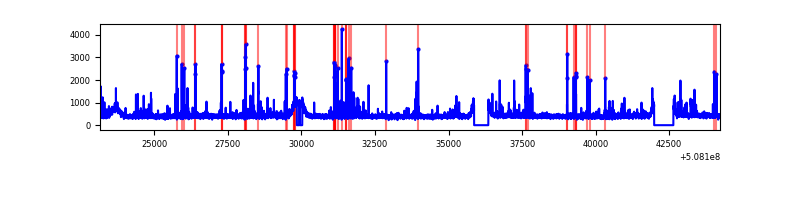 |
| D | 21075 | 19776 | 191 | 191 | 0.91% | 0.97% | 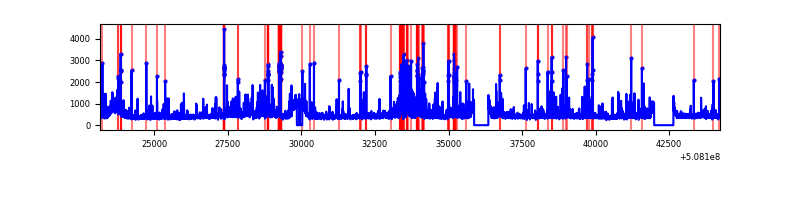 |
Top three noisy pixels from each quadrant. If the there are fewer than three noisy pixels in the level2.evt file, extra rows are filled as -1
| Pixel properties | Quadrant properties | ||||||
|---|---|---|---|---|---|---|---|
| Quadrant | DetID | PixID | Counts | Sigma | Mean | Median | Sigma |
| A | 12 | 115 | 896543 | 1707.94 | 2115 | 2058 | 523.7 |
| A | 15 | 32 | 445411 | 846.54 | 2115 | 2058 | 523.7 |
| A | 0 | 8 | 318396 | 604.02 | 2115 | 2058 | 523.7 |
| B | 2 | 249 | 398711 | 896.92 | 2087 | 2007 | 442.3 |
| B | 0 | 213 | 359716 | 808.75 | 2087 | 2007 | 442.3 |
| B | 10 | 247 | 243851 | 546.79 | 2087 | 2007 | 442.3 |
| C | 12 | 252 | 312604 | 553.5 | 2072 | 2047 | 561.1 |
| C | 6 | 223 | 182494 | 321.61 | 2072 | 2047 | 561.1 |
| C | 15 | 147 | 55789 | 95.78 | 2072 | 2047 | 561.1 |
| D | 11 | 129 | 469139 | 816.73 | 2051 | 1961 | 572.0 |
| D | 6 | 42 | 304769 | 529.38 | 2051 | 1961 | 572.0 |
| D | 2 | 249 | 301196 | 523.13 | 2051 | 1961 | 572.0 |
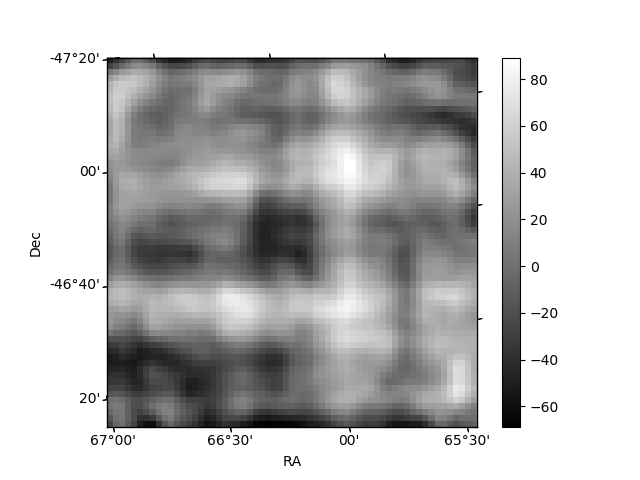
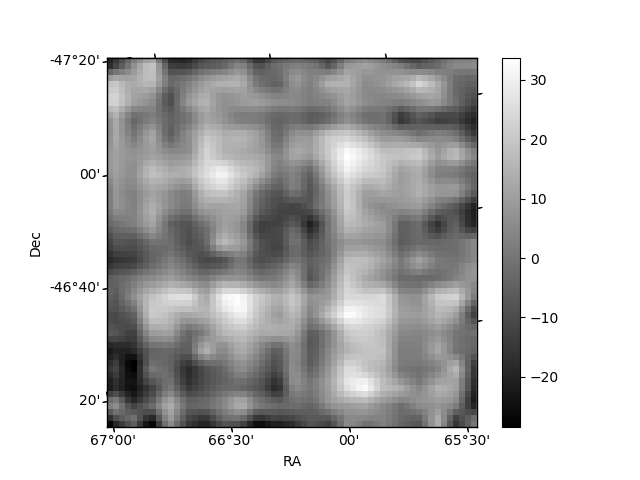
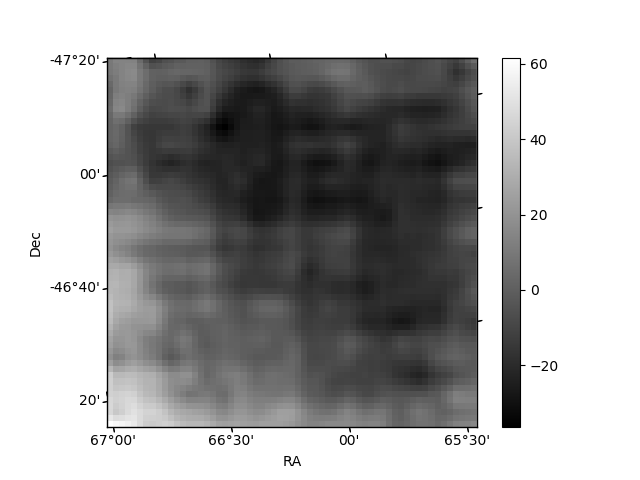
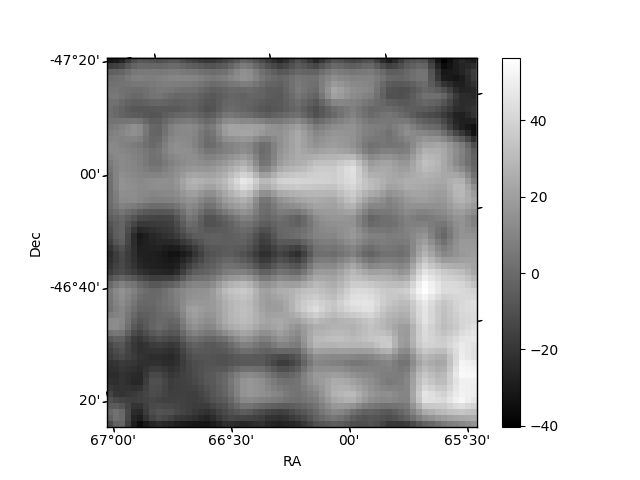
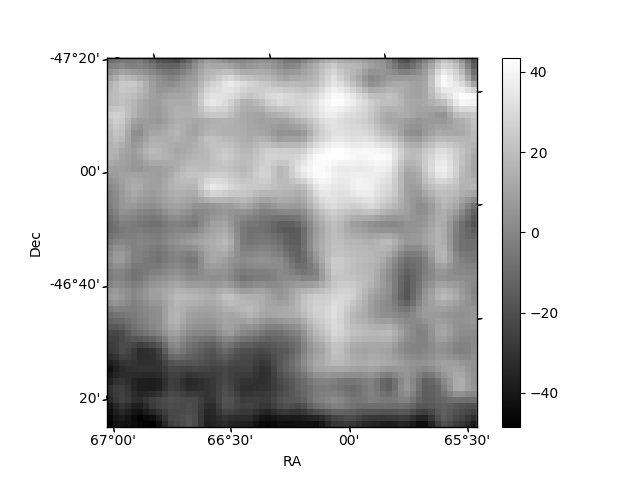
Histogram calculated using DETX and DETY for each event in the final _common_clean file
| Quadrant A | 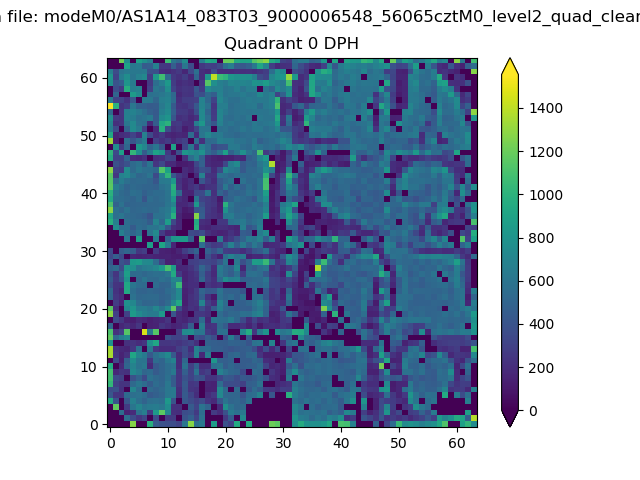 |
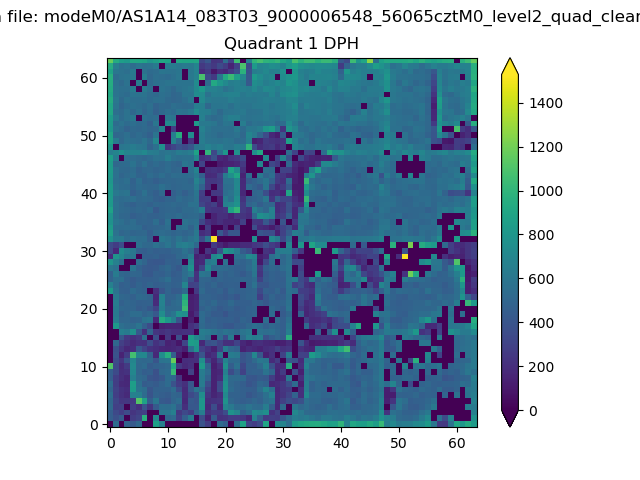 |
Quadrant B |
|---|---|---|---|
| Quadrant D | 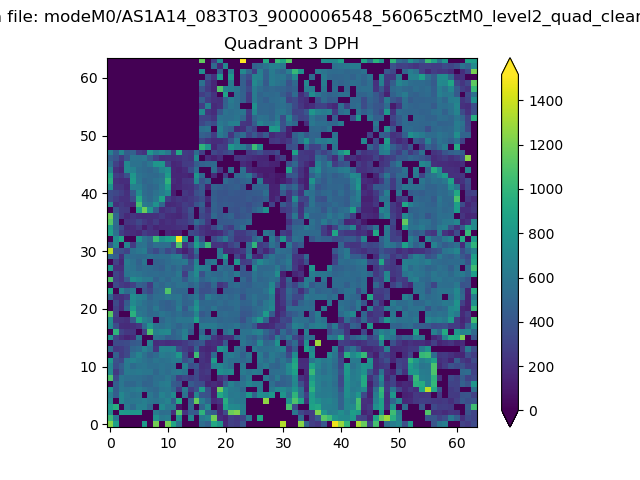 |
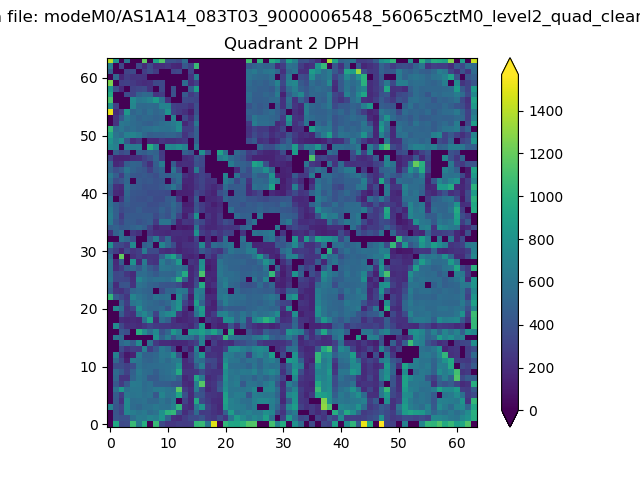 |
Quadrant C |
| Plot type | Count rate plots | Images |
|---|---|---|
| Comparison with Poisson distribution Blue bars denote a histogram of data divided into 1 sec bins. Red curve is a Poisson curve with rate = median count rate of data. |
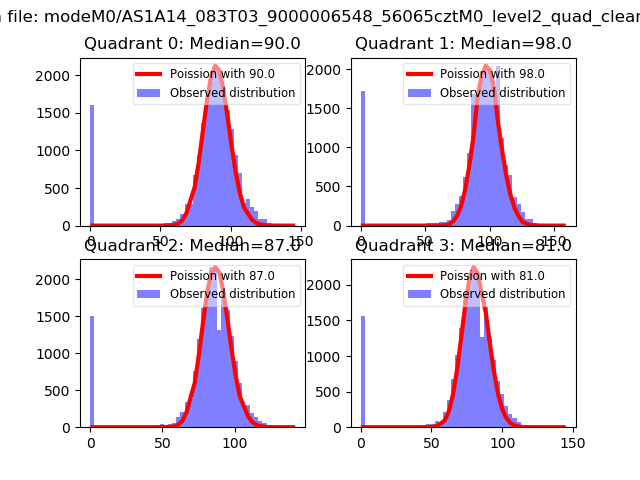 |
 |
| Quadrant-wise count rates Data is divided into 100 sec bins |
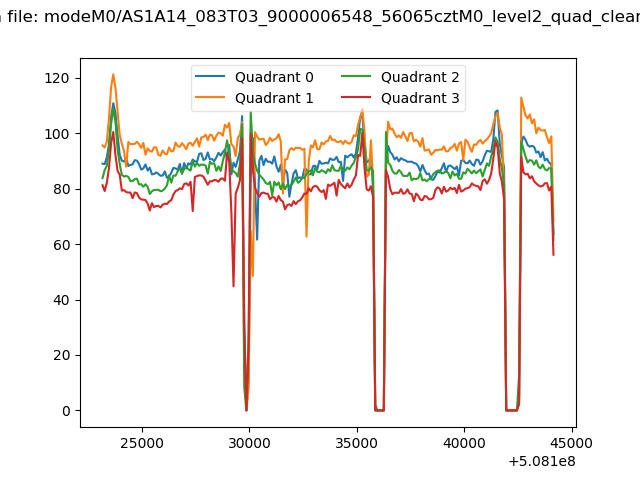 |
|
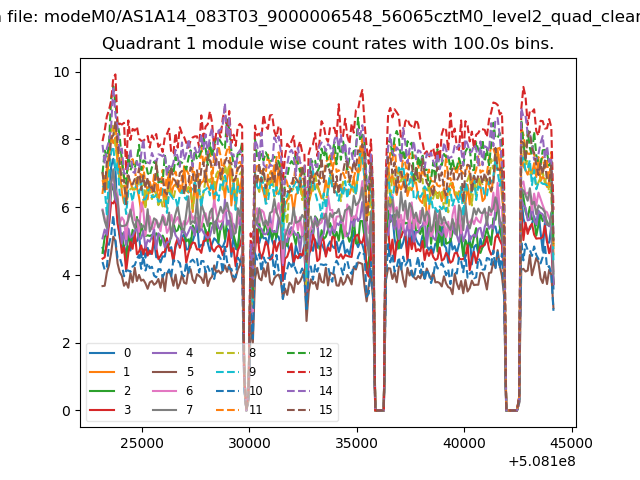
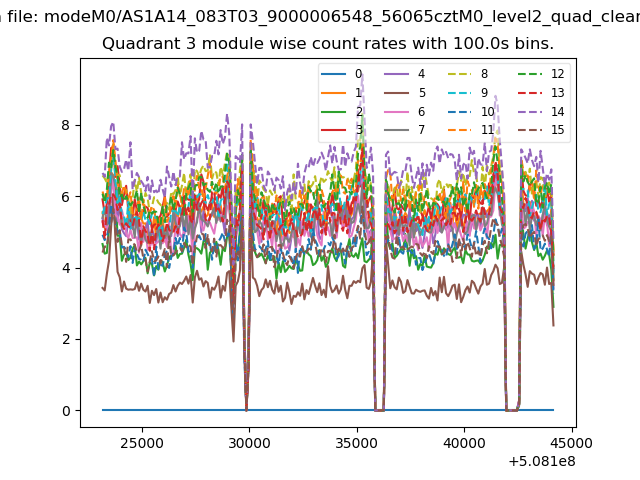
| Module-wise count rates for Quadrant A Data is divided into 100 sec bins |
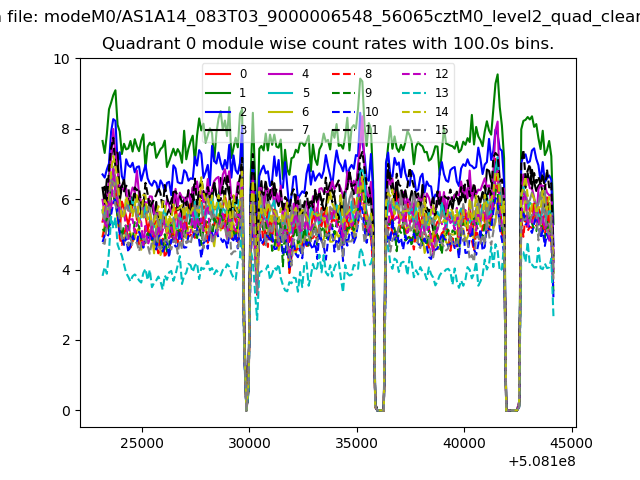 |
 |
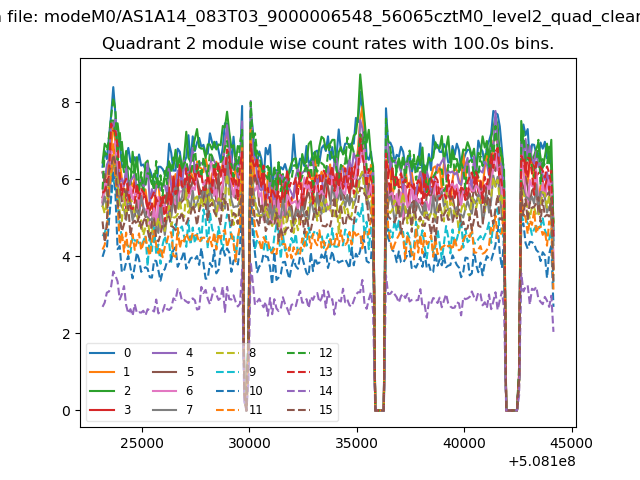
| Module-wise count rates for Quadrant B Data is divided into 100 sec bins |
 |
 |
| Module-wise count rates for Quadrant C Data is divided into 100 sec bins |
 |
 |
| Module-wise count rates for Quadrant D Data is divided into 100 sec bins |
 |
 |
| Parameter | Plot |
|---|---|
| CZT HV Monitor | 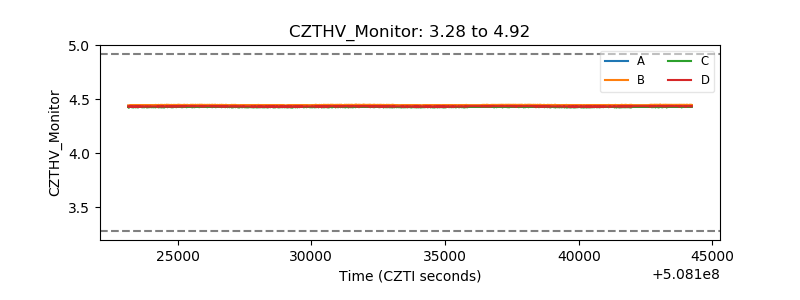 |
| D_VDD | 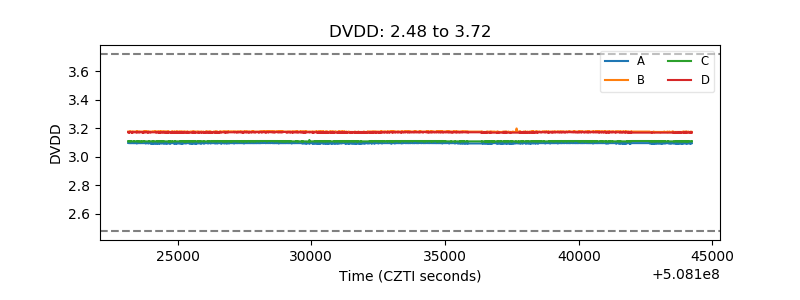 |
| Temperature 1 | 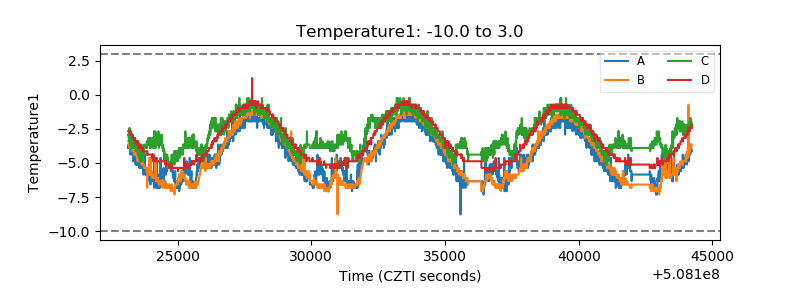 |
| Veto HV Monitor | 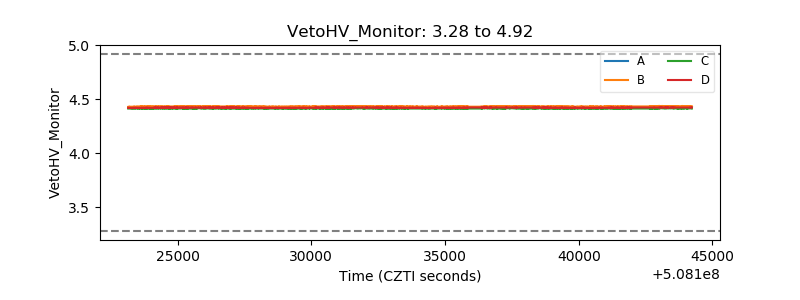 |
| Veto LLD | 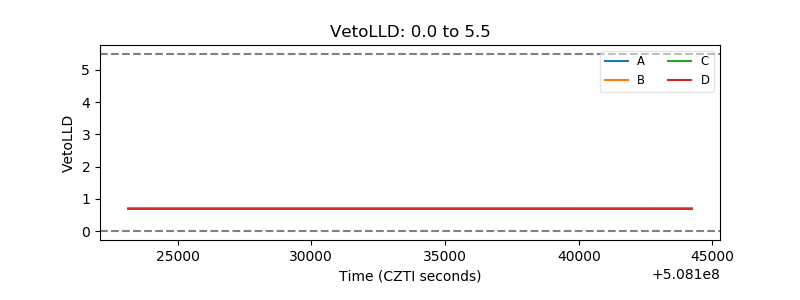 |
| Alpha Counter | 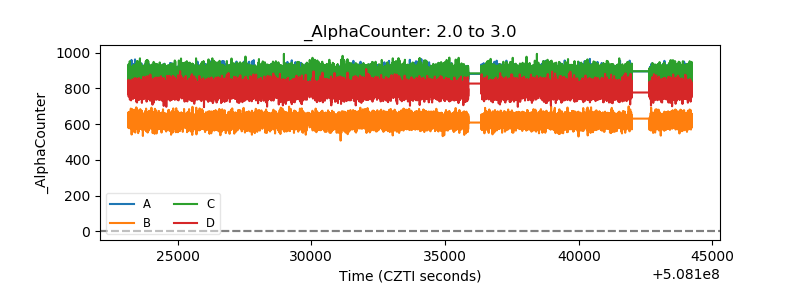 |
| _CPM_Rate | 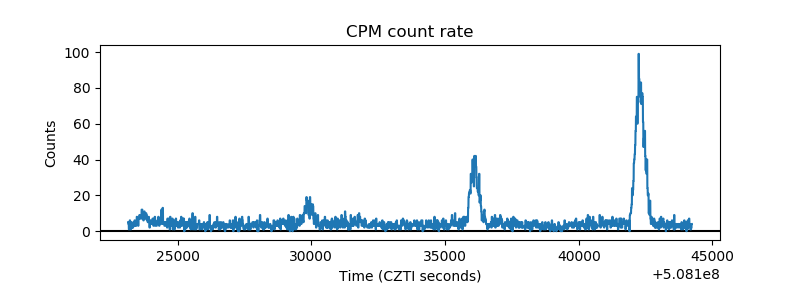 |
| CZT Counter | 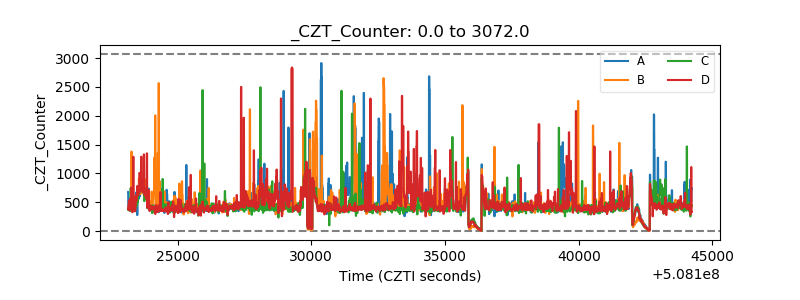 |
| +2.5 Volts monitor |  |
| +5 Volts monitor | 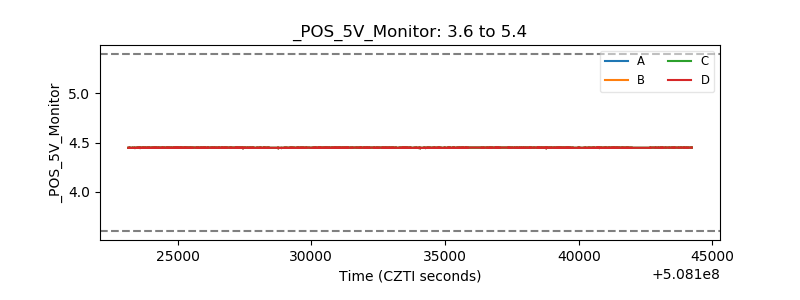 |
| _ROLL_ROT | 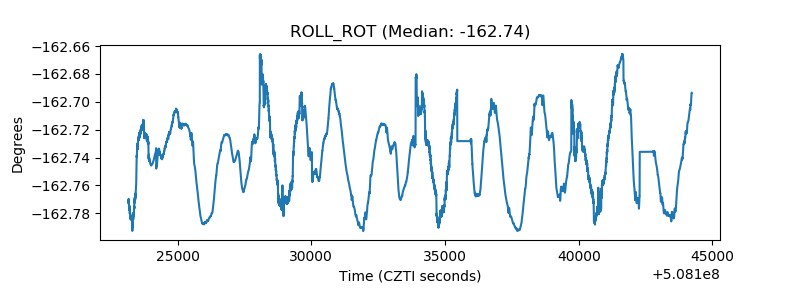 |
| _Roll_DEC | 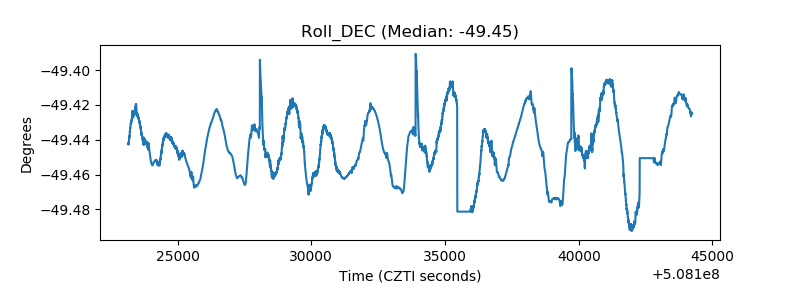 |
| _Roll_RA | 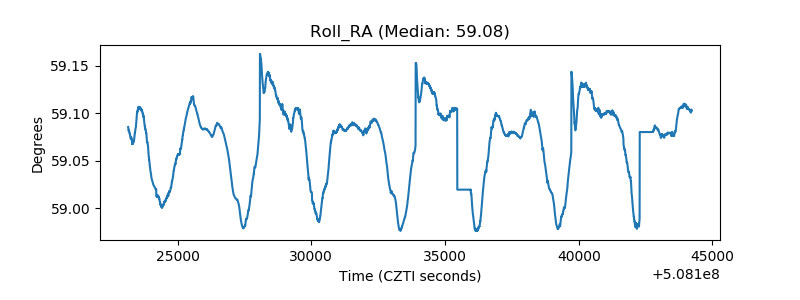 |
| Veto Counter | 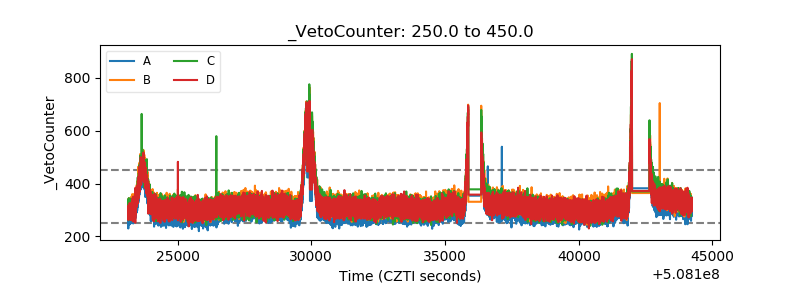 |