| Param | Original file | Final file |
|---|---|---|
| Filename | modeM0/AS1A14_083T03_9000006548_56066cztM0_level2.fits | modeM0/AS1A14_083T03_9000006548_56066cztM0_level2_quad_clean.evt |
| Size (bytes) | 384,742,080 | 97,133,760 |
| Size | 366.9 MB | 92.6 MB |
| Events in quadrant A | 4,111,532 | 610,976 |
| Events in quadrant B | 3,055,850 | 681,279 |
| Events in quadrant C | 3,296,621 | 604,155 |
| Events in quadrant D | 3,248,025 | 570,645 |
| Mode M0 | |||
|---|---|---|---|
| Quadrant | BADHDUFLAG | Total packets | Discarded packets |
| A | 0 | 17002 | 1 |
| B | 0 | 14055 | 1 |
| C | 0 | 15163 | 1 |
| D | 0 | 14630 | 1 |
| Mode SS | |||
|---|---|---|---|
| Quadrant | BADHDUFLAG | Total packets | Discarded packets |
| A | 0 | 138 | 0 |
| B | 0 | 138 | 0 |
| C | 0 | 138 | 0 |
| D | 0 | 138 | 0 |
| Mode M9 | |||
|---|---|---|---|
| Quadrant | BADHDUFLAG | Total packets | Discarded packets |
| A | 0 | 8 | 0 |
| B | 0 | 8 | 0 |
| C | 0 | 8 | 0 |
| D | 0 | 8 | 0 |
| Quadrant | Total seconds | Saturated seconds | Saturation percentage |
|---|---|---|---|
| A | 6803 | 328 | 4.821402% |
| B | 6803 | 85 | 1.249449% |
| C | 6803 | 160 | 2.351904% |
| D | 6803 | 68 | 0.999559% |
Noise dominated data is calculated using 1-second bins in cleaned event files. If a bin has >2000 counts, and if more than 50% of those come from <1% of pixels, then it is considered to be noise-dominated and hence unusable.
| Quadrant | # 1 sec bins | Bins with >0 counts | Bins with >2000 counts | High rate bins dominated by noise | Noise dominated (total time) | Noise dominated (detector-on time) | Marked lightcurve |
|---|---|---|---|---|---|---|---|
| A | 7628 | 6803 | 207 | 207 | 2.71% | 3.04% | 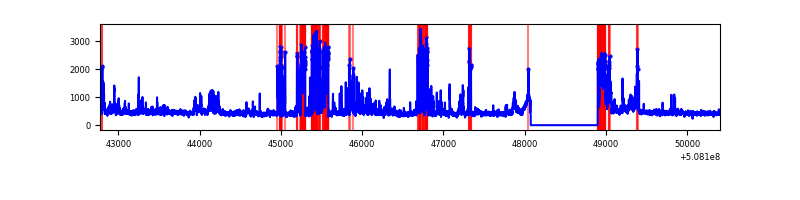 |
| B | 7628 | 6803 | 6 | 6 | 0.08% | 0.09% | 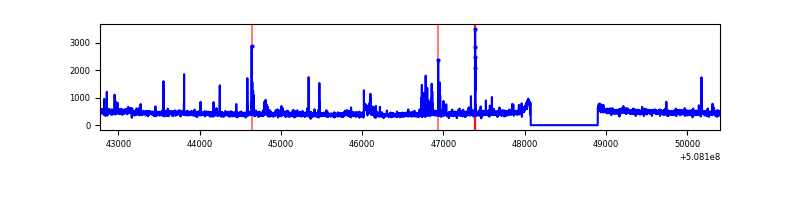 |
| C | 7628 | 6803 | 85 | 85 | 1.11% | 1.25% | 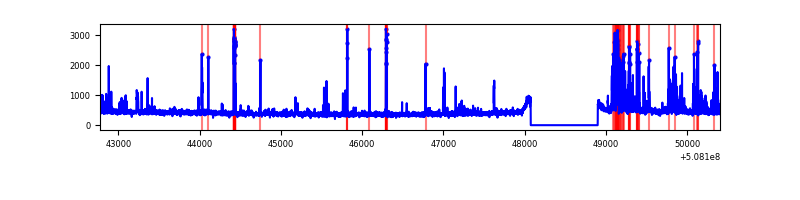 |
| D | 7628 | 6803 | 23 | 23 | 0.30% | 0.34% | 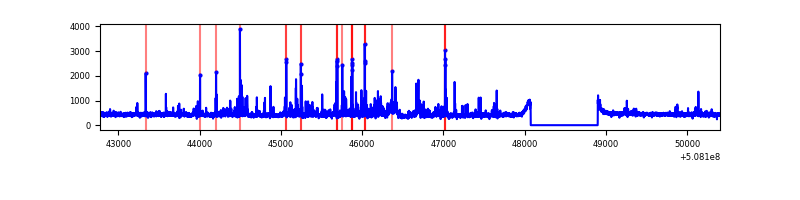 |
Top three noisy pixels from each quadrant. If the there are fewer than three noisy pixels in the level2.evt file, extra rows are filled as -1
| Pixel properties | Quadrant properties | ||||||
|---|---|---|---|---|---|---|---|
| Quadrant | DetID | PixID | Counts | Sigma | Mean | Median | Sigma |
| A | 15 | 32 | 766907 | 4368.56 | 710 | 692 | 175.4 |
| A | 12 | 115 | 460012 | 2618.81 | 710 | 692 | 175.4 |
| A | 4 | 249 | 34864 | 194.83 | 710 | 692 | 175.4 |
| B | 10 | 247 | 110305 | 718.59 | 715 | 687 | 152.5 |
| B | 0 | 213 | 36053 | 231.84 | 715 | 687 | 152.5 |
| B | 9 | 254 | 23450 | 149.22 | 715 | 687 | 152.5 |
| C | 13 | 3 | 281574 | 1456.46 | 703 | 692 | 192.9 |
| C | 6 | 223 | 95701 | 492.65 | 703 | 692 | 192.9 |
| C | 12 | 252 | 64230 | 329.46 | 703 | 692 | 192.9 |
| D | 2 | 120 | 119419 | 592.68 | 703 | 671 | 200.4 |
| D | 6 | 239 | 83996 | 415.88 | 703 | 671 | 200.4 |
| D | 8 | 240 | 72347 | 357.74 | 703 | 671 | 200.4 |
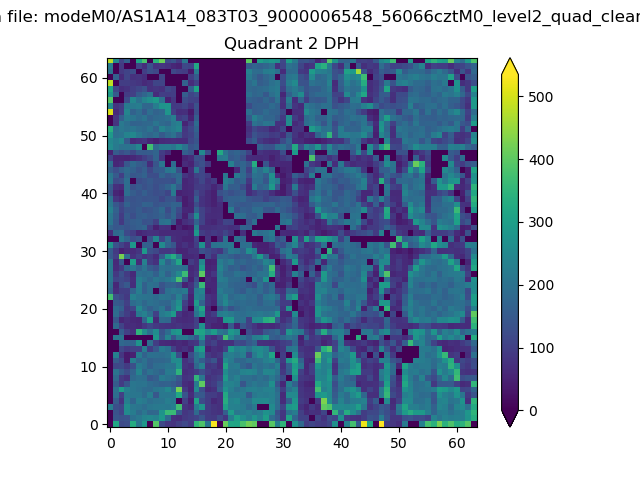
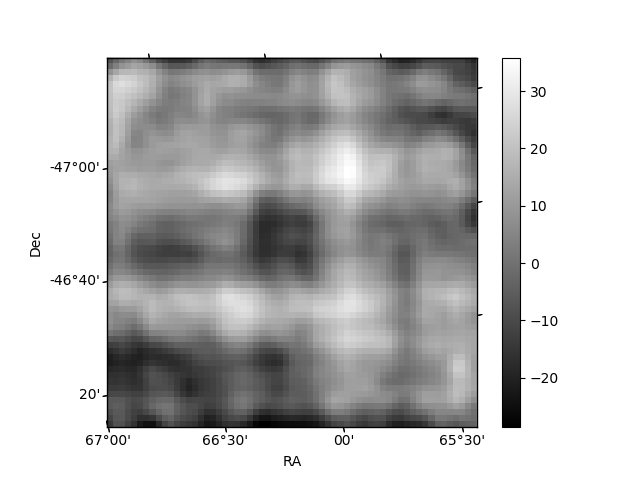
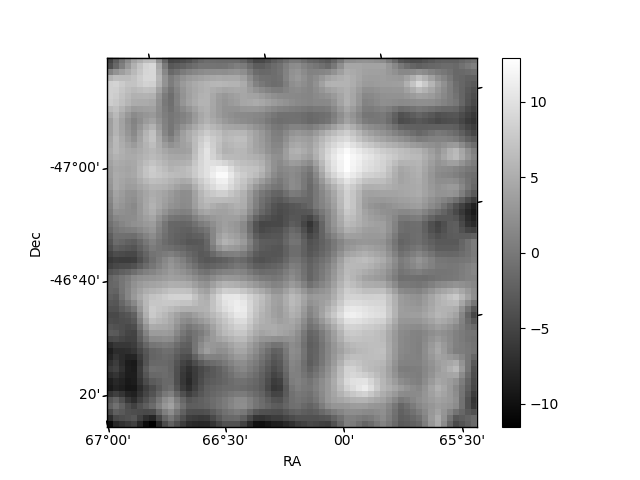
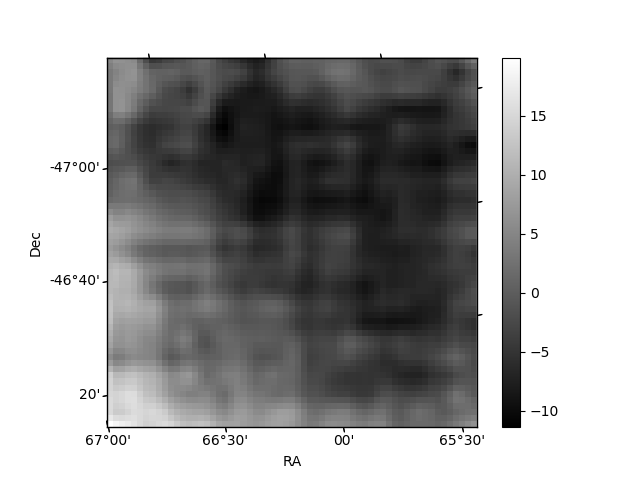
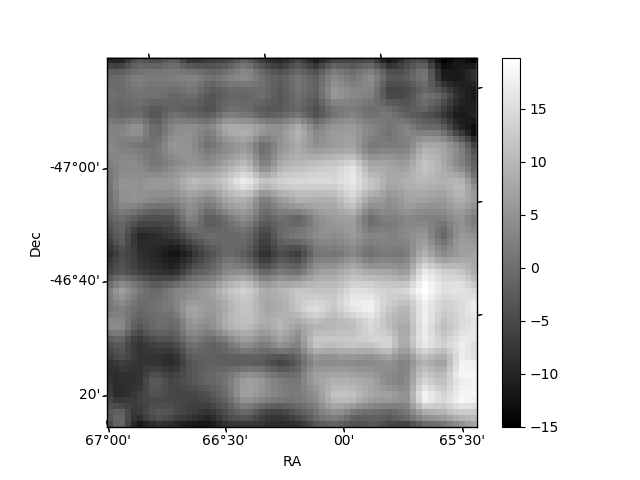
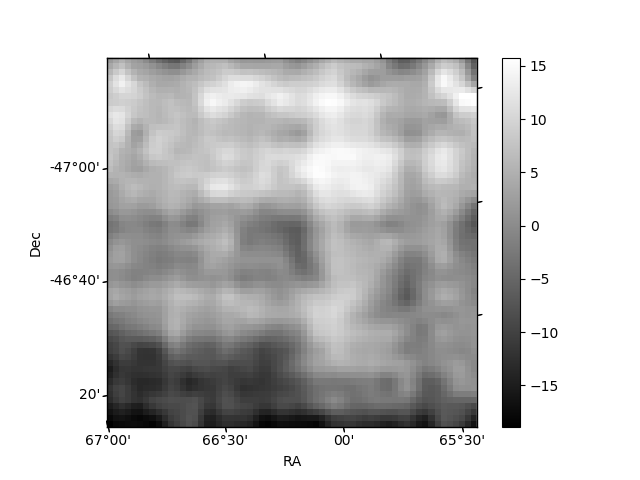
Histogram calculated using DETX and DETY for each event in the final _common_clean file
| Quadrant A | 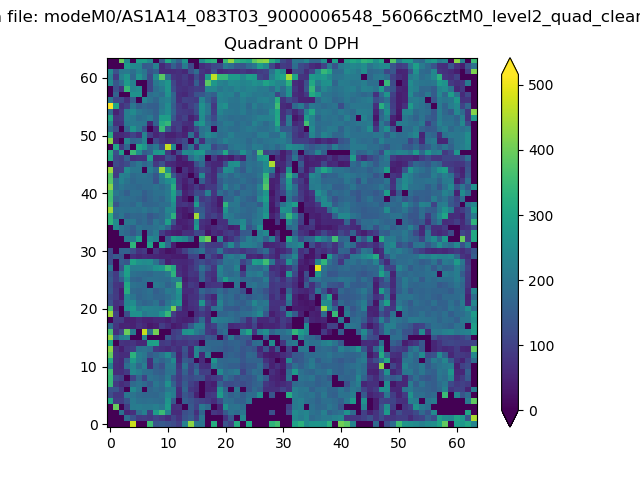 |
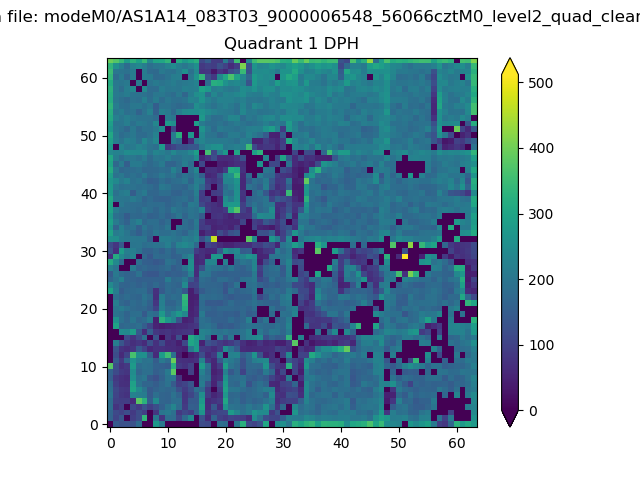 |
Quadrant B |
|---|---|---|---|
| Quadrant D | 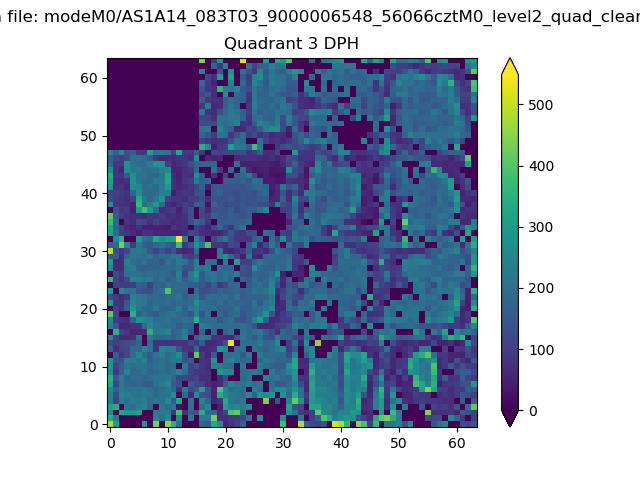 |
 |
Quadrant C |
| Plot type | Count rate plots | Images |
|---|---|---|
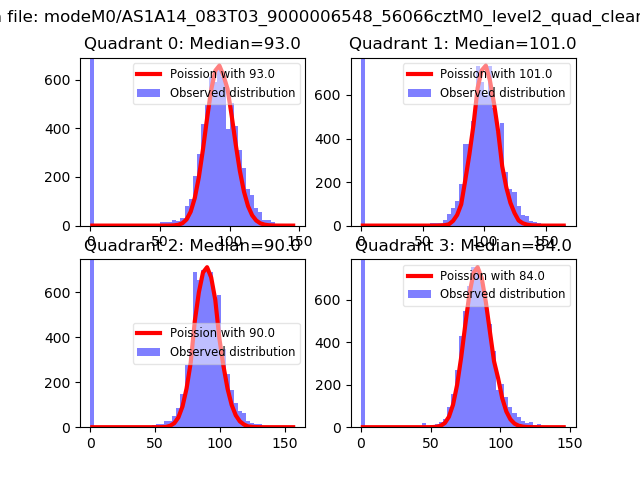
| Comparison with Poisson distribution Blue bars denote a histogram of data divided into 1 sec bins. Red curve is a Poisson curve with rate = median count rate of data. |
 |
 |
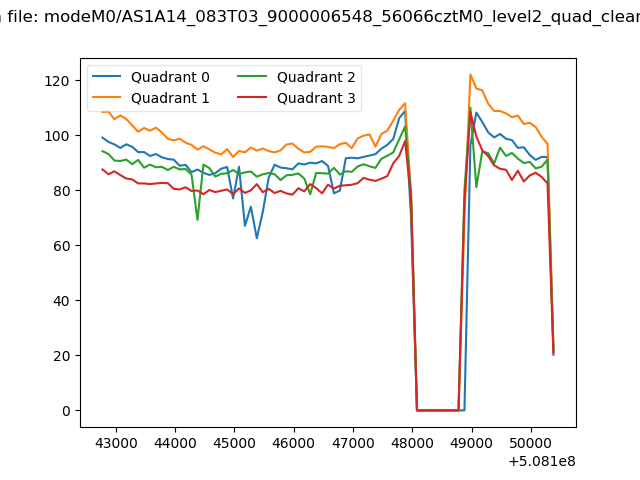
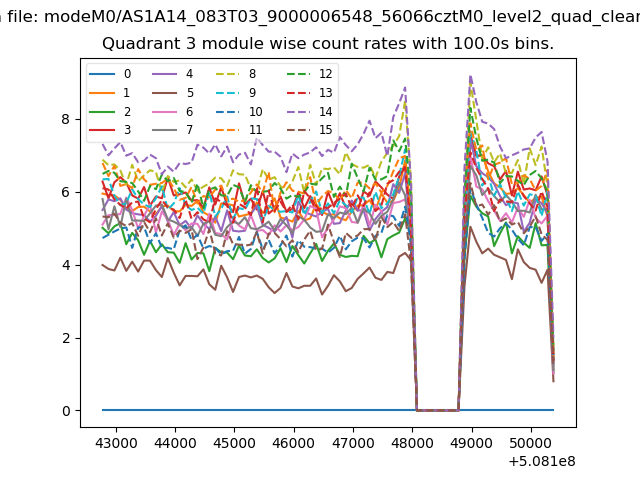
| Quadrant-wise count rates Data is divided into 100 sec bins |
 |
|
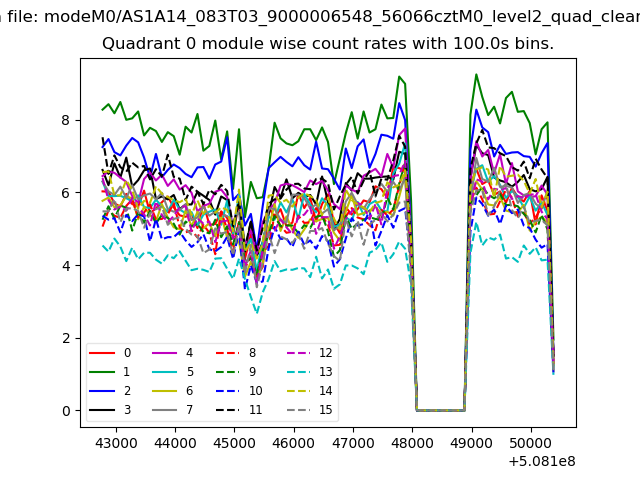
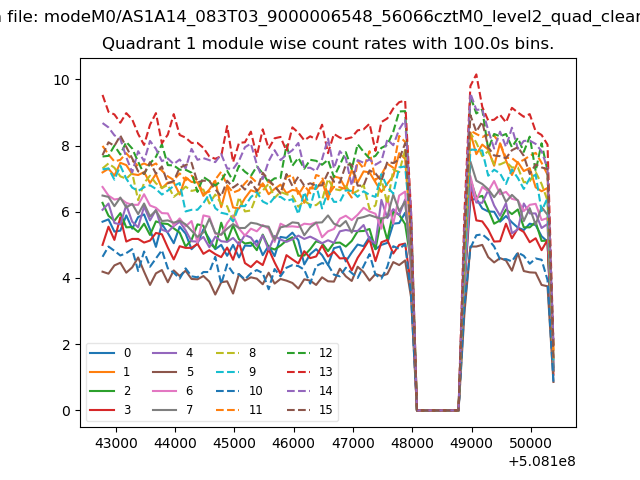
| Module-wise count rates for Quadrant A Data is divided into 100 sec bins |
 |
 |
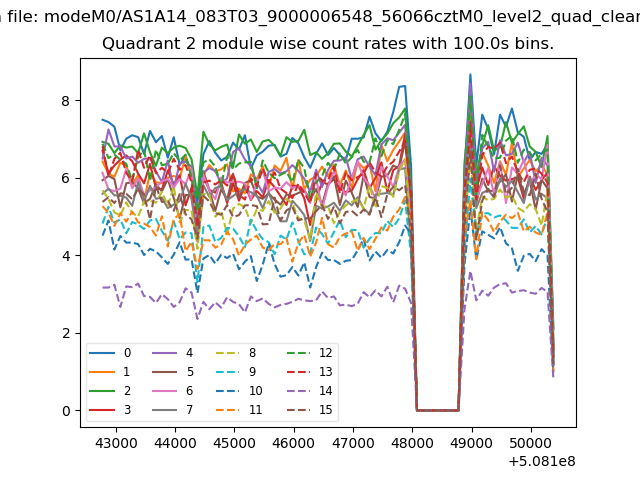
| Module-wise count rates for Quadrant B Data is divided into 100 sec bins |
 |
 |
| Module-wise count rates for Quadrant C Data is divided into 100 sec bins |
 |
 |
| Module-wise count rates for Quadrant D Data is divided into 100 sec bins |
 |
 |
| Parameter | Plot |
|---|---|
| CZT HV Monitor |  |
| D_VDD | 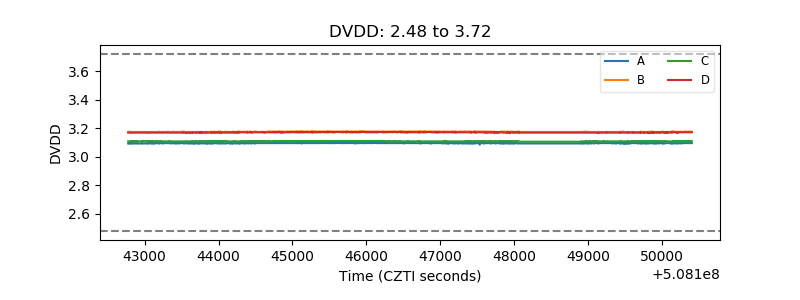 |
| Temperature 1 | 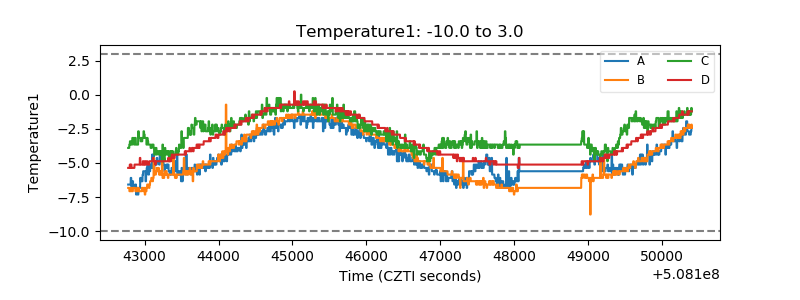 |
| Veto HV Monitor | 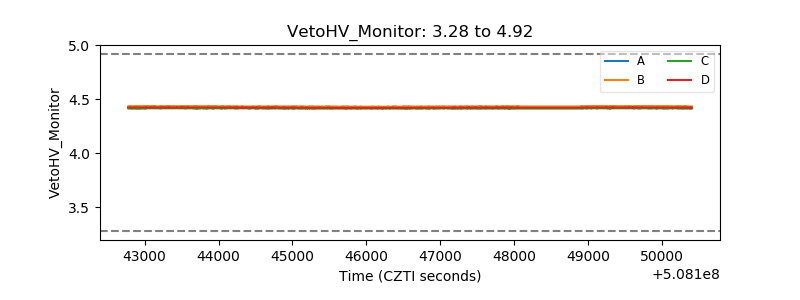 |
| Veto LLD | 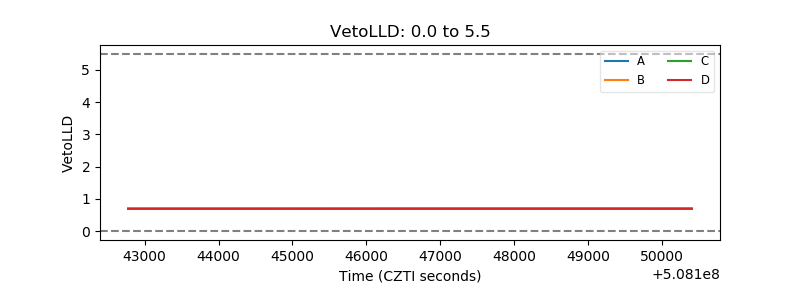 |
| Alpha Counter | 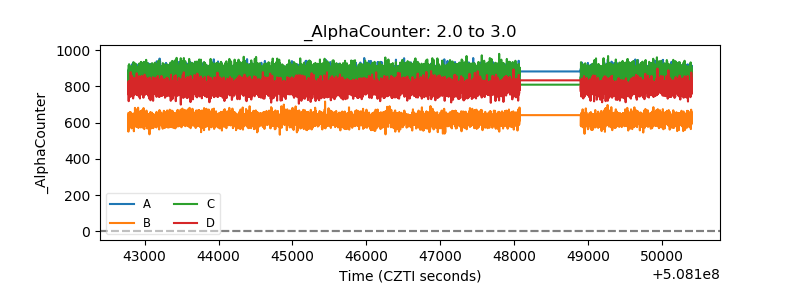 |
| _CPM_Rate | 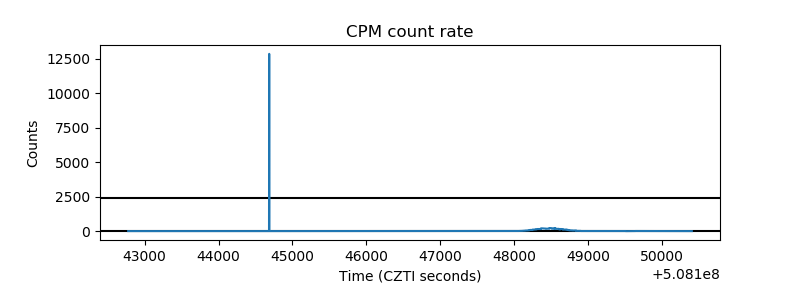 |
| CZT Counter | 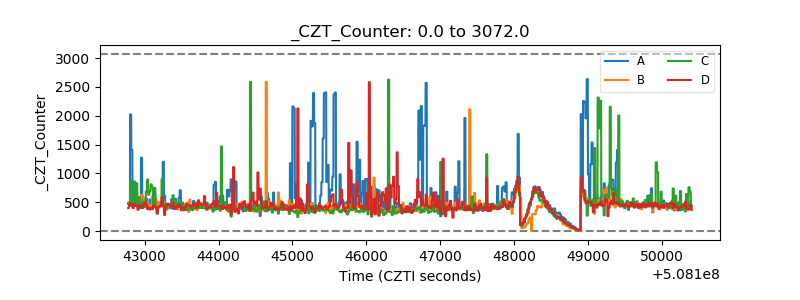 |
| +2.5 Volts monitor | 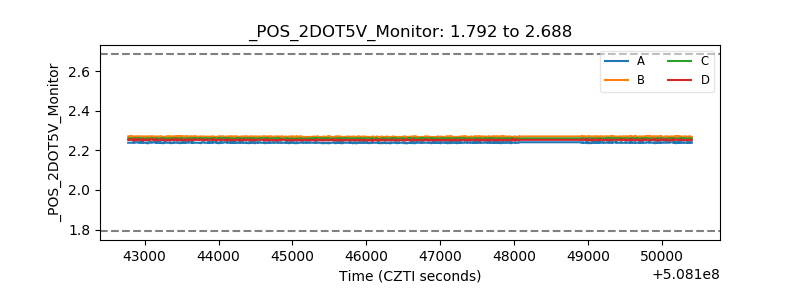 |
| +5 Volts monitor | 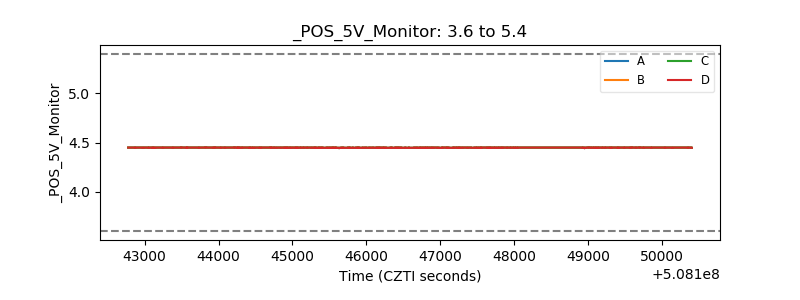 |
| _ROLL_ROT | 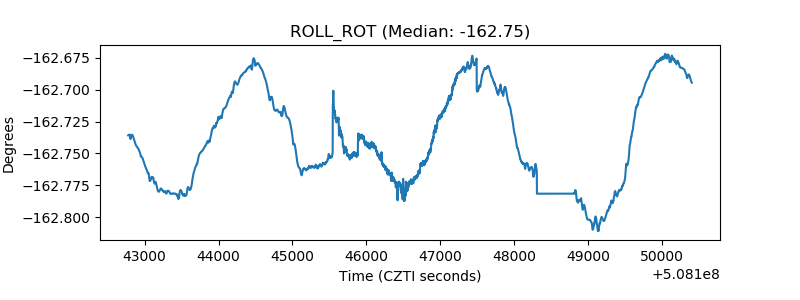 |
| _Roll_DEC | 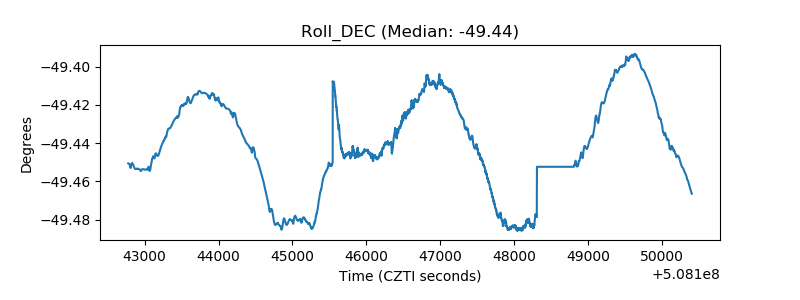 |
| _Roll_RA | 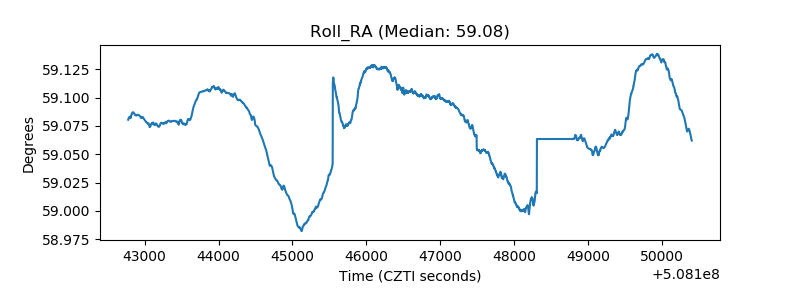 |
| Veto Counter | 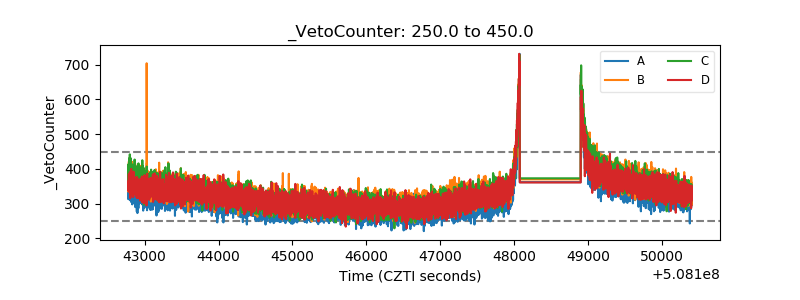 |