| Param | Original file | Final file |
|---|---|---|
| Filename | modeM0/AS1A14_083T03_9000006548_56068cztM0_level2.fits | modeM0/AS1A14_083T03_9000006548_56068cztM0_level2_quad_clean.evt |
| Size (bytes) | 422,115,840 | 97,096,320 |
| Size | 402.6 MB | 92.6 MB |
| Events in quadrant A | 4,337,212 | 621,841 |
| Events in quadrant B | 3,108,271 | 686,846 |
| Events in quadrant C | 3,786,788 | 602,793 |
| Events in quadrant D | 3,869,401 | 559,563 |
| Mode M0 | |||
|---|---|---|---|
| Quadrant | BADHDUFLAG | Total packets | Discarded packets |
| A | 0 | 17415 | 2 |
| B | 0 | 14015 | 2 |
| C | 0 | 16310 | 2 |
| D | 0 | 16361 | 2 |
| Mode SS | |||
|---|---|---|---|
| Quadrant | BADHDUFLAG | Total packets | Discarded packets |
| A | 0 | 136 | 0 |
| B | 0 | 136 | 0 |
| C | 0 | 136 | 0 |
| D | 0 | 136 | 0 |
| Mode M9 | |||
|---|---|---|---|
| Quadrant | BADHDUFLAG | Total packets | Discarded packets |
| A | 0 | 10 | 0 |
| B | 0 | 11 | 0 |
| C | 0 | 11 | 0 |
| D | 0 | 11 | 0 |
| Quadrant | Total seconds | Saturated seconds | Saturation percentage |
|---|---|---|---|
| A | 6728 | 285 | 4.236029% |
| B | 6728 | 119 | 1.768728% |
| C | 6728 | 270 | 4.013080% |
| D | 6728 | 275 | 4.087396% |
Noise dominated data is calculated using 1-second bins in cleaned event files. If a bin has >2000 counts, and if more than 50% of those come from <1% of pixels, then it is considered to be noise-dominated and hence unusable.
| Quadrant | # 1 sec bins | Bins with >0 counts | Bins with >2000 counts | High rate bins dominated by noise | Noise dominated (total time) | Noise dominated (detector-on time) | Marked lightcurve |
|---|---|---|---|---|---|---|---|
| A | 7683 | 6728 | 184 | 184 | 2.39% | 2.73% | 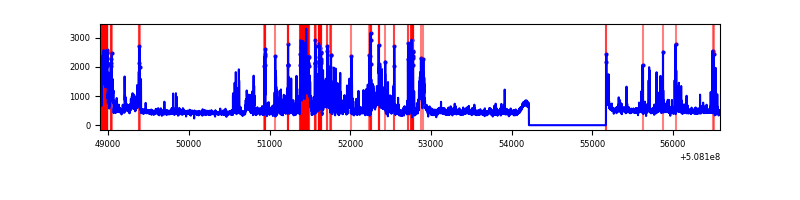 |
| B | 7683 | 6728 | 4 | 4 | 0.05% | 0.06% | 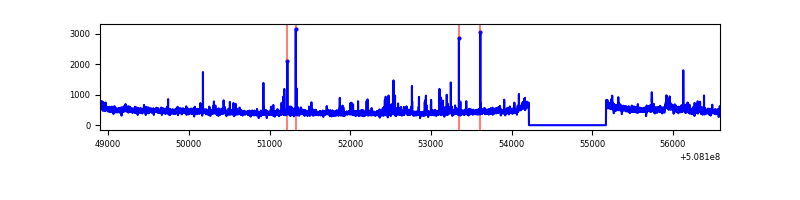 |
| C | 7683 | 6728 | 155 | 155 | 2.02% | 2.30% | 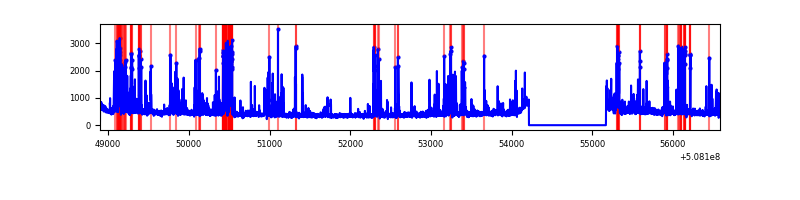 |
| D | 7683 | 6728 | 142 | 142 | 1.85% | 2.11% | 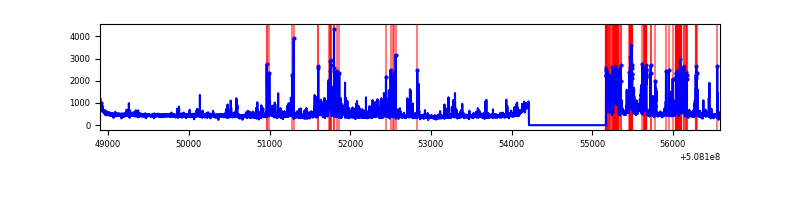 |
Top three noisy pixels from each quadrant. If the there are fewer than three noisy pixels in the level2.evt file, extra rows are filled as -1
| Pixel properties | Quadrant properties | ||||||
|---|---|---|---|---|---|---|---|
| Quadrant | DetID | PixID | Counts | Sigma | Mean | Median | Sigma |
| A | 12 | 115 | 499763 | 2807.88 | 719 | 698 | 177.7 |
| A | 15 | 32 | 496269 | 2788.22 | 719 | 698 | 177.7 |
| A | 4 | 249 | 306657 | 1721.41 | 719 | 698 | 177.7 |
| B | 10 | 247 | 63622 | 411.8 | 721 | 694 | 152.8 |
| B | 9 | 254 | 63057 | 408.1 | 721 | 694 | 152.8 |
| B | 0 | 213 | 31848 | 203.87 | 721 | 694 | 152.8 |
| C | 13 | 3 | 824160 | 4249.69 | 703 | 693 | 193.8 |
| C | 6 | 223 | 122029 | 626.18 | 703 | 693 | 193.8 |
| C | 12 | 252 | 58457 | 298.1 | 703 | 693 | 193.8 |
| D | 11 | 129 | 539148 | 2737.29 | 699 | 668 | 196.7 |
| D | 6 | 42 | 136632 | 691.16 | 699 | 668 | 196.7 |
| D | 2 | 120 | 126141 | 637.83 | 699 | 668 | 196.7 |
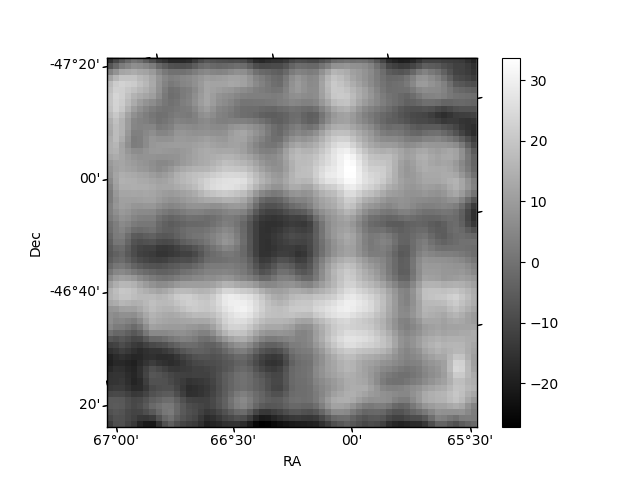
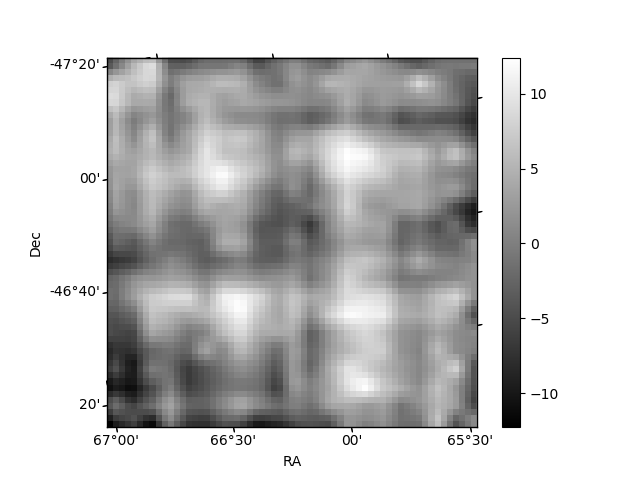
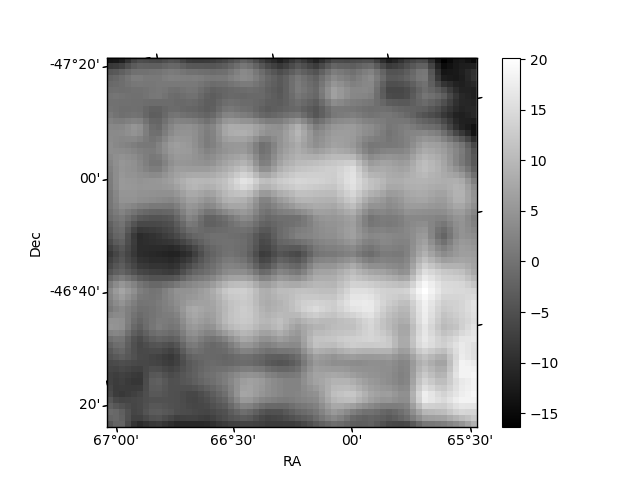
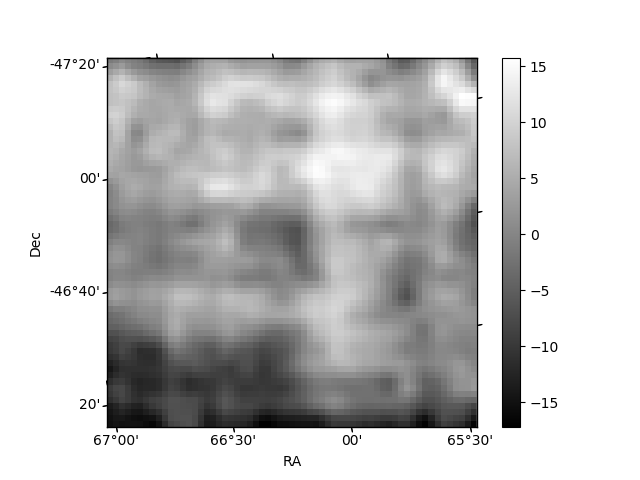
Histogram calculated using DETX and DETY for each event in the final _common_clean file
| Quadrant A | 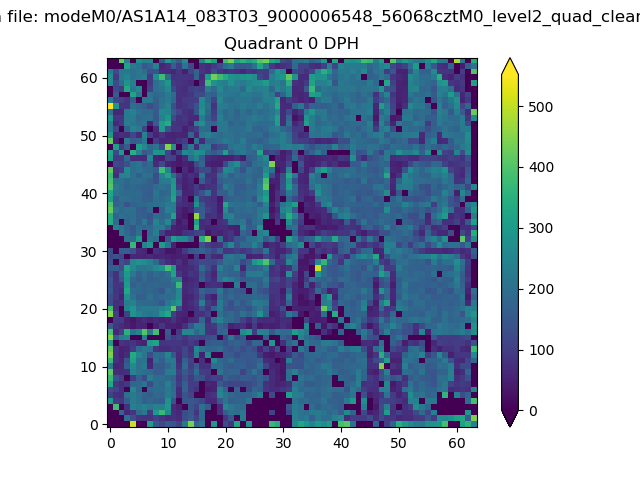 |
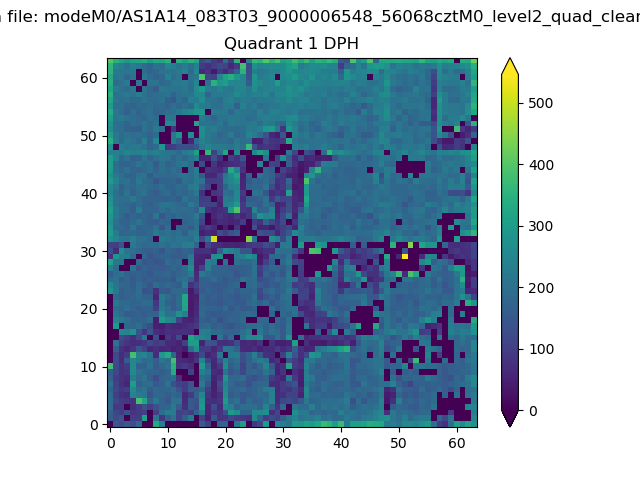 |
Quadrant B |
|---|---|---|---|
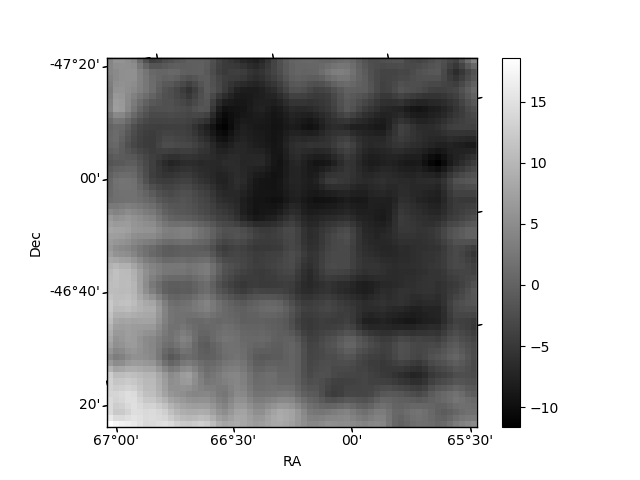
| Quadrant D | 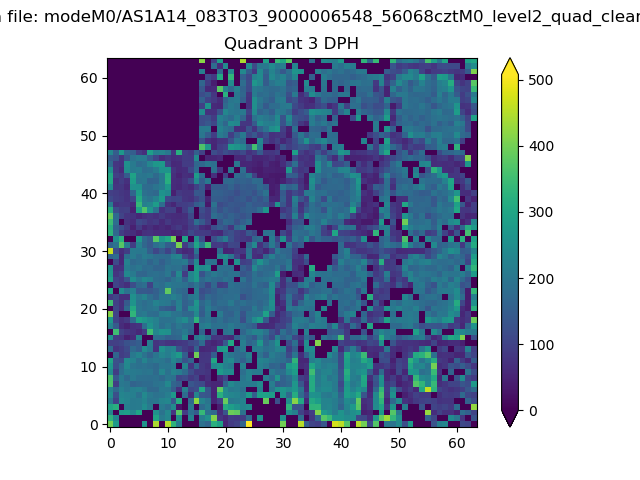 |
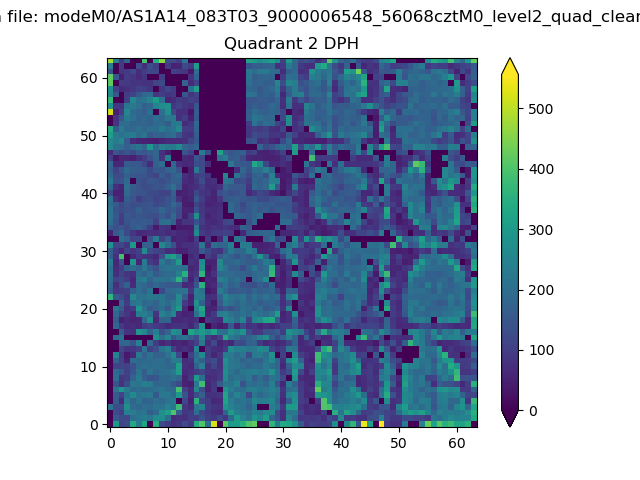 |
Quadrant C |
| Plot type | Count rate plots | Images |
|---|---|---|
| Comparison with Poisson distribution Blue bars denote a histogram of data divided into 1 sec bins. Red curve is a Poisson curve with rate = median count rate of data. |
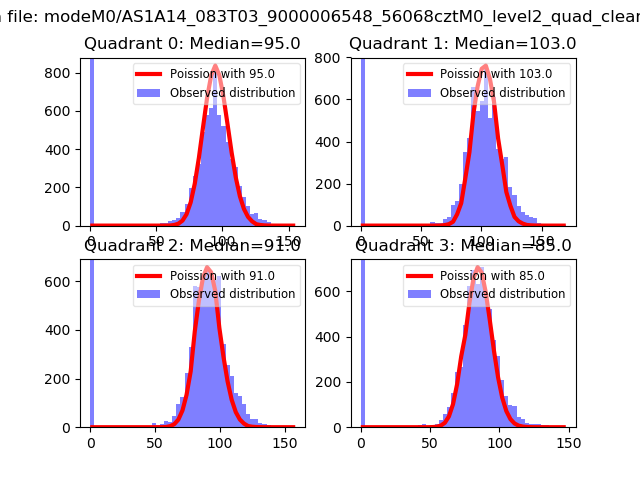 |
 |
| Quadrant-wise count rates Data is divided into 100 sec bins |
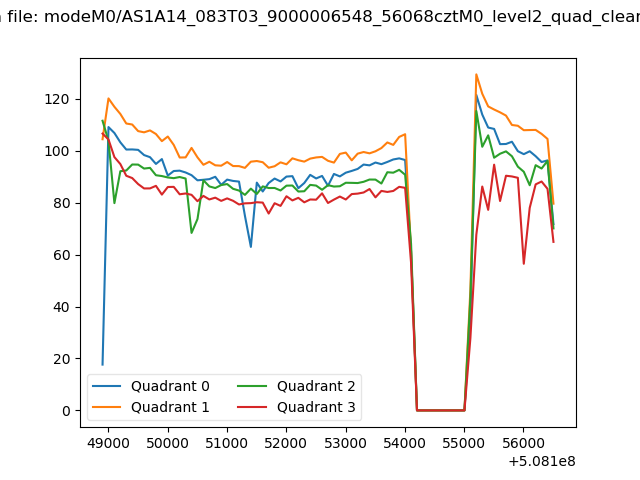 |
|
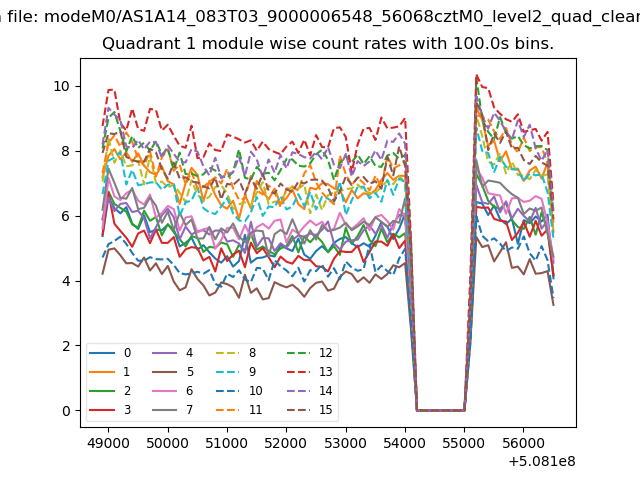
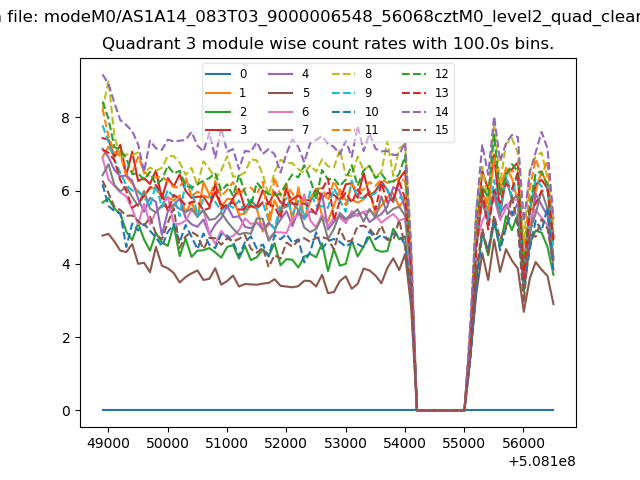
| Module-wise count rates for Quadrant A Data is divided into 100 sec bins |
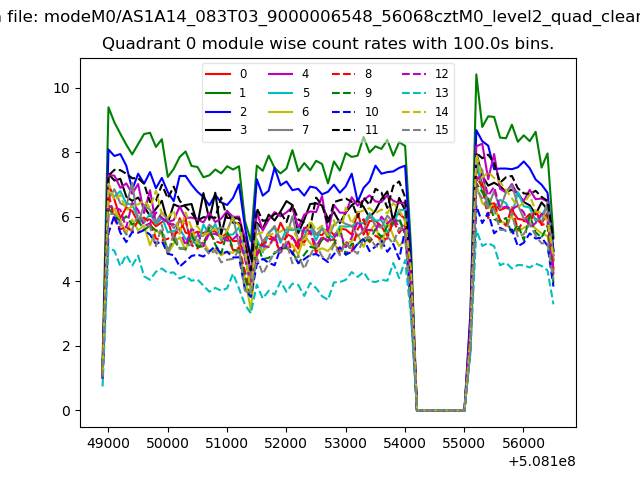 |
 |
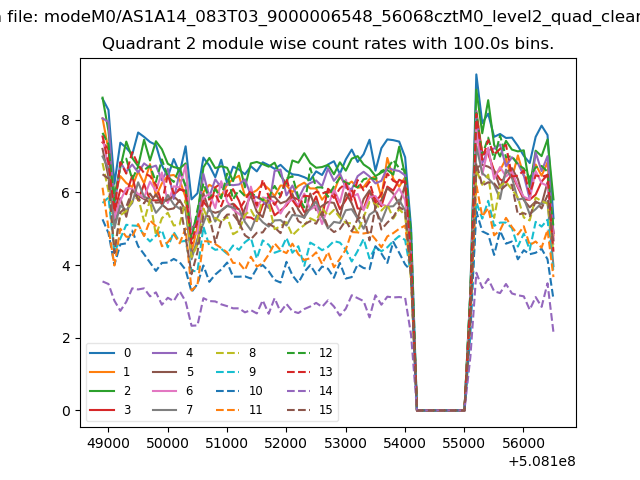
| Module-wise count rates for Quadrant B Data is divided into 100 sec bins |
 |
 |
| Module-wise count rates for Quadrant C Data is divided into 100 sec bins |
 |
 |
| Module-wise count rates for Quadrant D Data is divided into 100 sec bins |
 |
 |
| Parameter | Plot |
|---|---|
| CZT HV Monitor | 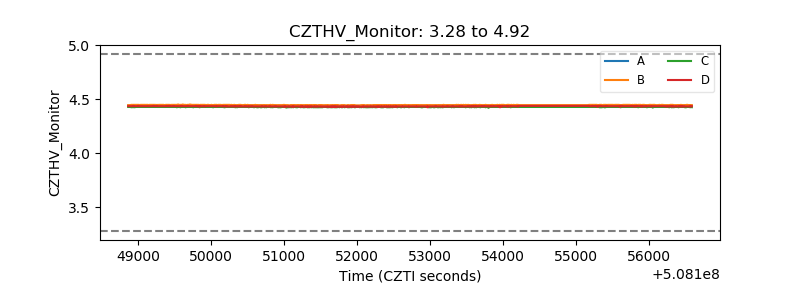 |
| D_VDD | 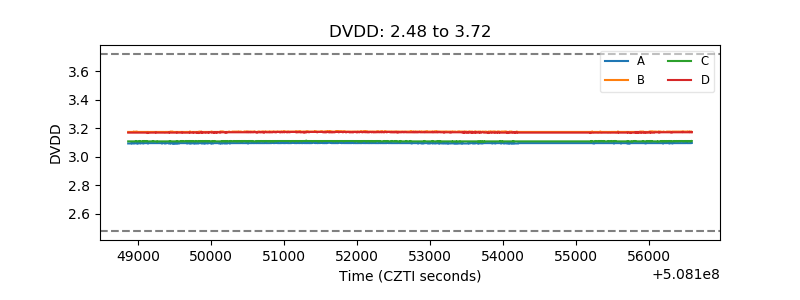 |
| Temperature 1 | 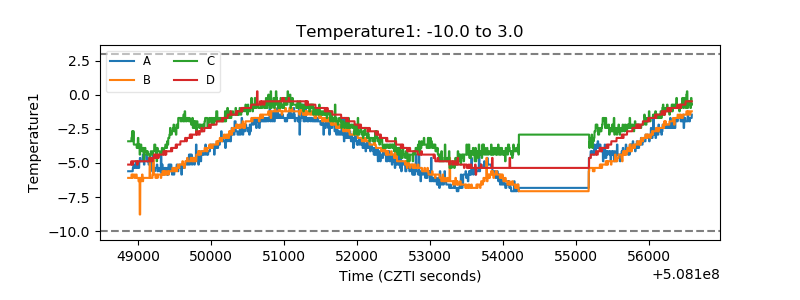 |
| Veto HV Monitor | 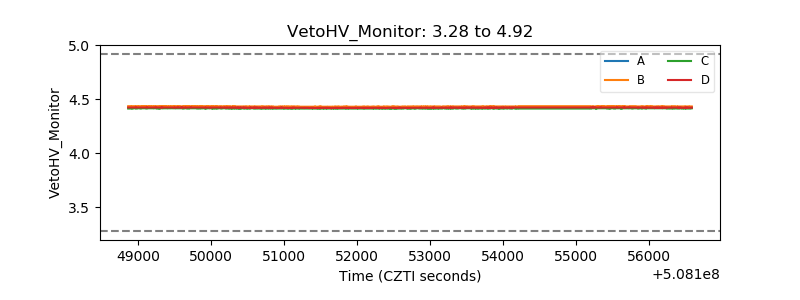 |
| Veto LLD | 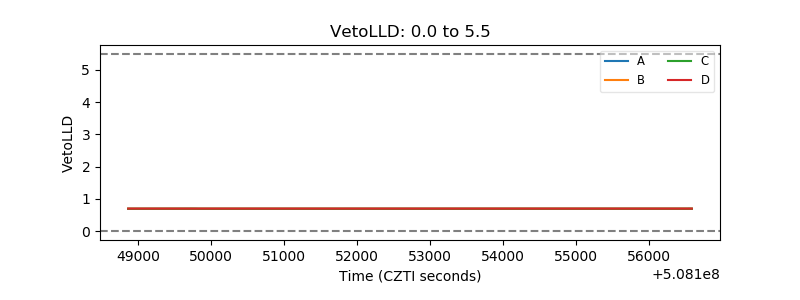 |
| Alpha Counter | 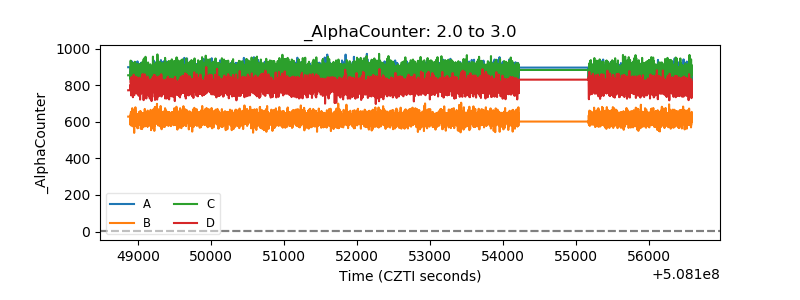 |
| _CPM_Rate | 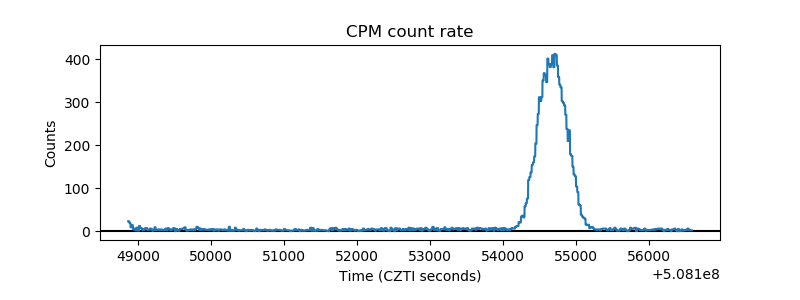 |
| CZT Counter | 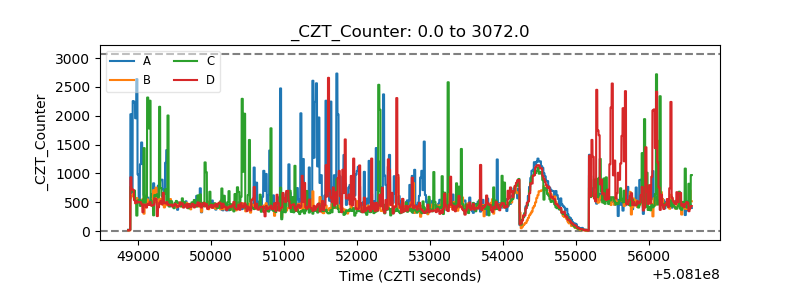 |
| +2.5 Volts monitor |  |
| +5 Volts monitor |  |
| _ROLL_ROT | 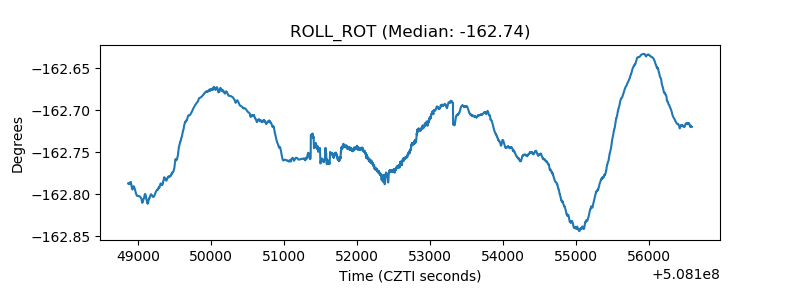 |
| _Roll_DEC | 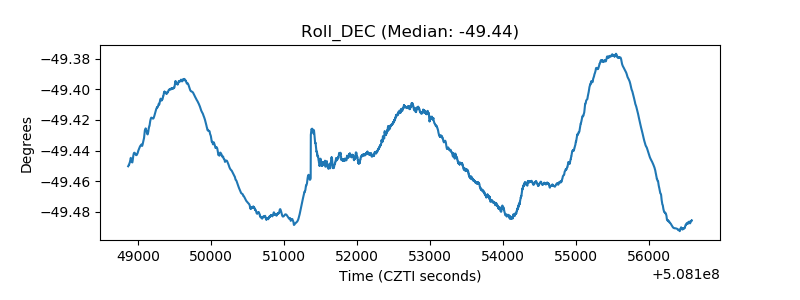 |
| _Roll_RA | 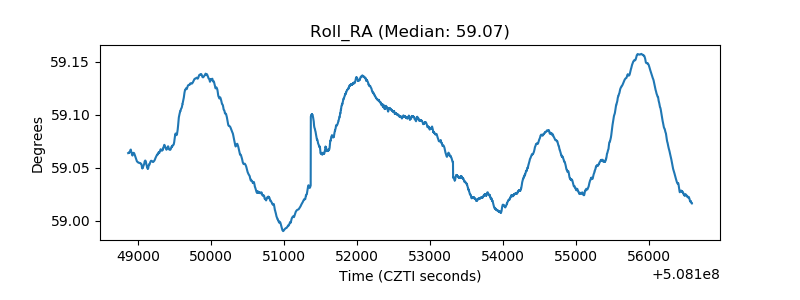 |
| Veto Counter | 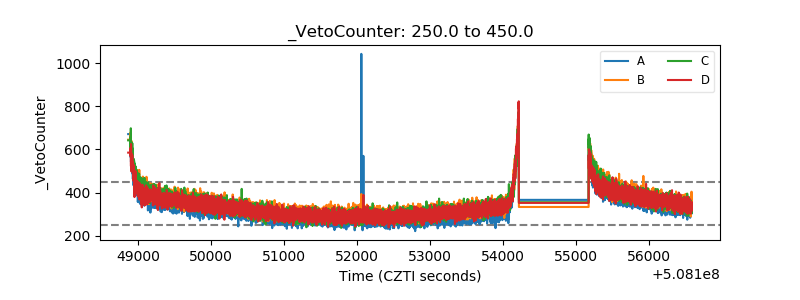 |