| Param | Original file | Final file |
|---|---|---|
| Filename | modeM0/AS1A14_083T03_9000006548_56069cztM0_level2.fits | modeM0/AS1A14_083T03_9000006548_56069cztM0_level2_quad_clean.evt |
| Size (bytes) | 416,963,520 | 100,578,240 |
| Size | 397.6 MB | 95.9 MB |
| Events in quadrant A | 4,034,169 | 656,742 |
| Events in quadrant B | 3,344,020 | 713,407 |
| Events in quadrant C | 3,963,538 | 623,924 |
| Events in quadrant D | 3,563,292 | 577,132 |
| Mode M0 | |||
|---|---|---|---|
| Quadrant | BADHDUFLAG | Total packets | Discarded packets |
| A | 0 | 16655 | 2 |
| B | 0 | 14559 | 2 |
| C | 0 | 16744 | 2 |
| D | 0 | 15742 | 2 |
| Mode SS | |||
|---|---|---|---|
| Quadrant | BADHDUFLAG | Total packets | Discarded packets |
| A | 0 | 138 | 0 |
| B | 0 | 138 | 0 |
| C | 0 | 138 | 0 |
| D | 0 | 138 | 0 |
| Mode M9 | |||
|---|---|---|---|
| Quadrant | BADHDUFLAG | Total packets | Discarded packets |
| A | 0 | 11 | 0 |
| B | 0 | 11 | 0 |
| C | 0 | 11 | 0 |
| D | 0 | 11 | 0 |
| Quadrant | Total seconds | Saturated seconds | Saturation percentage |
|---|---|---|---|
| A | 6805 | 136 | 1.998530% |
| B | 6806 | 101 | 1.483985% |
| C | 6806 | 209 | 3.070820% |
| D | 6806 | 230 | 3.379371% |
Noise dominated data is calculated using 1-second bins in cleaned event files. If a bin has >2000 counts, and if more than 50% of those come from <1% of pixels, then it is considered to be noise-dominated and hence unusable.
| Quadrant | # 1 sec bins | Bins with >0 counts | Bins with >2000 counts | High rate bins dominated by noise | Noise dominated (total time) | Noise dominated (detector-on time) | Marked lightcurve |
|---|---|---|---|---|---|---|---|
| A | 7895 | 6805 | 80 | 80 | 1.01% | 1.18% | 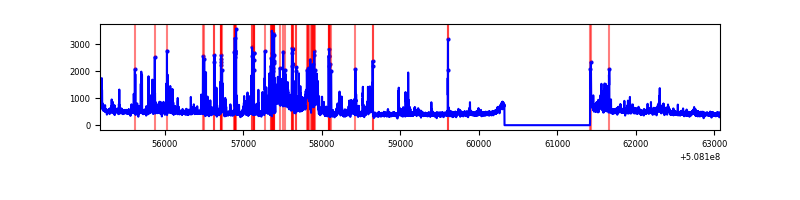 |
| B | 7896 | 6806 | 33 | 33 | 0.42% | 0.48% | 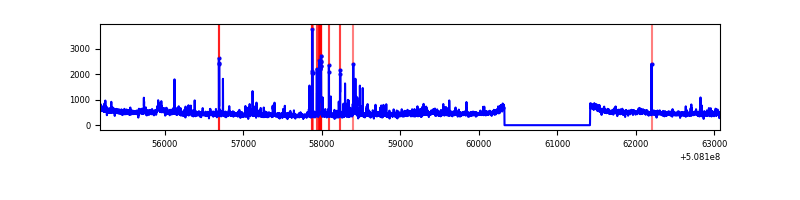 |
| C | 7896 | 6806 | 157 | 157 | 1.99% | 2.31% | 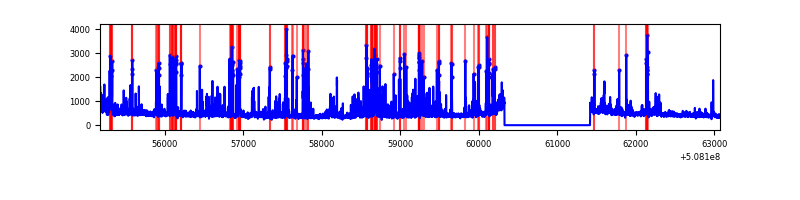 |
| D | 7896 | 6806 | 137 | 137 | 1.74% | 2.01% | 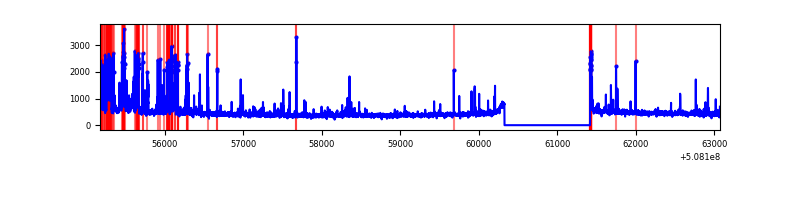 |
Top three noisy pixels from each quadrant. If the there are fewer than three noisy pixels in the level2.evt file, extra rows are filled as -1
| Pixel properties | Quadrant properties | ||||||
|---|---|---|---|---|---|---|---|
| Quadrant | DetID | PixID | Counts | Sigma | Mean | Median | Sigma |
| A | 12 | 115 | 418237 | 2295.93 | 739 | 722 | 181.8 |
| A | 15 | 32 | 352275 | 1933.2 | 739 | 722 | 181.8 |
| A | 0 | 8 | 241197 | 1322.38 | 739 | 722 | 181.8 |
| B | 9 | 254 | 115942 | 741.38 | 731 | 707 | 155.4 |
| B | 0 | 171 | 105188 | 672.19 | 731 | 707 | 155.4 |
| B | 10 | 247 | 67119 | 427.27 | 731 | 707 | 155.4 |
| C | 13 | 3 | 763120 | 3932.9 | 707 | 700 | 193.9 |
| C | 12 | 249 | 82250 | 420.67 | 707 | 700 | 193.9 |
| C | 15 | 147 | 76673 | 391.9 | 707 | 700 | 193.9 |
| D | 11 | 129 | 506908 | 2537.94 | 705 | 673 | 199.5 |
| D | 2 | 120 | 102141 | 508.7 | 705 | 673 | 199.5 |
| D | 5 | 173 | 57120 | 282.99 | 705 | 673 | 199.5 |
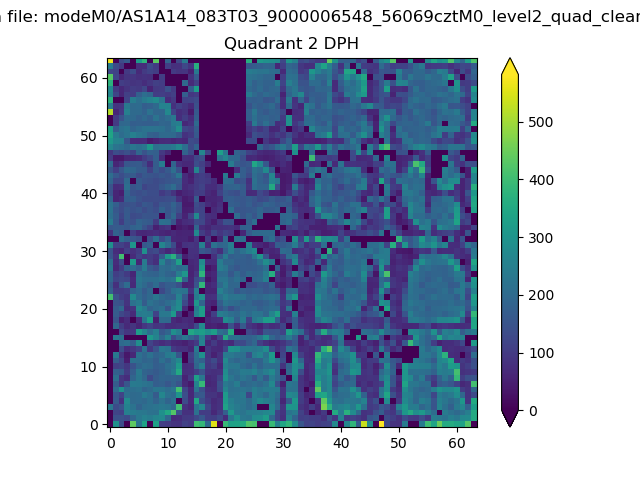
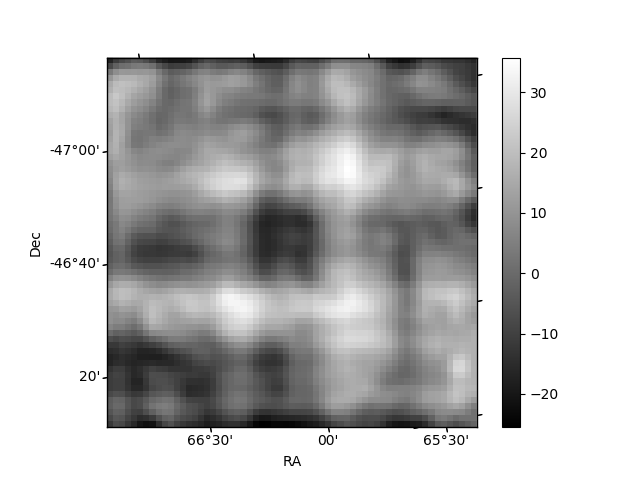
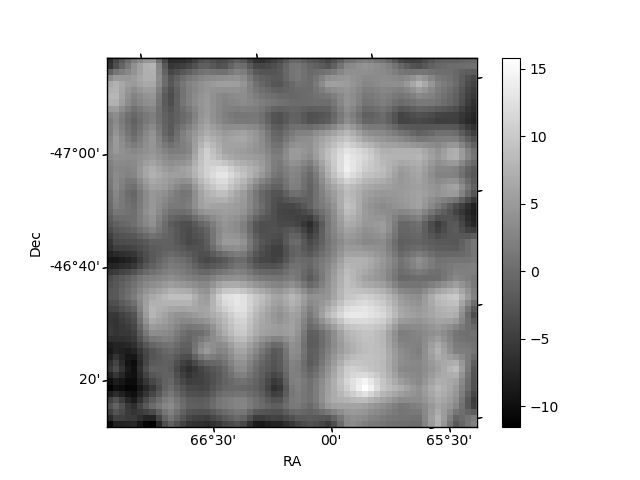
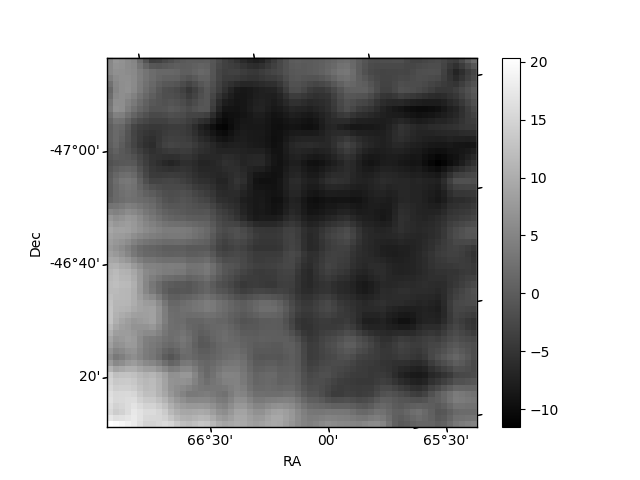
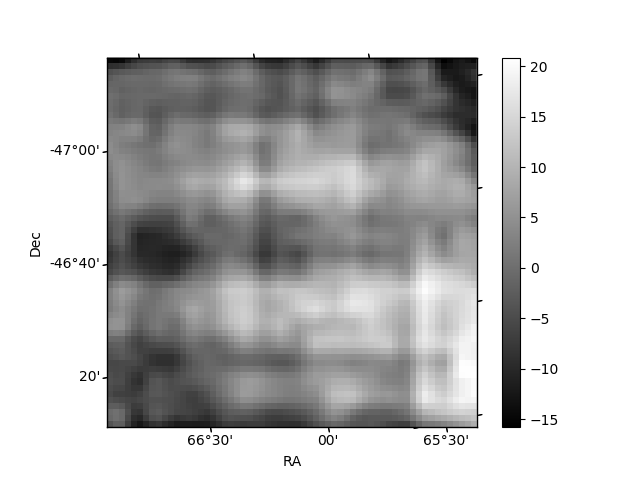
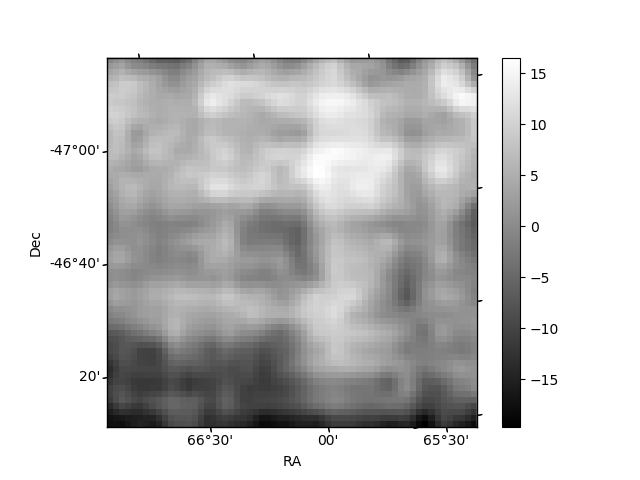
Histogram calculated using DETX and DETY for each event in the final _common_clean file
| Quadrant A | 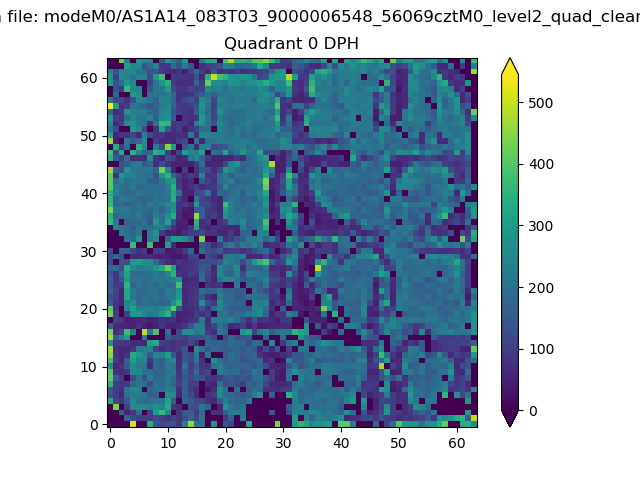 |
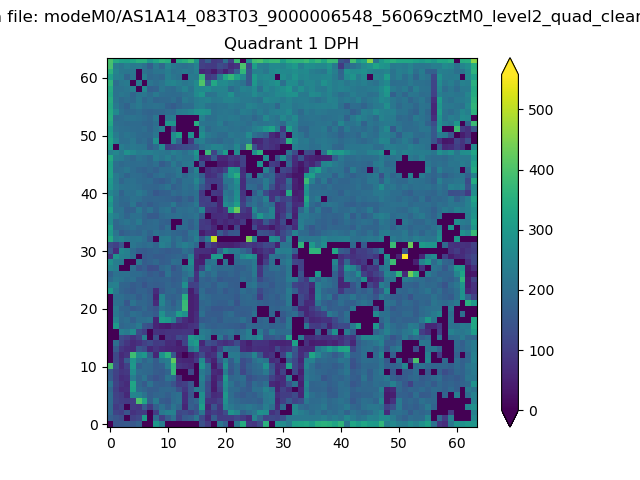 |
Quadrant B |
|---|---|---|---|
| Quadrant D | 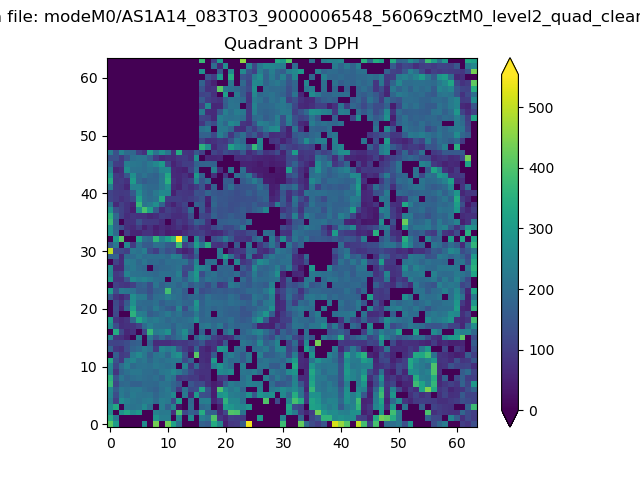 |
 |
Quadrant C |
| Plot type | Count rate plots | Images |
|---|---|---|
| Comparison with Poisson distribution Blue bars denote a histogram of data divided into 1 sec bins. Red curve is a Poisson curve with rate = median count rate of data. |
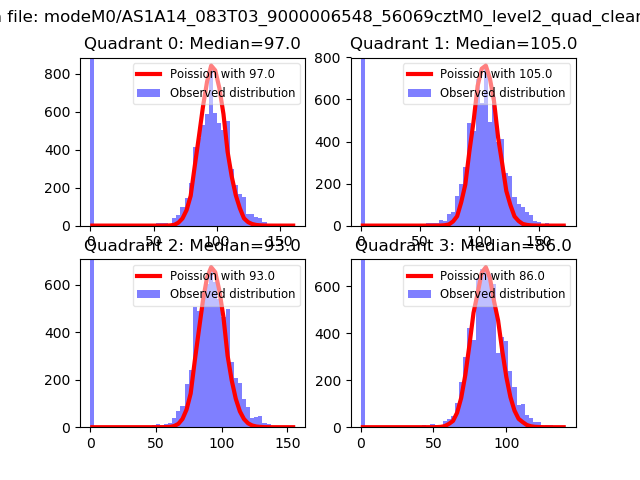 |
 |
| Quadrant-wise count rates Data is divided into 100 sec bins |
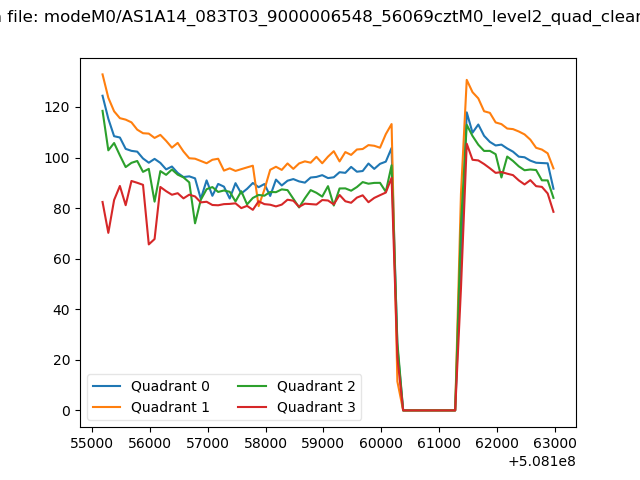 |
|
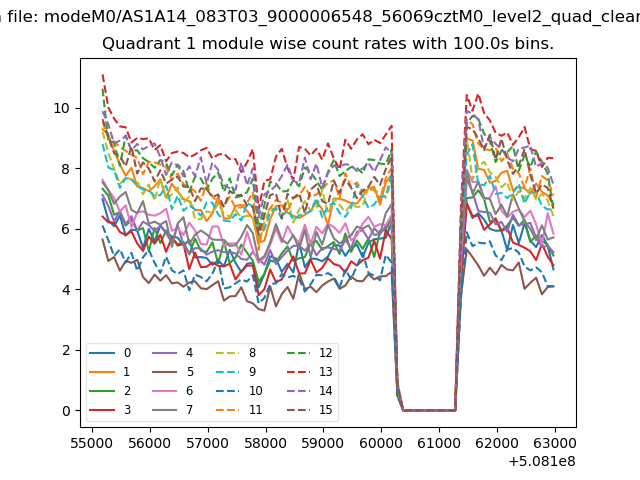
| Module-wise count rates for Quadrant A Data is divided into 100 sec bins |
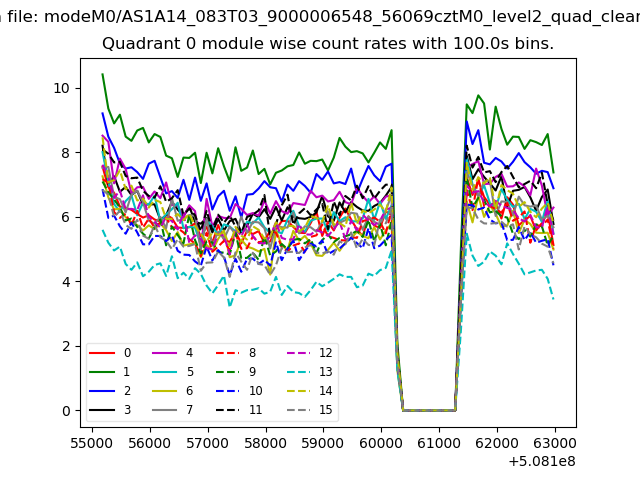 |
 |
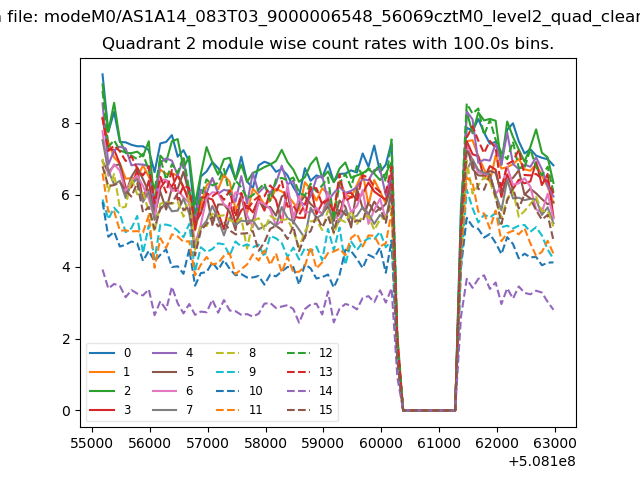
| Module-wise count rates for Quadrant B Data is divided into 100 sec bins |
 |
 |
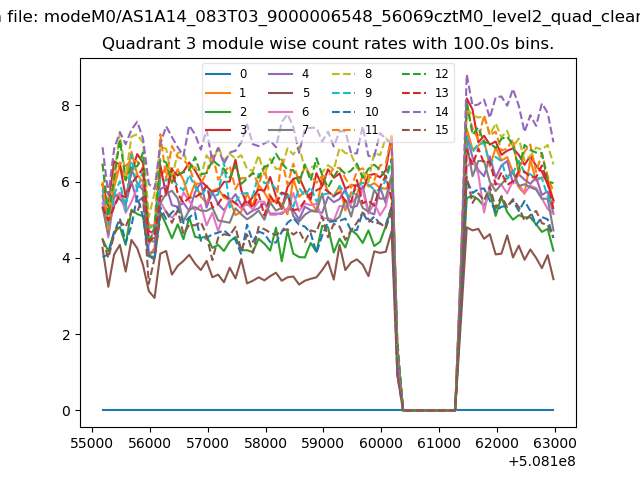
| Module-wise count rates for Quadrant C Data is divided into 100 sec bins |
 |
 |
| Module-wise count rates for Quadrant D Data is divided into 100 sec bins |
 |
 |
| Parameter | Plot |
|---|---|
| CZT HV Monitor | 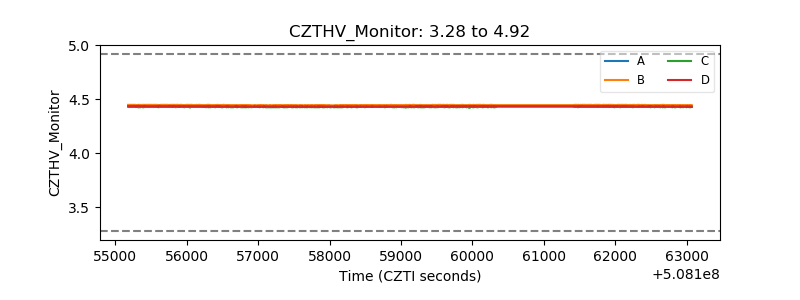 |
| D_VDD | 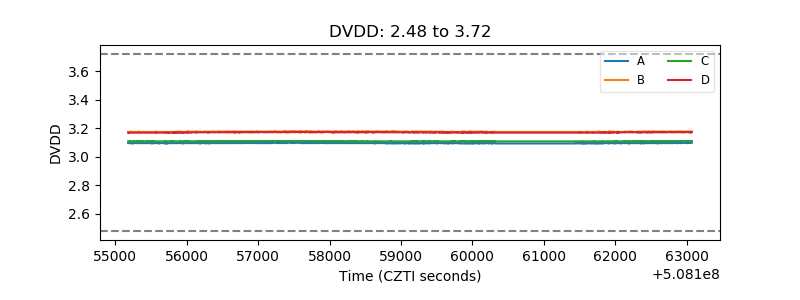 |
| Temperature 1 | 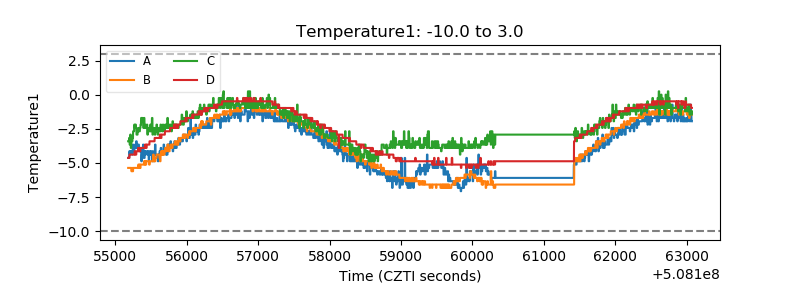 |
| Veto HV Monitor | 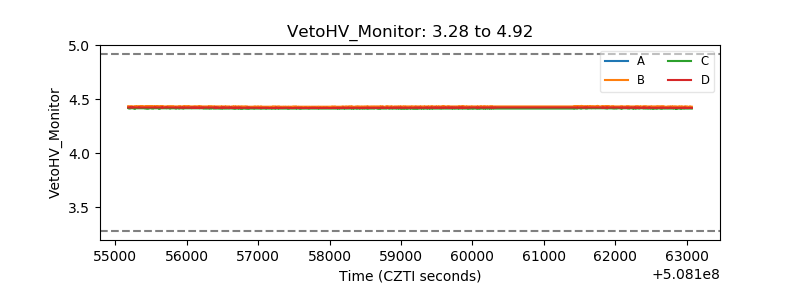 |
| Veto LLD | 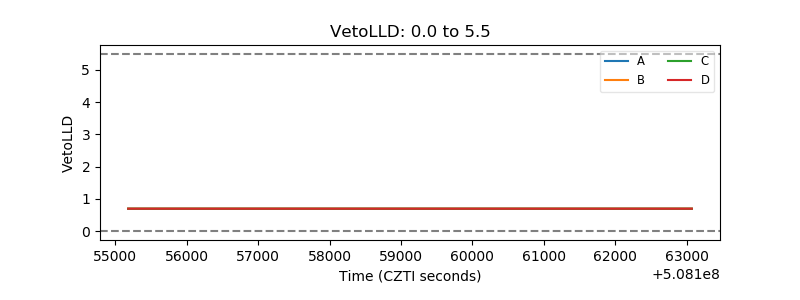 |
| Alpha Counter | 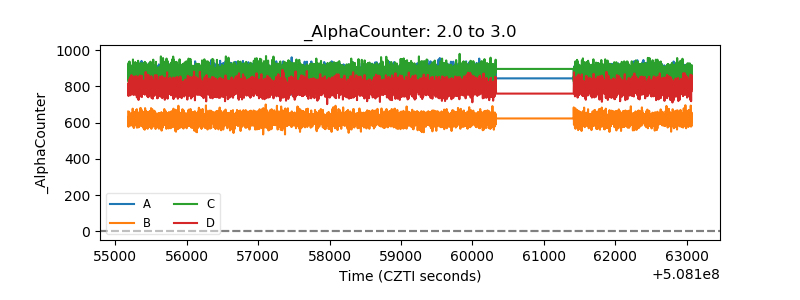 |
| _CPM_Rate | 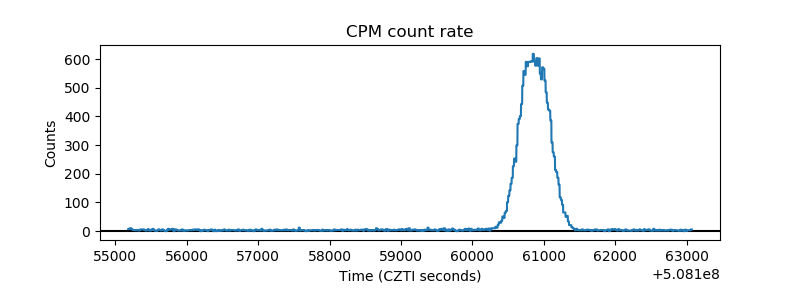 |
| CZT Counter | 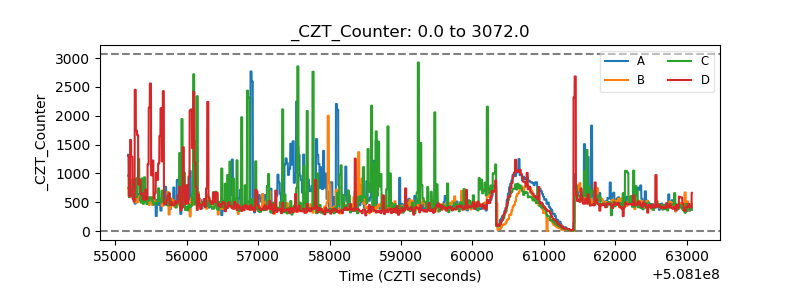 |
| +2.5 Volts monitor | 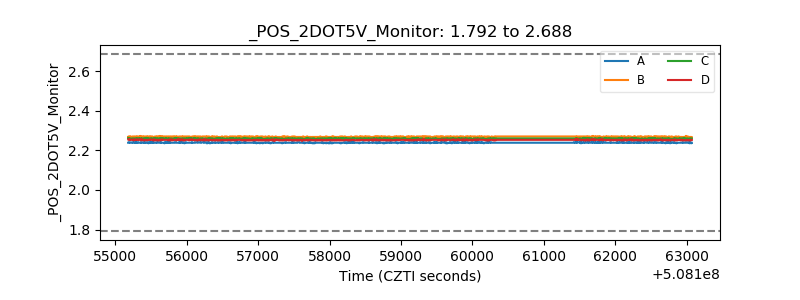 |
| +5 Volts monitor | 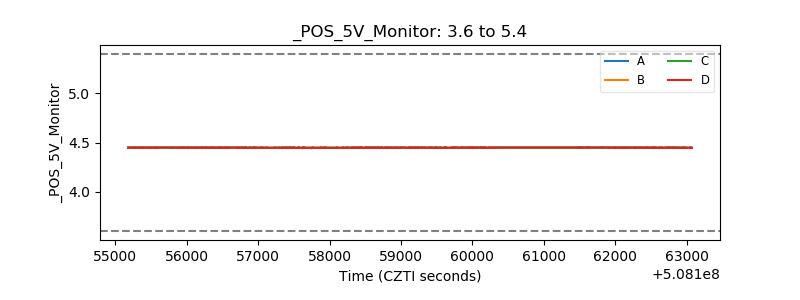 |
| _ROLL_ROT | 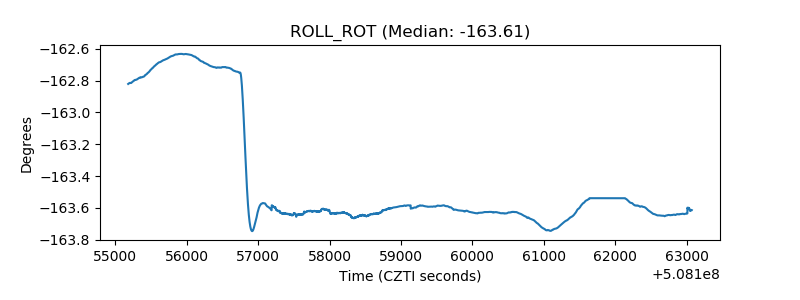 |
| _Roll_DEC | 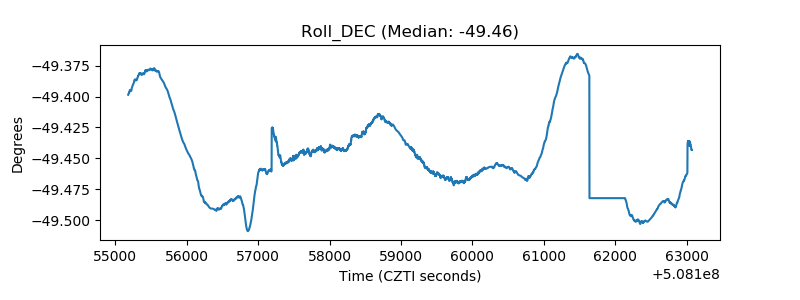 |
| _Roll_RA | 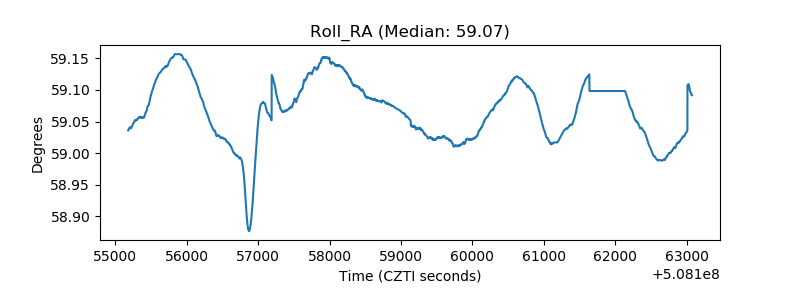 |
| Veto Counter | 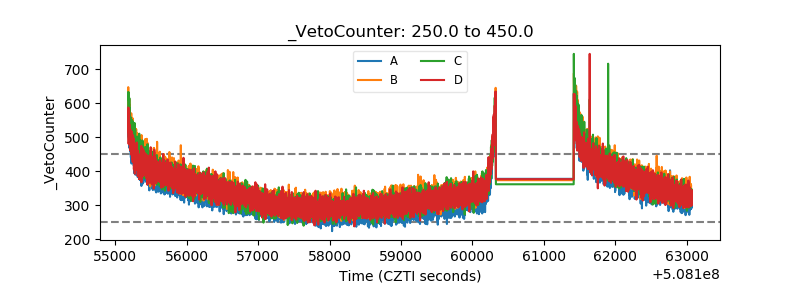 |