| Param | Original file | Final file |
|---|---|---|
| Filename | modeM0/AS1A14_083T03_9000006548_56070cztM0_level2.fits | modeM0/AS1A14_083T03_9000006548_56070cztM0_level2_quad_clean.evt |
| Size (bytes) | 382,003,200 | 89,104,320 |
| Size | 364.3 MB | 85.0 MB |
| Events in quadrant A | 3,962,418 | 569,765 |
| Events in quadrant B | 2,851,613 | 629,913 |
| Events in quadrant C | 3,977,534 | 547,746 |
| Events in quadrant D | 2,877,847 | 527,745 |
| Mode M0 | |||
|---|---|---|---|
| Quadrant | BADHDUFLAG | Total packets | Discarded packets |
| A | 0 | 16146 | 1 |
| B | 0 | 12795 | 1 |
| C | 0 | 16237 | 1 |
| D | 0 | 13067 | 1 |
| Mode SS | |||
|---|---|---|---|
| Quadrant | BADHDUFLAG | Total packets | Discarded packets |
| A | 0 | 124 | 0 |
| B | 0 | 124 | 0 |
| C | 0 | 124 | 0 |
| D | 0 | 124 | 0 |
| Mode M9 | |||
|---|---|---|---|
| Quadrant | BADHDUFLAG | Total packets | Discarded packets |
| A | 0 | 11 | 0 |
| B | 0 | 11 | 0 |
| C | 0 | 11 | 0 |
| D | 0 | 11 | 0 |
| Quadrant | Total seconds | Saturated seconds | Saturation percentage |
|---|---|---|---|
| A | 6051 | 310 | 5.123120% |
| B | 6052 | 84 | 1.387971% |
| C | 6052 | 245 | 4.048249% |
| D | 6052 | 55 | 0.908790% |
Noise dominated data is calculated using 1-second bins in cleaned event files. If a bin has >2000 counts, and if more than 50% of those come from <1% of pixels, then it is considered to be noise-dominated and hence unusable.
| Quadrant | # 1 sec bins | Bins with >0 counts | Bins with >2000 counts | High rate bins dominated by noise | Noise dominated (total time) | Noise dominated (detector-on time) | Marked lightcurve |
|---|---|---|---|---|---|---|---|
| A | 7171 | 6051 | 265 | 265 | 3.70% | 4.38% | 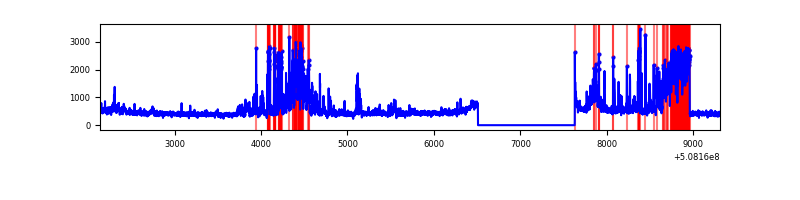 |
| B | 7172 | 6052 | 10 | 10 | 0.14% | 0.17% | 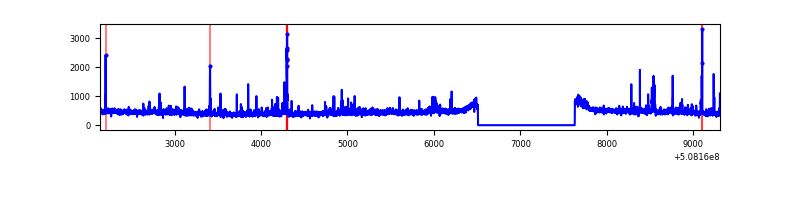 |
| C | 7172 | 6052 | 193 | 193 | 2.69% | 3.19% | 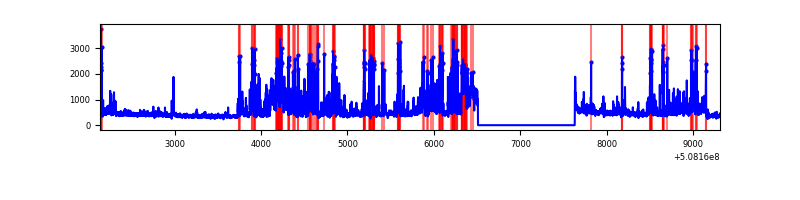 |
| D | 7172 | 6052 | 28 | 28 | 0.39% | 0.46% | 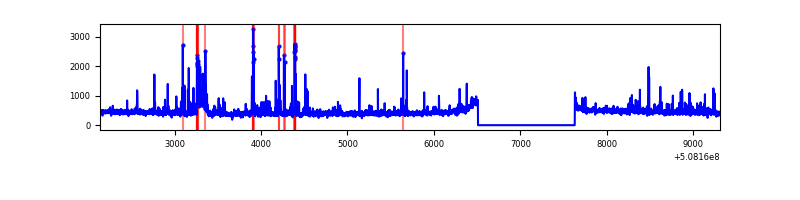 |
Top three noisy pixels from each quadrant. If the there are fewer than three noisy pixels in the level2.evt file, extra rows are filled as -1
| Pixel properties | Quadrant properties | ||||||
|---|---|---|---|---|---|---|---|
| Quadrant | DetID | PixID | Counts | Sigma | Mean | Median | Sigma |
| A | 12 | 115 | 1138468 | 7087.06 | 644 | 627 | 160.6 |
| A | 15 | 32 | 133242 | 825.99 | 644 | 627 | 160.6 |
| A | 3 | 14 | 93162 | 576.36 | 644 | 627 | 160.6 |
| B | 0 | 213 | 63862 | 463.22 | 642 | 621 | 136.5 |
| B | 9 | 254 | 59347 | 430.15 | 642 | 621 | 136.5 |
| B | 5 | 172 | 44486 | 321.3 | 642 | 621 | 136.5 |
| C | 13 | 3 | 794494 | 4650.1 | 613 | 605 | 170.7 |
| C | 15 | 147 | 482267 | 2821.27 | 613 | 605 | 170.7 |
| C | 6 | 9 | 98075 | 570.91 | 613 | 605 | 170.7 |
| D | 8 | 240 | 129604 | 728.87 | 622 | 595 | 177.0 |
| D | 2 | 249 | 75065 | 420.74 | 622 | 595 | 177.0 |
| D | 5 | 173 | 52365 | 292.49 | 622 | 595 | 177.0 |
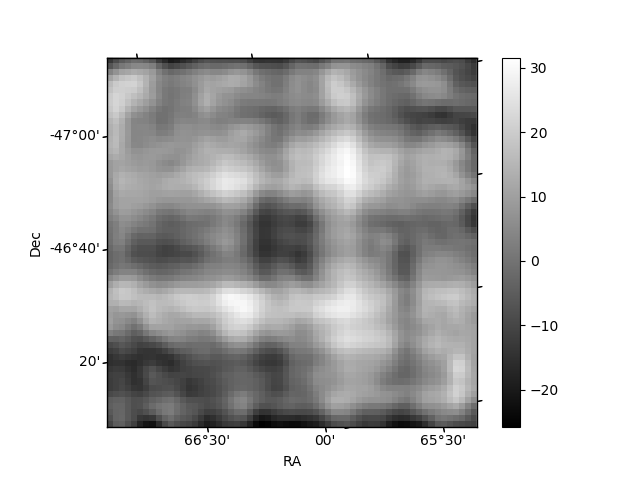
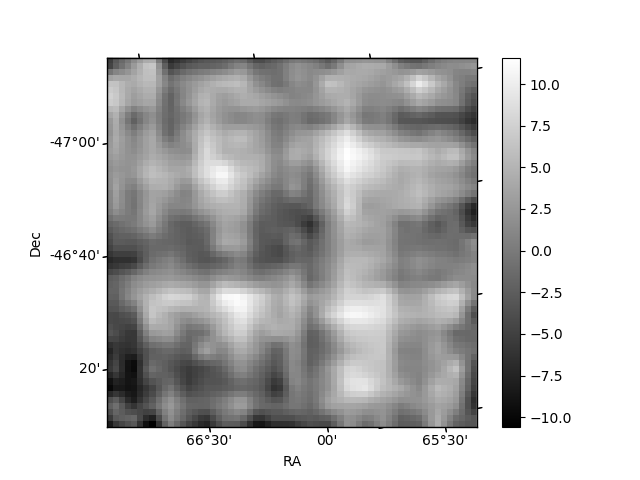
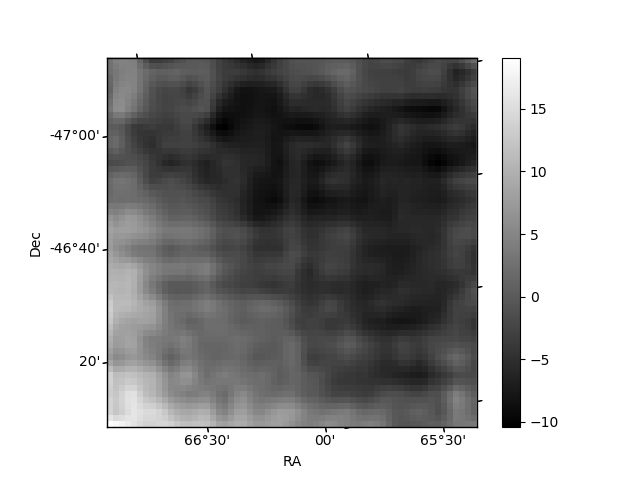
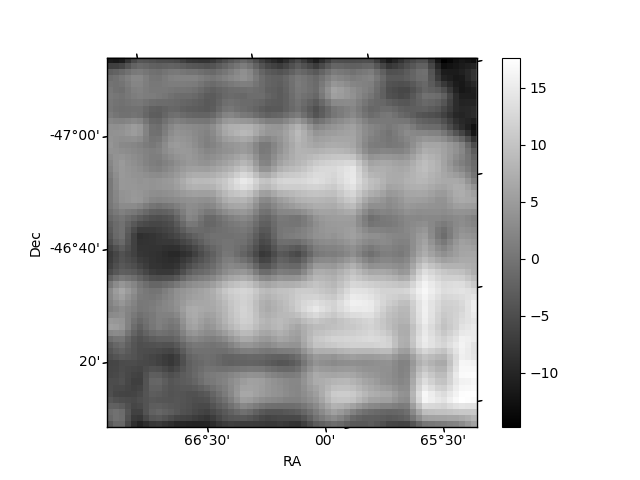
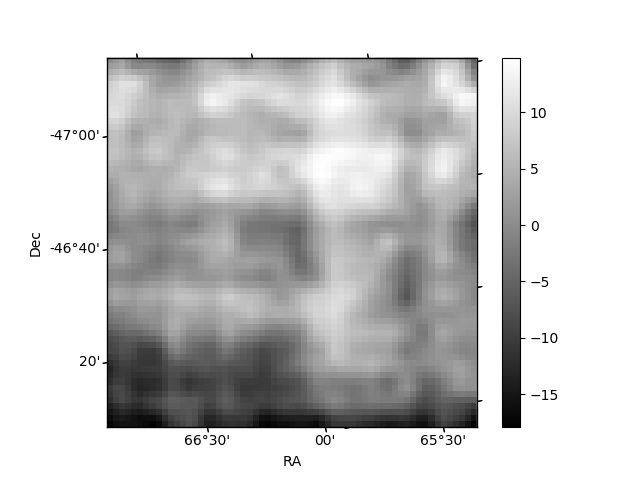
Histogram calculated using DETX and DETY for each event in the final _common_clean file
| Quadrant A | 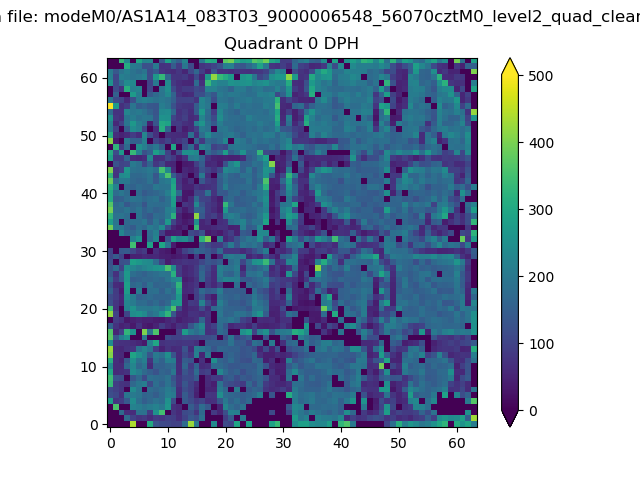 |
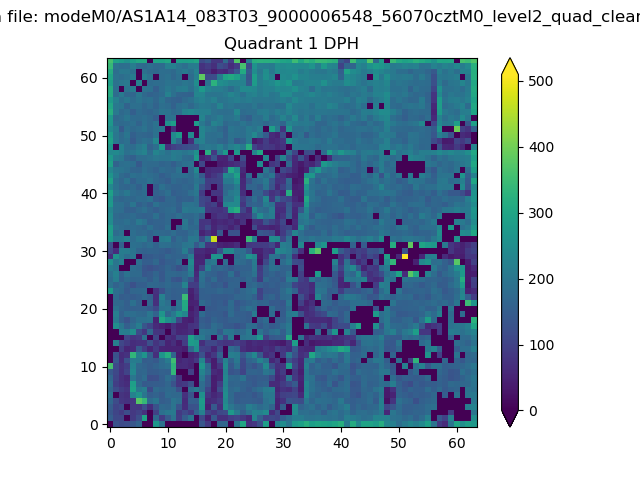 |
Quadrant B |
|---|---|---|---|
| Quadrant D | 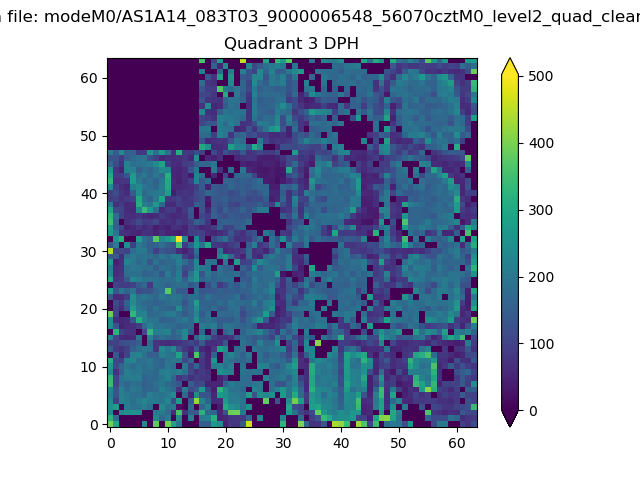 |
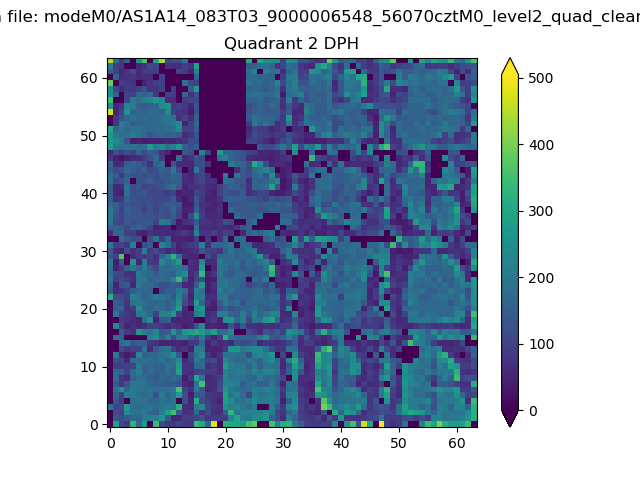 |
Quadrant C |
| Plot type | Count rate plots | Images |
|---|---|---|
| Comparison with Poisson distribution Blue bars denote a histogram of data divided into 1 sec bins. Red curve is a Poisson curve with rate = median count rate of data. |
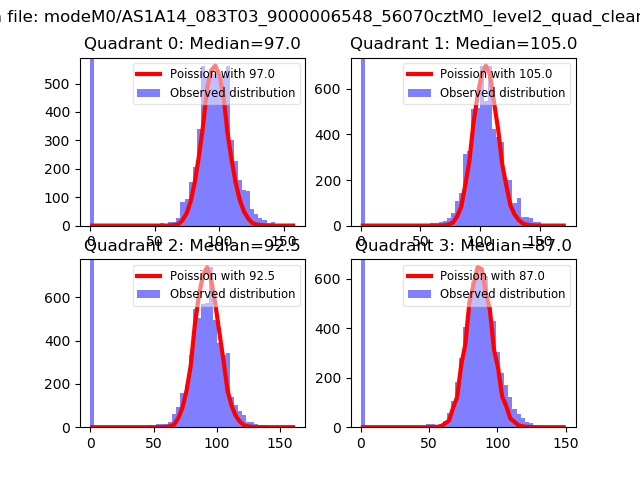 |
 |
| Quadrant-wise count rates Data is divided into 100 sec bins |
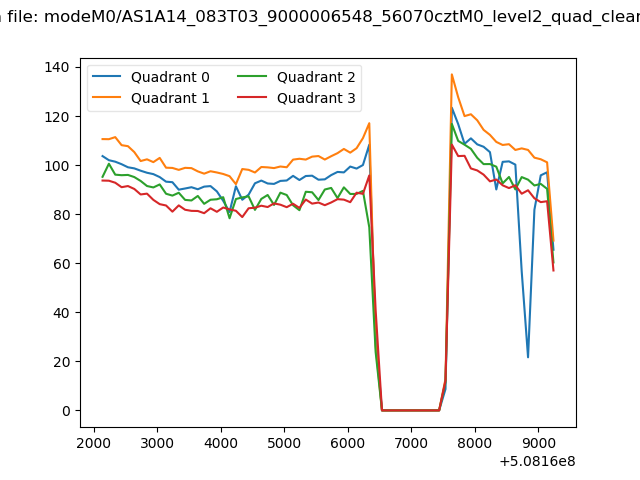 |
|
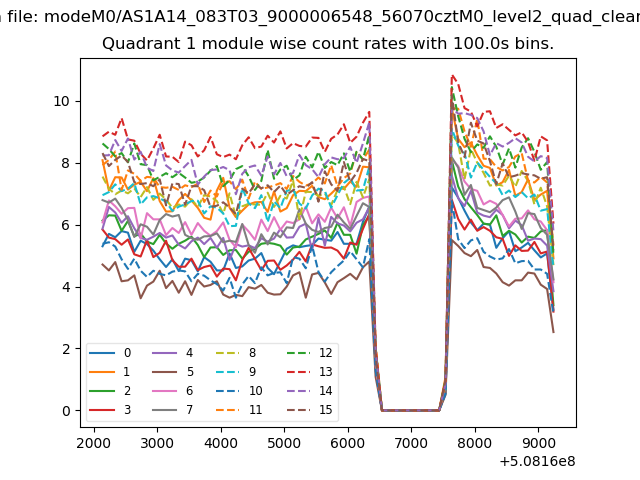
| Module-wise count rates for Quadrant A Data is divided into 100 sec bins |
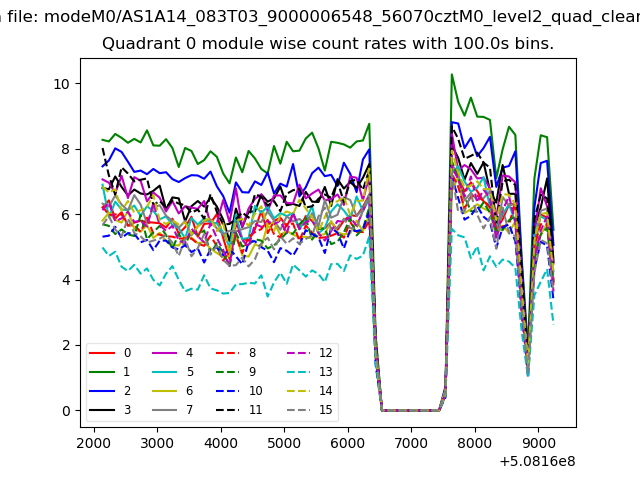 |
 |
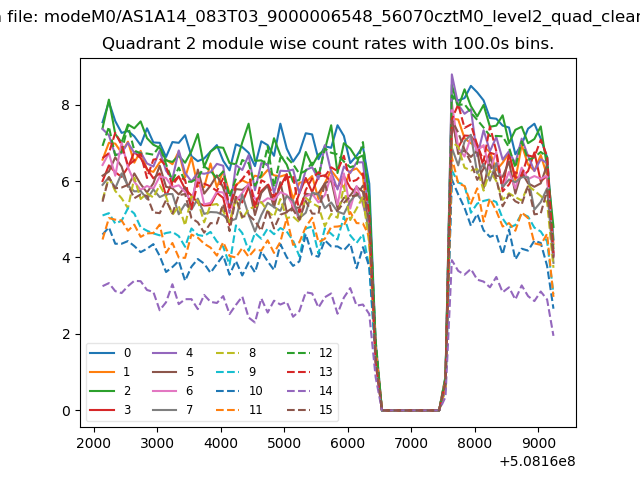
| Module-wise count rates for Quadrant B Data is divided into 100 sec bins |
 |
 |
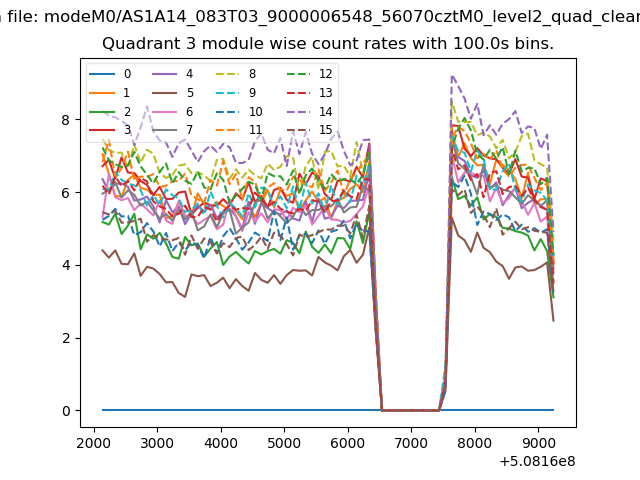
| Module-wise count rates for Quadrant C Data is divided into 100 sec bins |
 |
 |
| Module-wise count rates for Quadrant D Data is divided into 100 sec bins |
 |
 |
| Parameter | Plot |
|---|---|
| CZT HV Monitor | 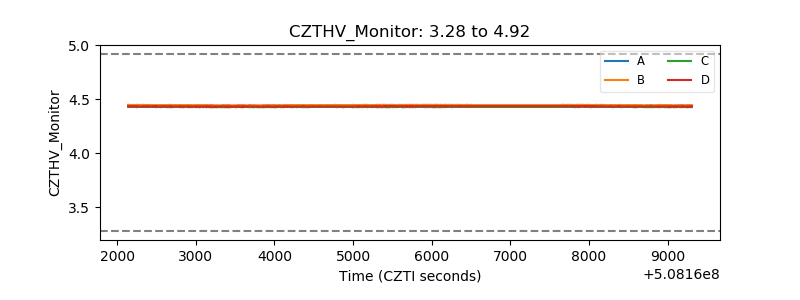 |
| D_VDD | 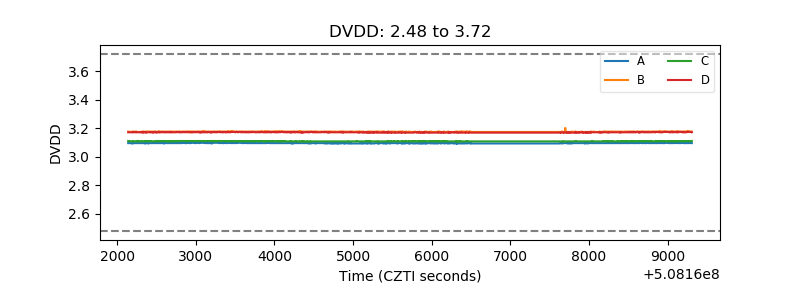 |
| Temperature 1 | 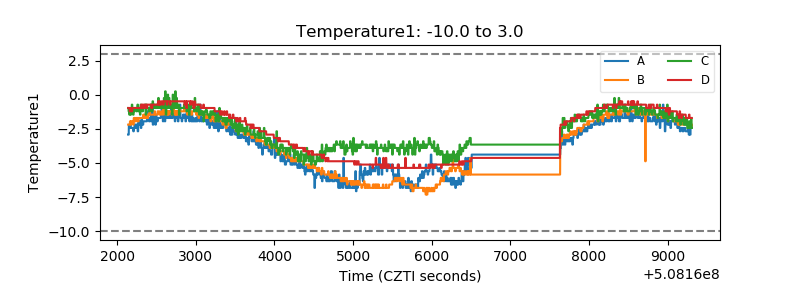 |
| Veto HV Monitor | 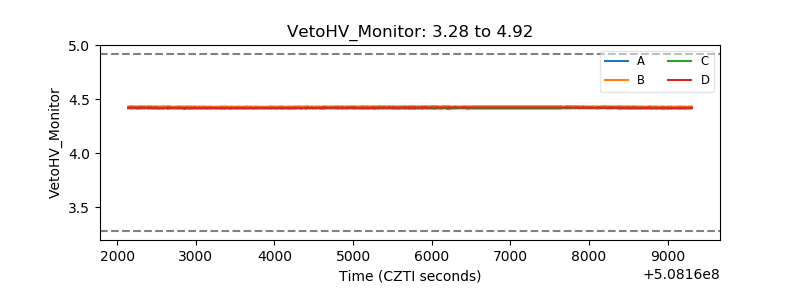 |
| Veto LLD | 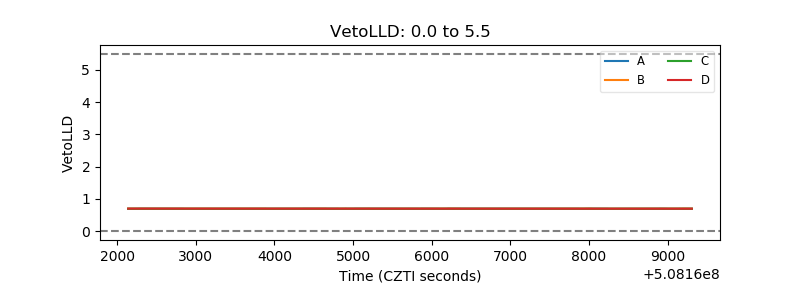 |
| Alpha Counter | 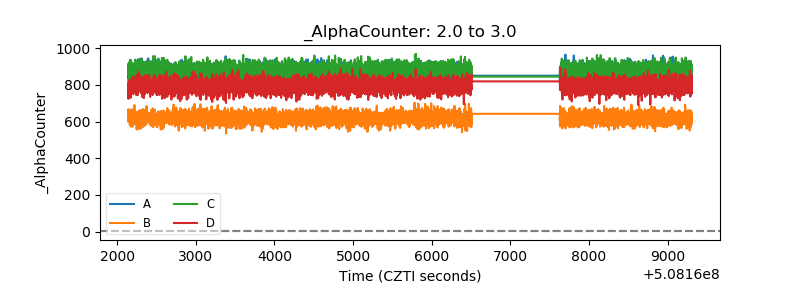 |
| _CPM_Rate | 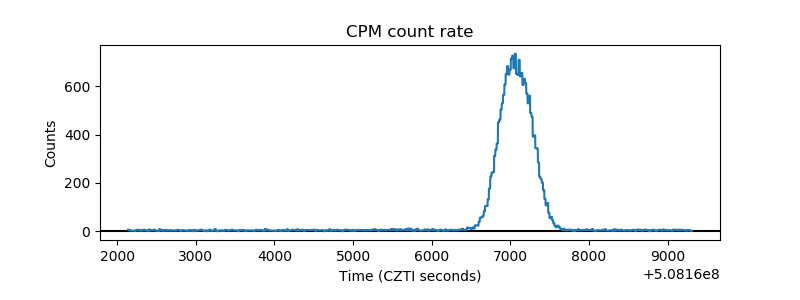 |
| CZT Counter | 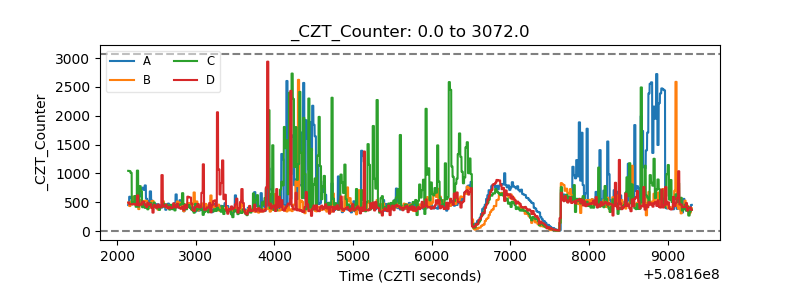 |
| +2.5 Volts monitor | 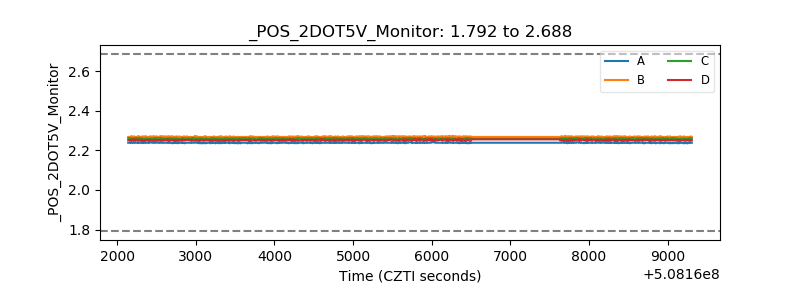 |
| +5 Volts monitor | 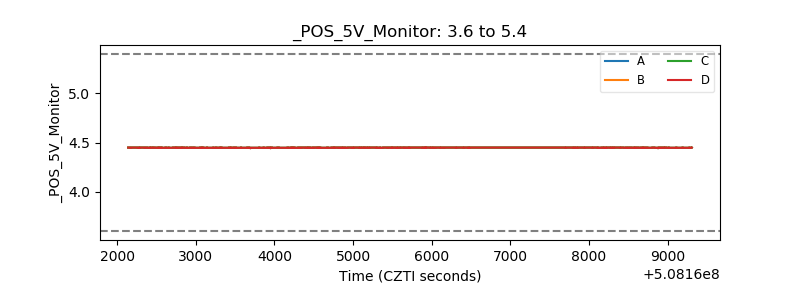 |
| _ROLL_ROT | 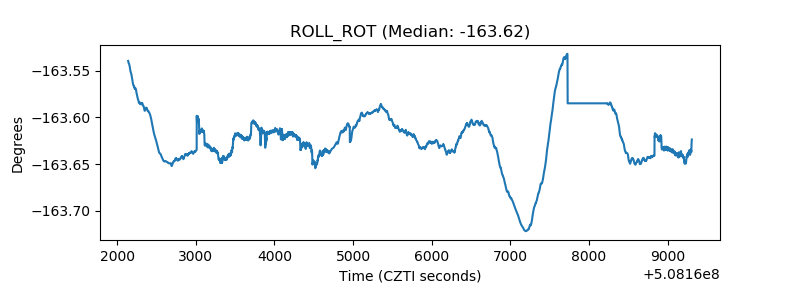 |
| _Roll_DEC | 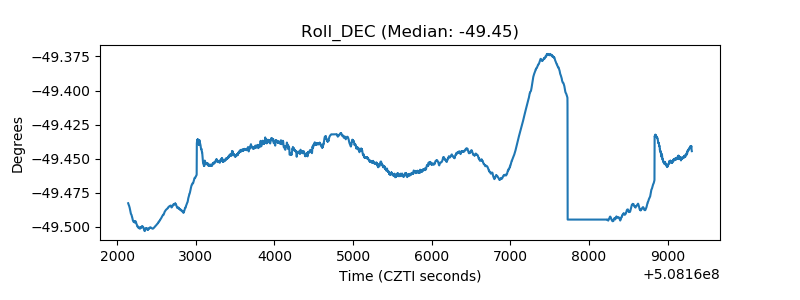 |
| _Roll_RA | 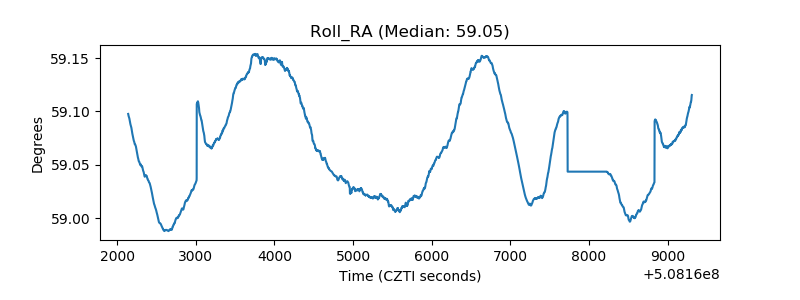 |
| Veto Counter | 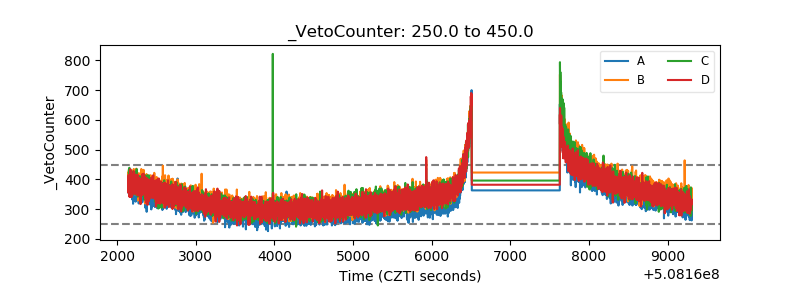 |