| Param | Original file | Final file |
|---|---|---|
| Filename | modeM0/AS1A14_083T03_9000006548_56071cztM0_level2.fits | modeM0/AS1A14_083T03_9000006548_56071cztM0_level2_quad_clean.evt |
| Size (bytes) | 358,850,880 | 87,171,840 |
| Size | 342.2 MB | 83.1 MB |
| Events in quadrant A | 3,475,131 | 561,208 |
| Events in quadrant B | 2,780,063 | 620,278 |
| Events in quadrant C | 3,751,079 | 532,189 |
| Events in quadrant D | 2,815,883 | 511,882 |
| Mode M0 | |||
|---|---|---|---|
| Quadrant | BADHDUFLAG | Total packets | Discarded packets |
| A | 0 | 14760 | 1 |
| B | 0 | 12591 | 1 |
| C | 0 | 15478 | 1 |
| D | 0 | 12943 | 1 |
| Mode SS | |||
|---|---|---|---|
| Quadrant | BADHDUFLAG | Total packets | Discarded packets |
| A | 0 | 122 | 0 |
| B | 0 | 122 | 0 |
| C | 0 | 122 | 0 |
| D | 0 | 122 | 0 |
| Mode M9 | |||
|---|---|---|---|
| Quadrant | BADHDUFLAG | Total packets | Discarded packets |
| A | 0 | 11 | 0 |
| B | 0 | 11 | 0 |
| C | 0 | 11 | 0 |
| D | 0 | 11 | 0 |
| Quadrant | Total seconds | Saturated seconds | Saturation percentage |
|---|---|---|---|
| A | 5921 | 274 | 4.627597% |
| B | 5922 | 72 | 1.215805% |
| C | 5922 | 266 | 4.491726% |
| D | 5921 | 76 | 1.283567% |
Noise dominated data is calculated using 1-second bins in cleaned event files. If a bin has >2000 counts, and if more than 50% of those come from <1% of pixels, then it is considered to be noise-dominated and hence unusable.
| Quadrant | # 1 sec bins | Bins with >0 counts | Bins with >2000 counts | High rate bins dominated by noise | Noise dominated (total time) | Noise dominated (detector-on time) | Marked lightcurve |
|---|---|---|---|---|---|---|---|
| A | 7066 | 5922 | 209 | 209 | 2.96% | 3.53% | 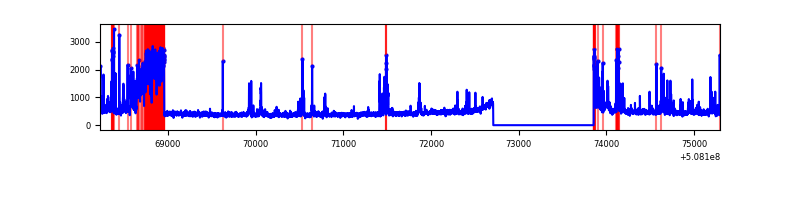 |
| B | 7067 | 5922 | 14 | 14 | 0.20% | 0.24% | 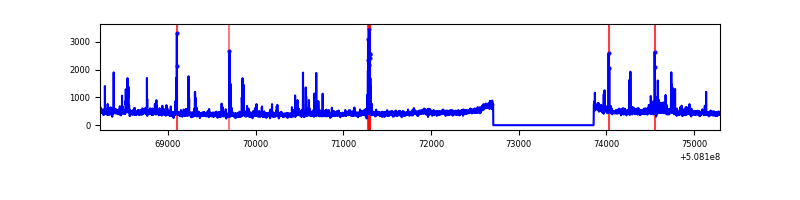 |
| C | 7067 | 5922 | 266 | 266 | 3.76% | 4.49% | 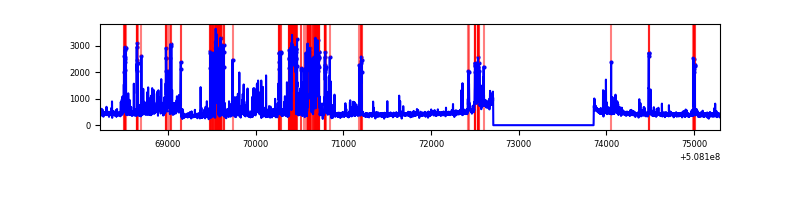 |
| D | 7066 | 5921 | 26 | 26 | 0.37% | 0.44% | 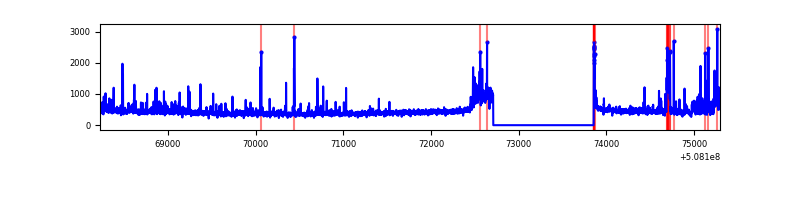 |
Top three noisy pixels from each quadrant. If the there are fewer than three noisy pixels in the level2.evt file, extra rows are filled as -1
| Pixel properties | Quadrant properties | ||||||
|---|---|---|---|---|---|---|---|
| Quadrant | DetID | PixID | Counts | Sigma | Mean | Median | Sigma |
| A | 12 | 115 | 583798 | 3727.75 | 627 | 611 | 156.4 |
| A | 15 | 32 | 235146 | 1499.15 | 627 | 611 | 156.4 |
| A | 3 | 14 | 114057 | 725.15 | 627 | 611 | 156.4 |
| B | 0 | 213 | 52445 | 393.33 | 625 | 605 | 131.8 |
| B | 5 | 172 | 45953 | 344.08 | 625 | 605 | 131.8 |
| B | 9 | 251 | 45387 | 339.78 | 625 | 605 | 131.8 |
| C | 12 | 252 | 679657 | 4110.73 | 597 | 589 | 165.2 |
| C | 13 | 3 | 345141 | 2085.74 | 597 | 589 | 165.2 |
| C | 15 | 147 | 156568 | 944.22 | 597 | 589 | 165.2 |
| D | 2 | 31 | 97542 | 568.21 | 601 | 574 | 170.7 |
| D | 11 | 129 | 88375 | 514.5 | 601 | 574 | 170.7 |
| D | 8 | 240 | 59439 | 344.94 | 601 | 574 | 170.7 |
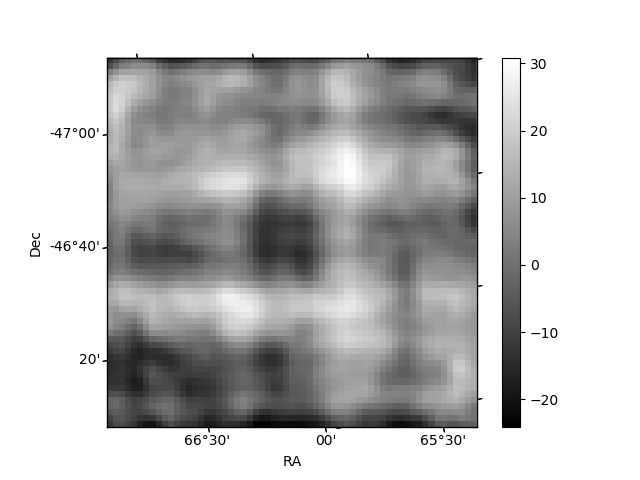
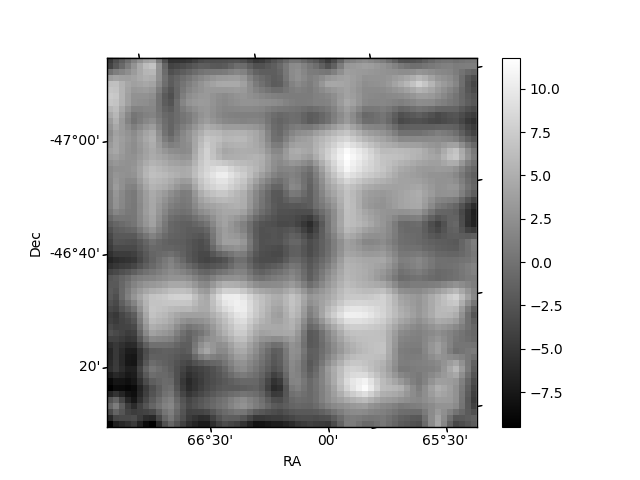
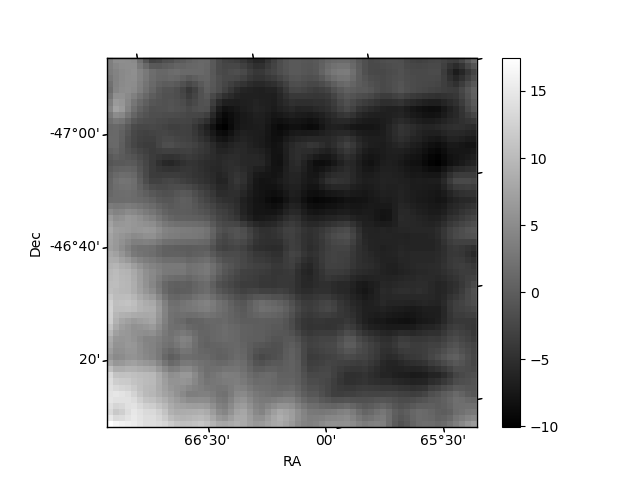
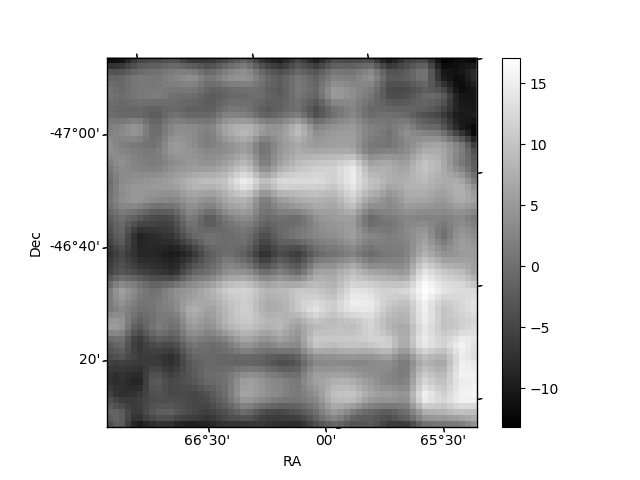
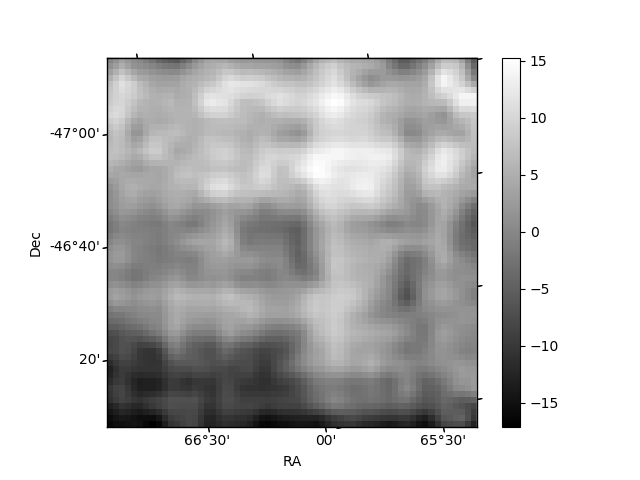
Histogram calculated using DETX and DETY for each event in the final _common_clean file
| Quadrant A | 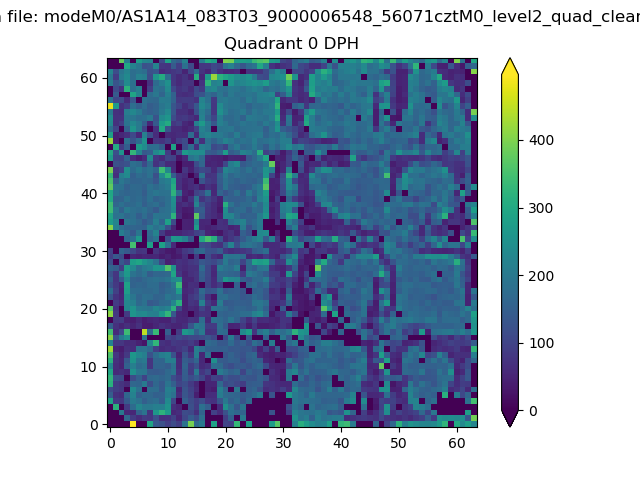 |
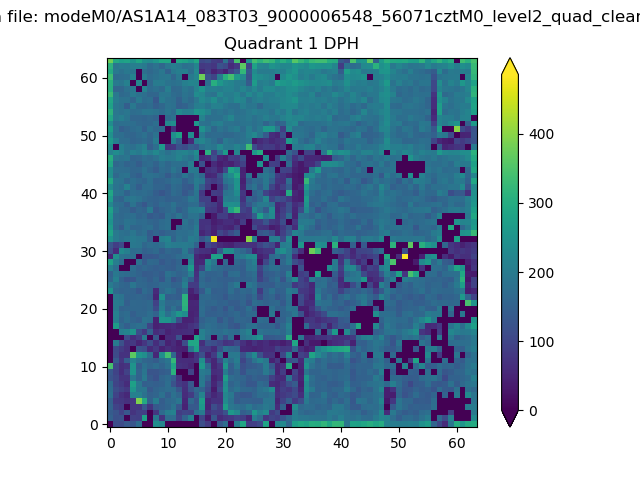 |
Quadrant B |
|---|---|---|---|
| Quadrant D | 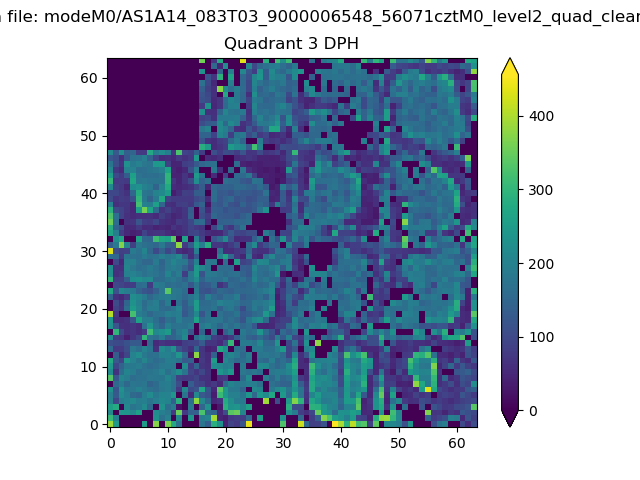 |
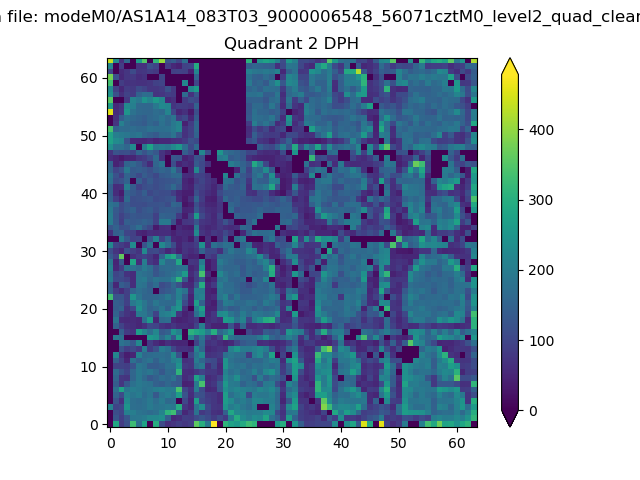 |
Quadrant C |
| Plot type | Count rate plots | Images |
|---|---|---|
| Comparison with Poisson distribution Blue bars denote a histogram of data divided into 1 sec bins. Red curve is a Poisson curve with rate = median count rate of data. |
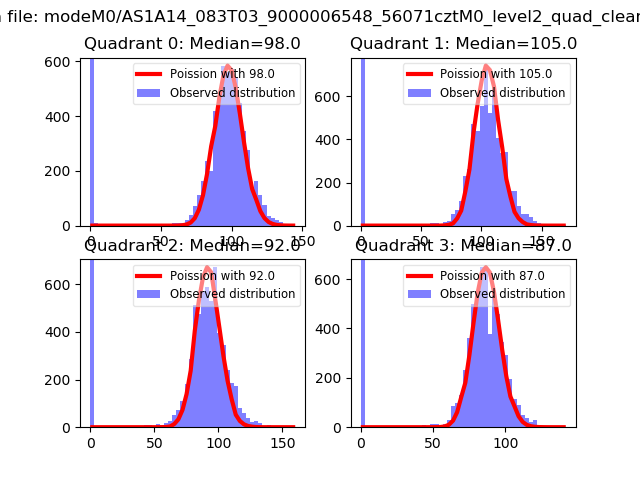 |
 |
| Quadrant-wise count rates Data is divided into 100 sec bins |
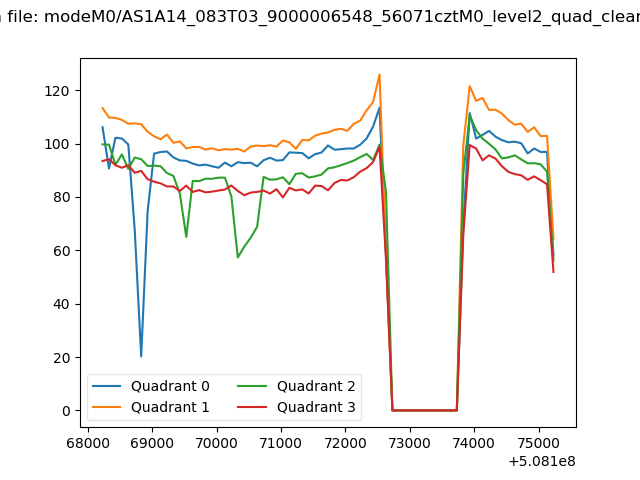 |
|
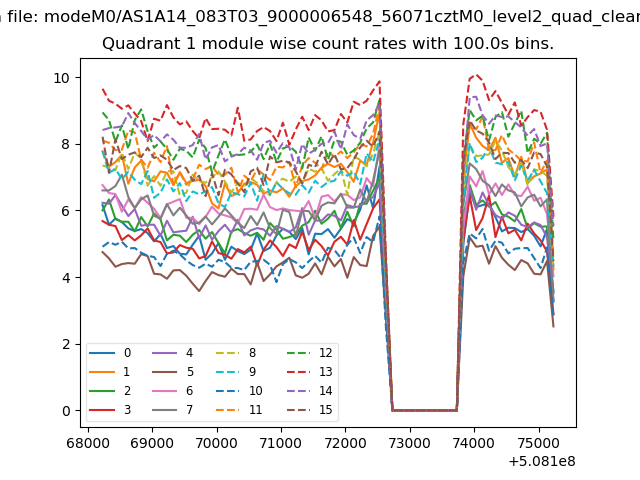
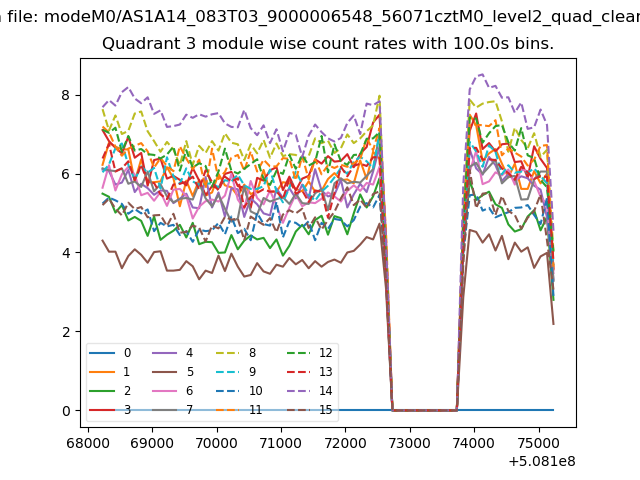
| Module-wise count rates for Quadrant A Data is divided into 100 sec bins |
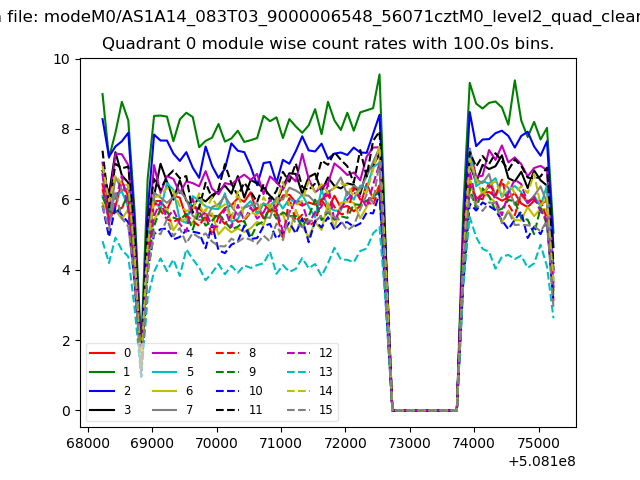 |
 |
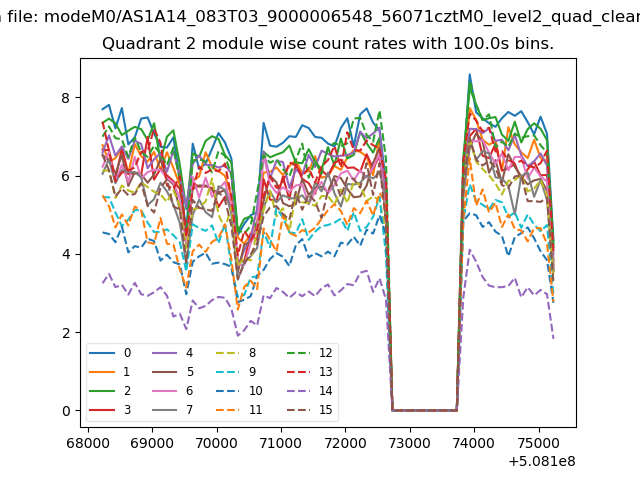
| Module-wise count rates for Quadrant B Data is divided into 100 sec bins |
 |
 |
| Module-wise count rates for Quadrant C Data is divided into 100 sec bins |
 |
 |
| Module-wise count rates for Quadrant D Data is divided into 100 sec bins |
 |
 |
| Parameter | Plot |
|---|---|
| CZT HV Monitor | 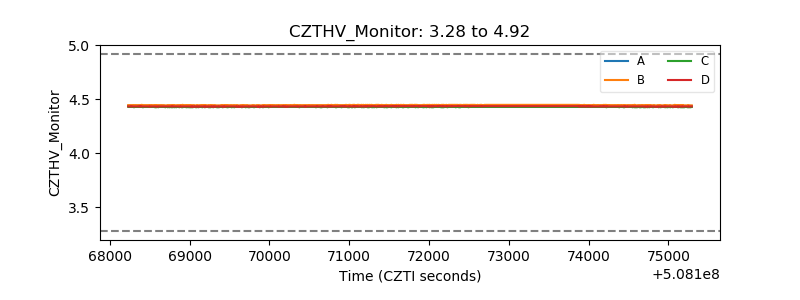 |
| D_VDD | 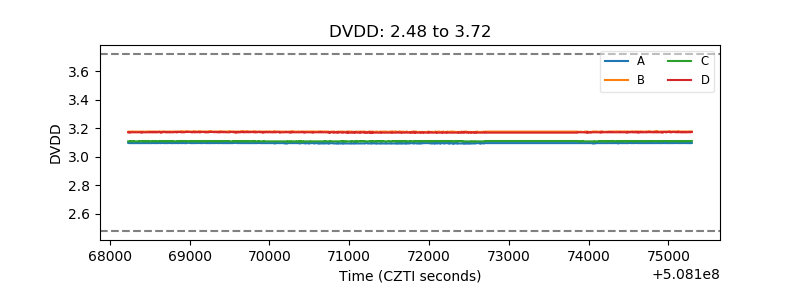 |
| Temperature 1 | 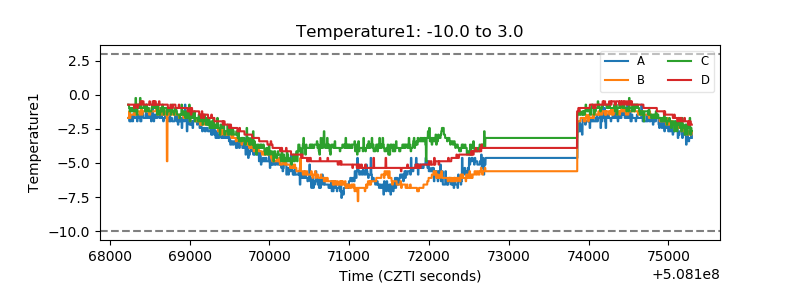 |
| Veto HV Monitor | 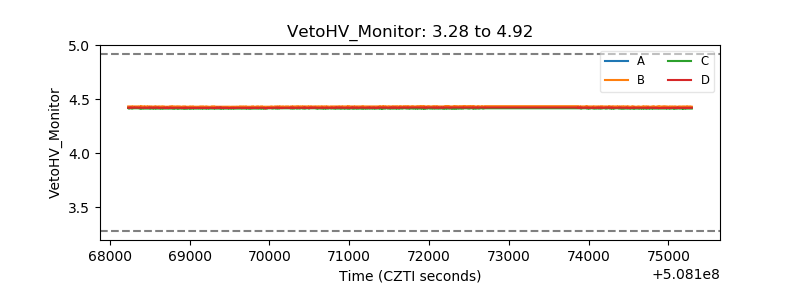 |
| Veto LLD | 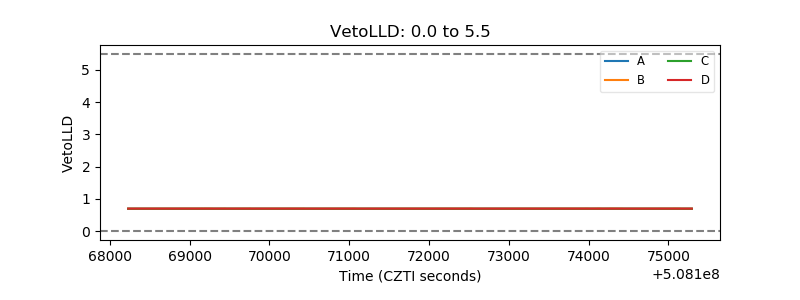 |
| Alpha Counter | 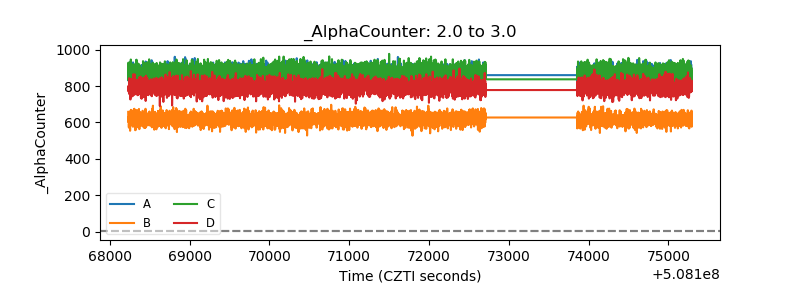 |
| _CPM_Rate | 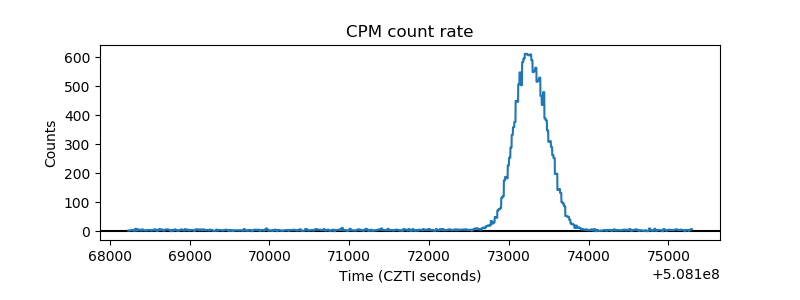 |
| CZT Counter | 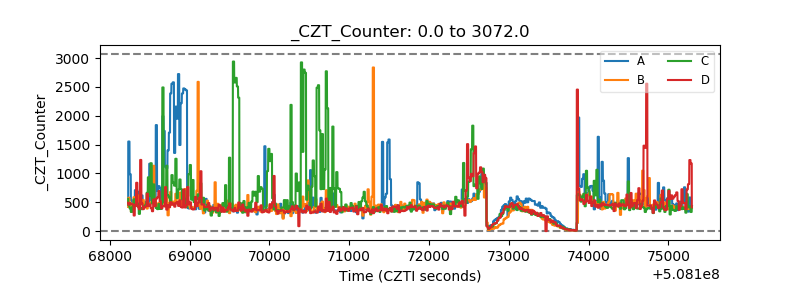 |
| +2.5 Volts monitor |  |
| +5 Volts monitor | 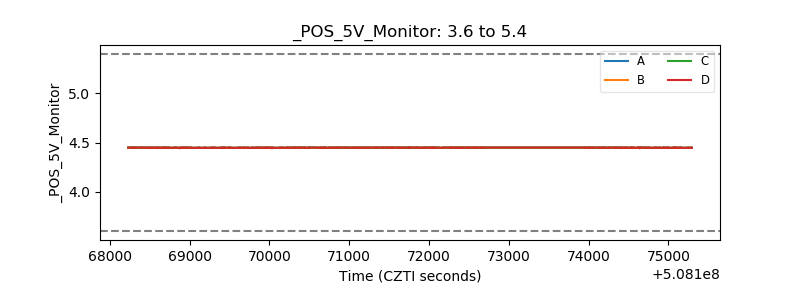 |
| _ROLL_ROT | 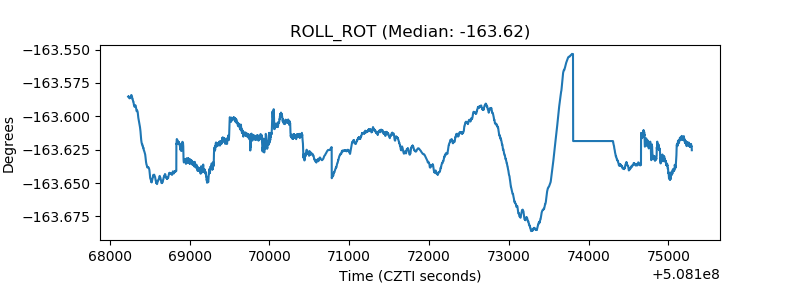 |
| _Roll_DEC | 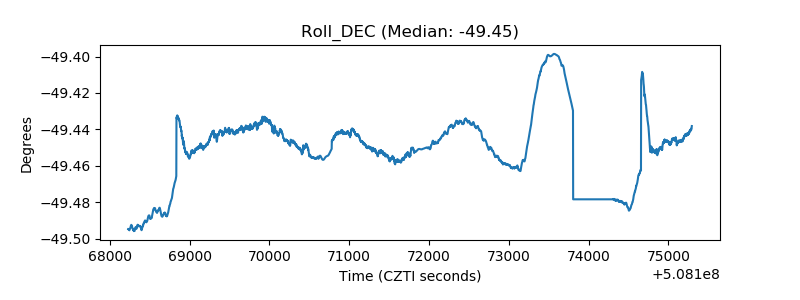 |
| _Roll_RA | 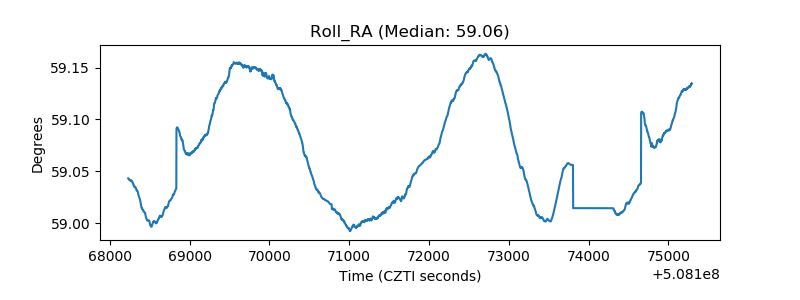 |
| Veto Counter | 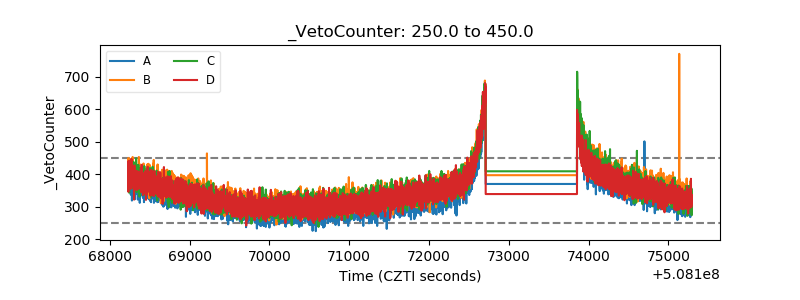 |