| Param | Original file | Final file |
|---|---|---|
| Filename | modeM0/AS1A14_083T03_9000006548_56073cztM0_level2.fits | modeM0/AS1A14_083T03_9000006548_56073cztM0_level2_quad_clean.evt |
| Size (bytes) | 362,888,640 | 90,144,000 |
| Size | 346.1 MB | 86.0 MB |
| Events in quadrant A | 4,011,916 | 568,935 |
| Events in quadrant B | 2,946,897 | 637,927 |
| Events in quadrant C | 3,032,789 | 561,176 |
| Events in quadrant D | 2,951,211 | 522,128 |
| Mode M0 | |||
|---|---|---|---|
| Quadrant | BADHDUFLAG | Total packets | Discarded packets |
| A | 0 | 16424 | 1 |
| B | 0 | 13425 | 1 |
| C | 0 | 13872 | 1 |
| D | 0 | 13785 | 1 |
| Mode SS | |||
|---|---|---|---|
| Quadrant | BADHDUFLAG | Total packets | Discarded packets |
| A | 0 | 128 | 0 |
| B | 0 | 128 | 0 |
| C | 0 | 128 | 0 |
| D | 0 | 128 | 0 |
| Mode M9 | |||
|---|---|---|---|
| Quadrant | BADHDUFLAG | Total packets | Discarded packets |
| A | 0 | 9 | 0 |
| B | 0 | 9 | 0 |
| C | 0 | 9 | 0 |
| D | 0 | 9 | 0 |
| Quadrant | Total seconds | Saturated seconds | Saturation percentage |
|---|---|---|---|
| A | 6292 | 291 | 4.624921% |
| B | 6293 | 50 | 0.794534% |
| C | 6293 | 35 | 0.556174% |
| D | 6293 | 61 | 0.969331% |
Noise dominated data is calculated using 1-second bins in cleaned event files. If a bin has >2000 counts, and if more than 50% of those come from <1% of pixels, then it is considered to be noise-dominated and hence unusable.
| Quadrant | # 1 sec bins | Bins with >0 counts | Bins with >2000 counts | High rate bins dominated by noise | Noise dominated (total time) | Noise dominated (detector-on time) | Marked lightcurve |
|---|---|---|---|---|---|---|---|
| A | 7197 | 6293 | 247 | 247 | 3.43% | 3.92% | 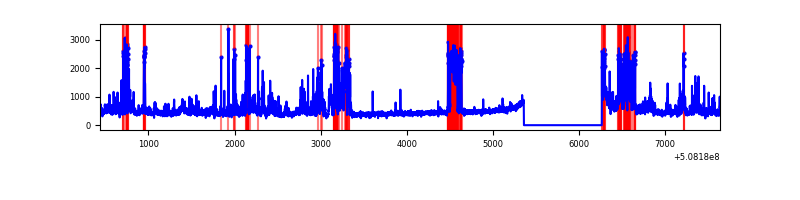 |
| B | 7198 | 6294 | 12 | 12 | 0.17% | 0.19% | 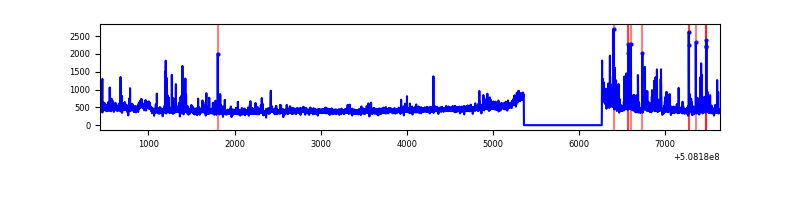 |
| C | 7198 | 6294 | 37 | 37 | 0.51% | 0.59% |  |
| D | 7198 | 6294 | 58 | 58 | 0.81% | 0.92% | 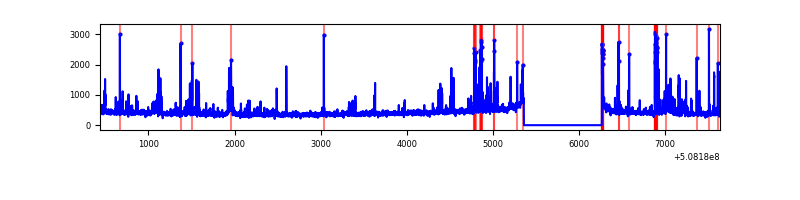 |
Top three noisy pixels from each quadrant. If the there are fewer than three noisy pixels in the level2.evt file, extra rows are filled as -1
| Pixel properties | Quadrant properties | ||||||
|---|---|---|---|---|---|---|---|
| Quadrant | DetID | PixID | Counts | Sigma | Mean | Median | Sigma |
| A | 15 | 32 | 854662 | 5313.19 | 643 | 626 | 160.7 |
| A | 5 | 242 | 209219 | 1297.71 | 643 | 626 | 160.7 |
| A | 3 | 94 | 122937 | 760.93 | 643 | 626 | 160.7 |
| B | 0 | 231 | 151081 | 1080.18 | 653 | 631 | 139.3 |
| B | 10 | 247 | 37737 | 266.41 | 653 | 631 | 139.3 |
| B | 0 | 213 | 28189 | 197.86 | 653 | 631 | 139.3 |
| C | 15 | 147 | 299817 | 1722.8 | 629 | 622 | 173.7 |
| C | 12 | 252 | 115475 | 661.34 | 629 | 622 | 173.7 |
| C | 6 | 223 | 42976 | 243.88 | 629 | 622 | 173.7 |
| D | 8 | 240 | 207646 | 1180.62 | 622 | 593 | 175.4 |
| D | 2 | 249 | 53653 | 302.55 | 622 | 593 | 175.4 |
| D | 14 | 52 | 53565 | 302.05 | 622 | 593 | 175.4 |
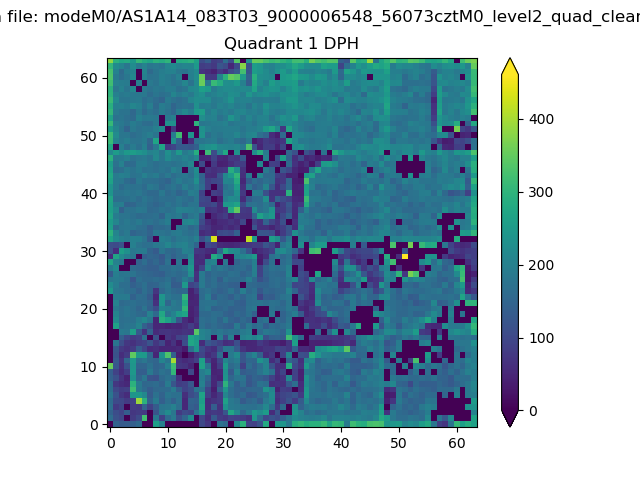
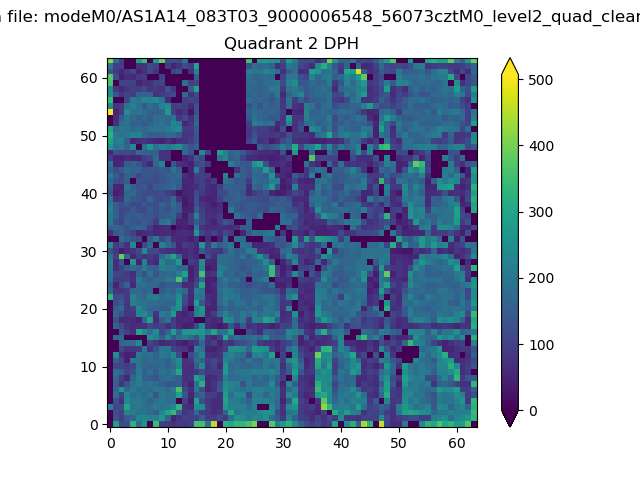
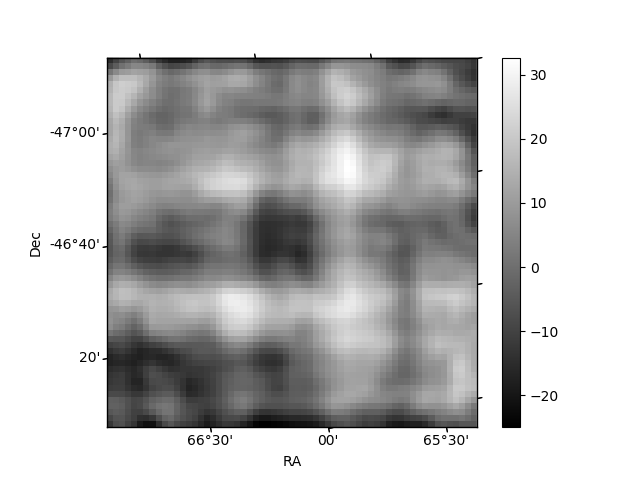
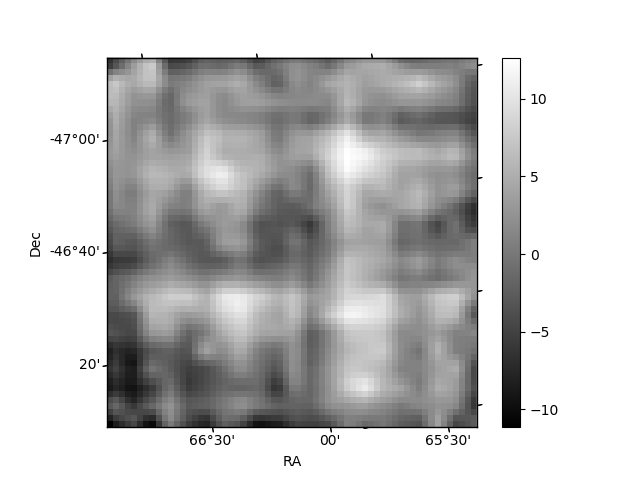
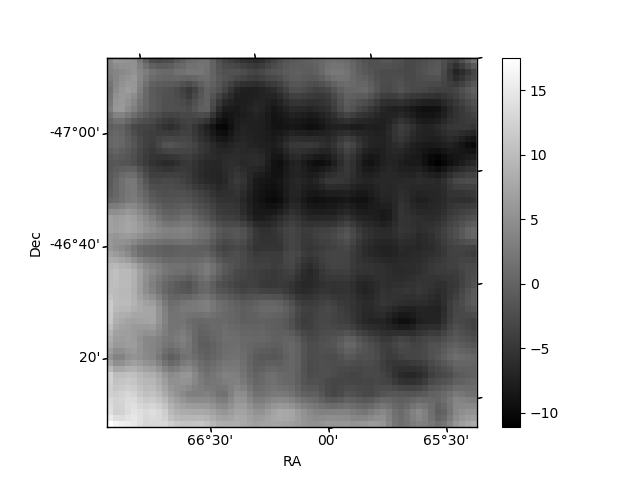
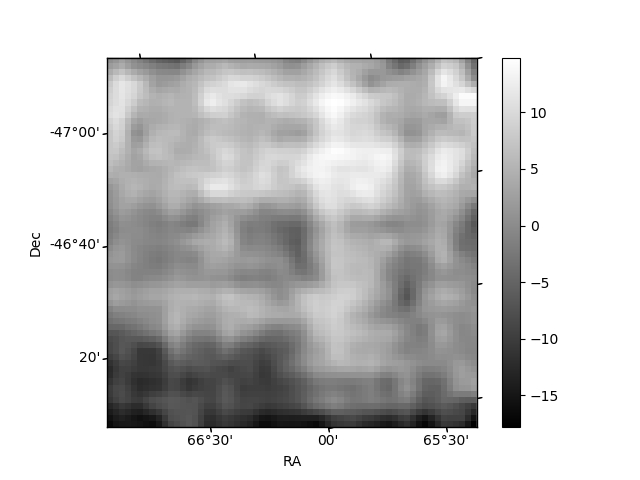
Histogram calculated using DETX and DETY for each event in the final _common_clean file
| Quadrant A | 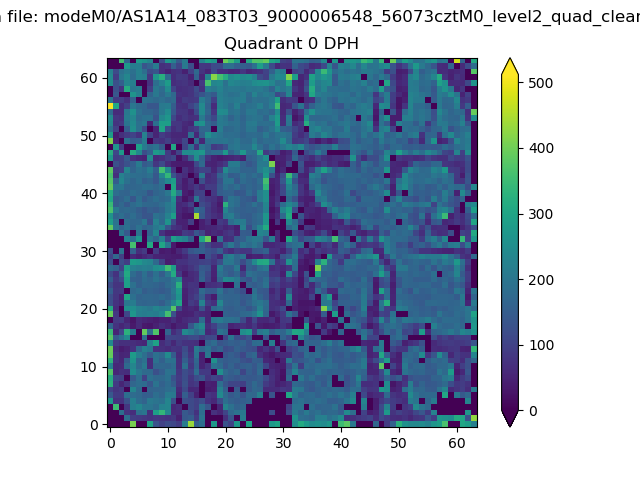 |
 |
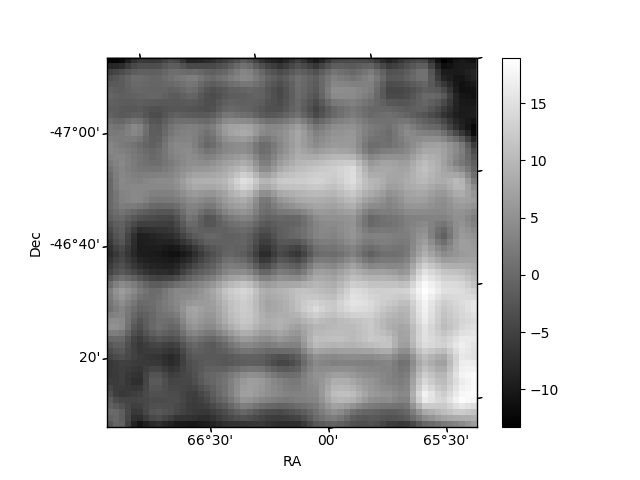
Quadrant B |
|---|---|---|---|
| Quadrant D | 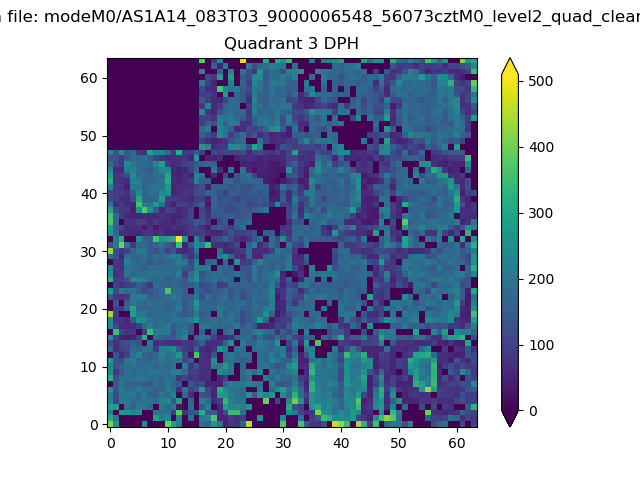 |
 |
Quadrant C |
| Plot type | Count rate plots | Images |
|---|---|---|
| Comparison with Poisson distribution Blue bars denote a histogram of data divided into 1 sec bins. Red curve is a Poisson curve with rate = median count rate of data. |
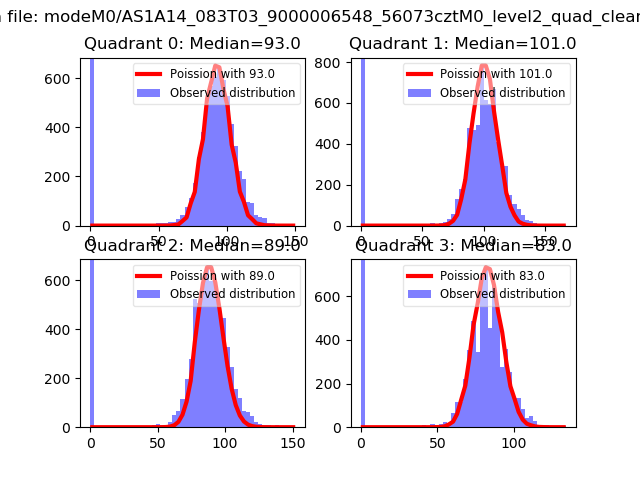 |
 |
| Quadrant-wise count rates Data is divided into 100 sec bins |
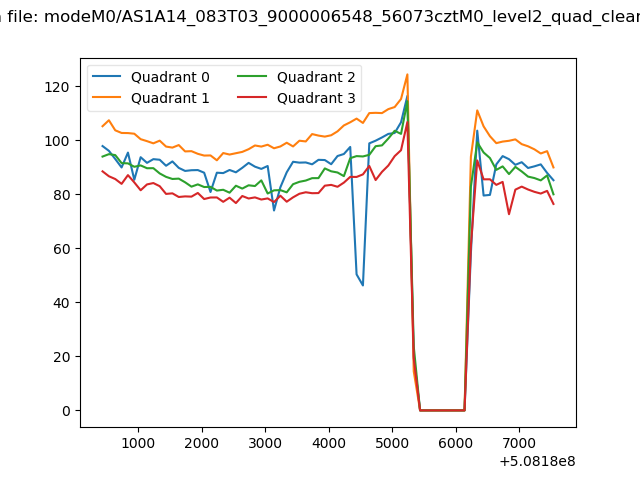 |
|
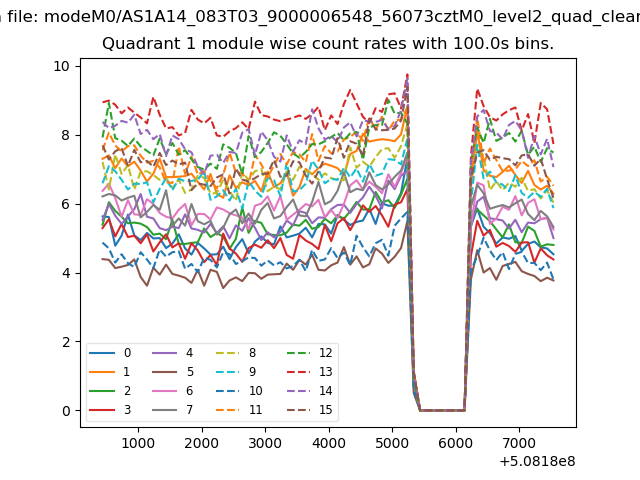
| Module-wise count rates for Quadrant A Data is divided into 100 sec bins |
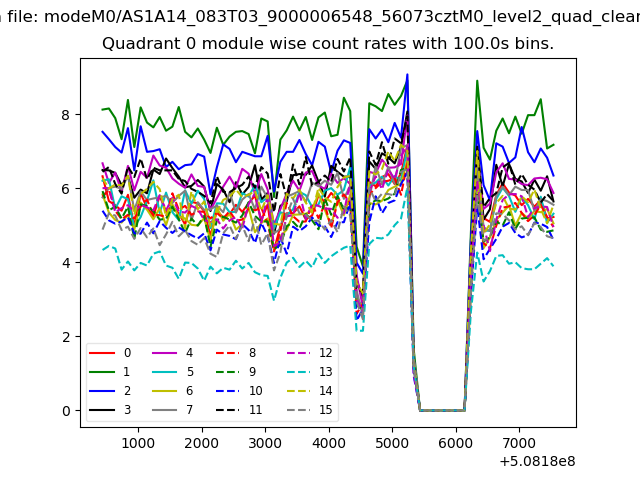 |
 |
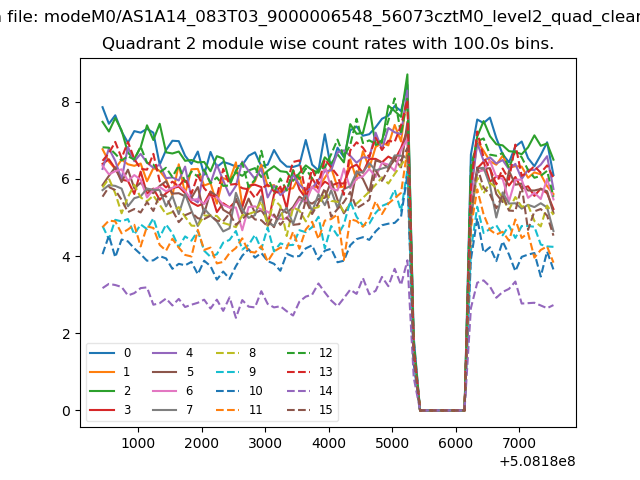
| Module-wise count rates for Quadrant B Data is divided into 100 sec bins |
 |
 |
| Module-wise count rates for Quadrant C Data is divided into 100 sec bins |
 |
 |
| Module-wise count rates for Quadrant D Data is divided into 100 sec bins |
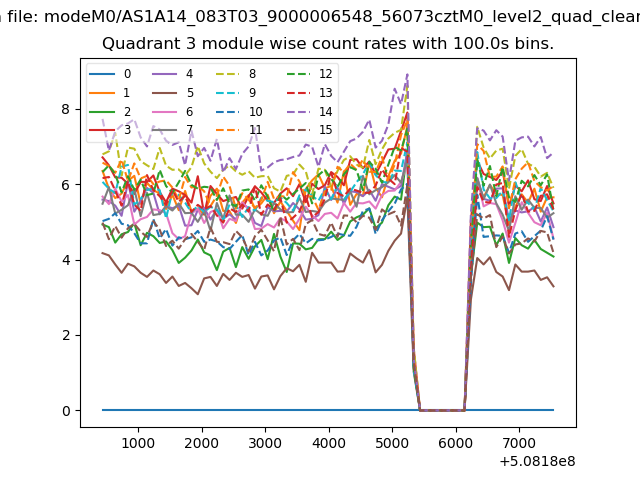 |
 |
| Parameter | Plot |
|---|---|
| CZT HV Monitor | 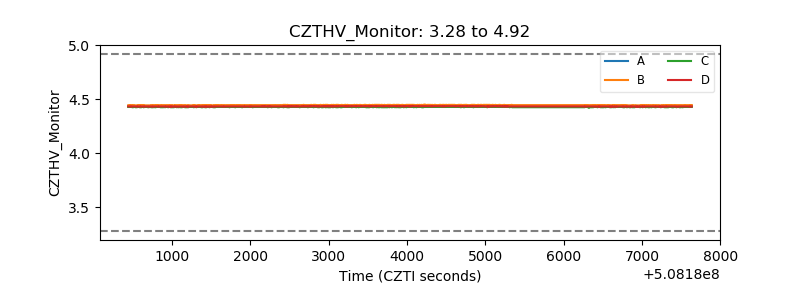 |
| D_VDD | 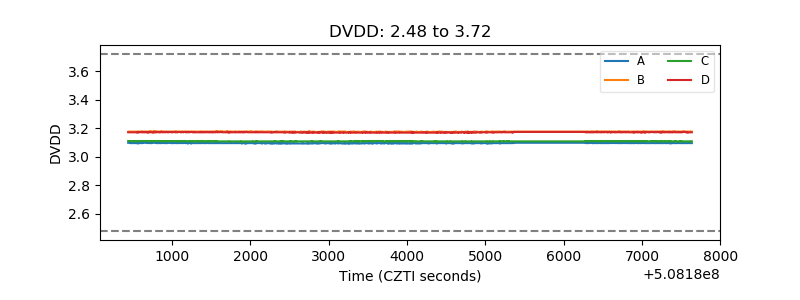 |
| Temperature 1 | 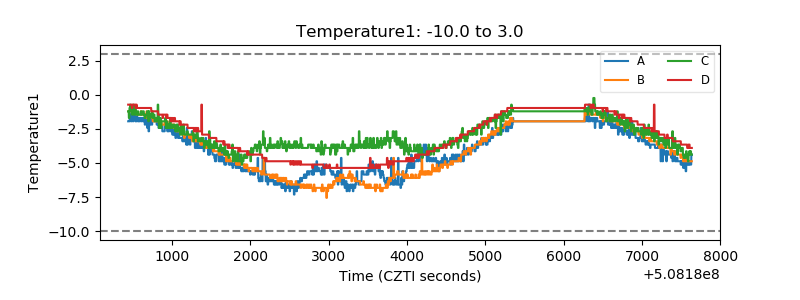 |
| Veto HV Monitor | 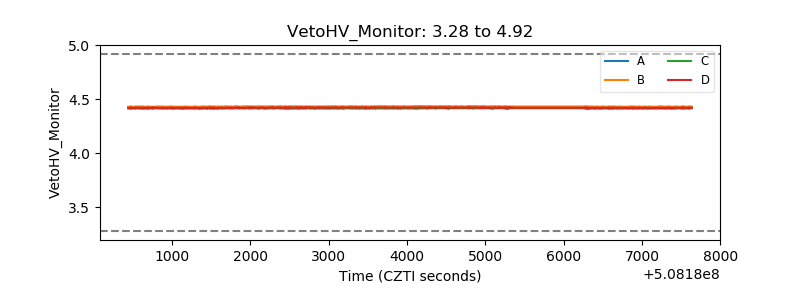 |
| Veto LLD | 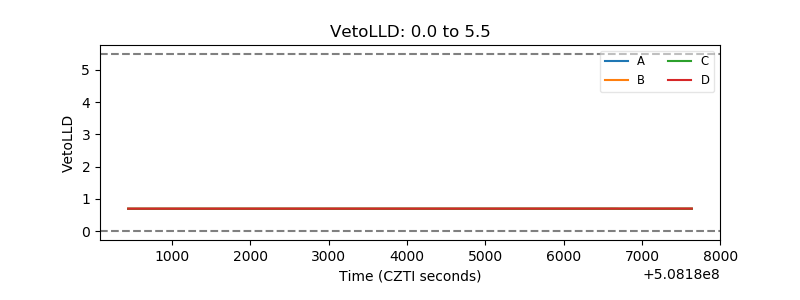 |
| Alpha Counter | 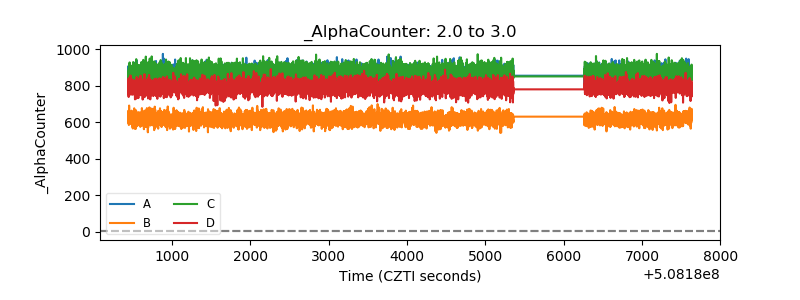 |
| _CPM_Rate | 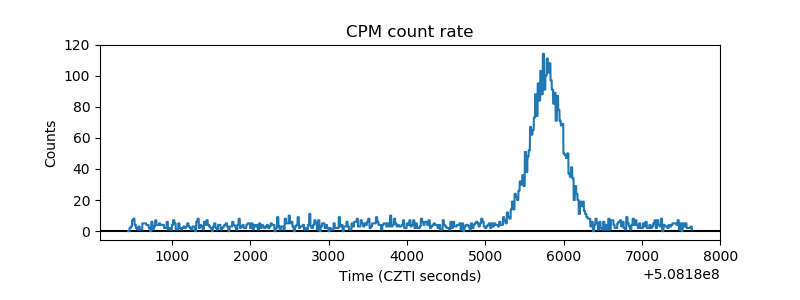 |
| CZT Counter | 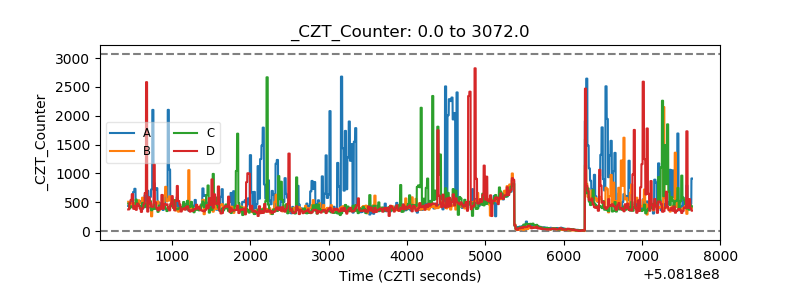 |
| +2.5 Volts monitor |  |
| +5 Volts monitor |  |
| _ROLL_ROT | 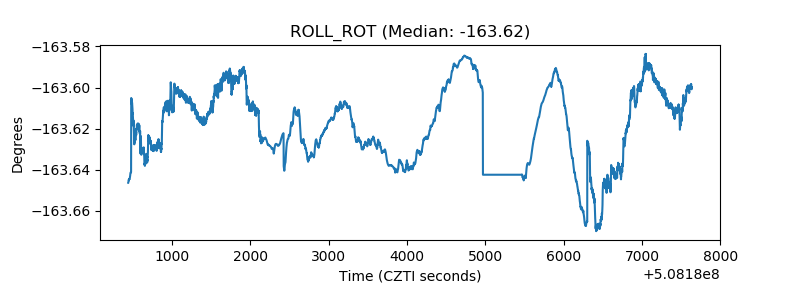 |
| _Roll_DEC | 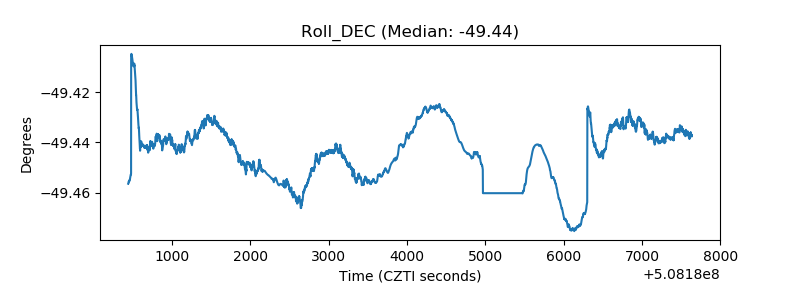 |
| _Roll_RA | 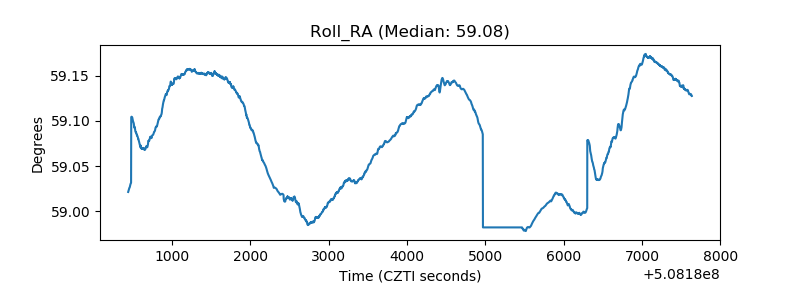 |
| Veto Counter | 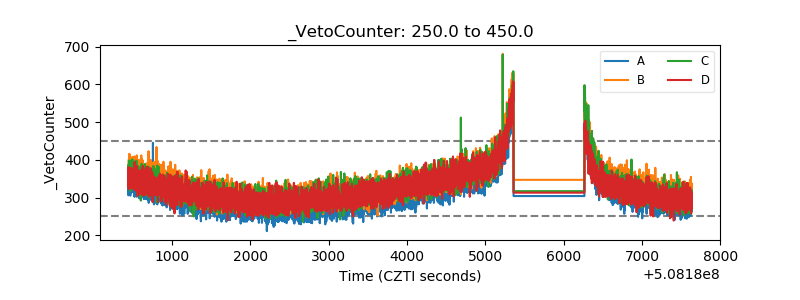 |