| Param | Original file | Final file |
|---|---|---|
| Filename | modeM0/AS1A14_083T03_9000006548_56074cztM0_level2.fits | modeM0/AS1A14_083T03_9000006548_56074cztM0_level2_quad_clean.evt |
| Size (bytes) | 431,599,680 | 102,585,600 |
| Size | 411.6 MB | 97.8 MB |
| Events in quadrant A | 4,259,256 | 657,523 |
| Events in quadrant B | 3,842,421 | 715,210 |
| Events in quadrant C | 3,652,087 | 638,143 |
| Events in quadrant D | 3,660,189 | 591,409 |
| Mode M0 | |||
|---|---|---|---|
| Quadrant | BADHDUFLAG | Total packets | Discarded packets |
| A | 0 | 17994 | 2 |
| B | 0 | 16786 | 2 |
| C | 0 | 16311 | 2 |
| D | 0 | 16503 | 2 |
| Mode SS | |||
|---|---|---|---|
| Quadrant | BADHDUFLAG | Total packets | Discarded packets |
| A | 0 | 148 | 0 |
| B | 0 | 148 | 0 |
| C | 0 | 148 | 0 |
| D | 0 | 148 | 0 |
| Mode M9 | |||
|---|---|---|---|
| Quadrant | BADHDUFLAG | Total packets | Discarded packets |
| A | 0 | 11 | 0 |
| B | 0 | 12 | 0 |
| C | 0 | 12 | 0 |
| D | 0 | 12 | 0 |
| Quadrant | Total seconds | Saturated seconds | Saturation percentage |
|---|---|---|---|
| A | 7230 | 254 | 3.513140% |
| B | 7229 | 178 | 2.462305% |
| C | 7229 | 56 | 0.774658% |
| D | 7229 | 110 | 1.521649% |
Noise dominated data is calculated using 1-second bins in cleaned event files. If a bin has >2000 counts, and if more than 50% of those come from <1% of pixels, then it is considered to be noise-dominated and hence unusable.
| Quadrant | # 1 sec bins | Bins with >0 counts | Bins with >2000 counts | High rate bins dominated by noise | Noise dominated (total time) | Noise dominated (detector-on time) | Marked lightcurve |
|---|---|---|---|---|---|---|---|
| A | 7655 | 7231 | 178 | 178 | 2.33% | 2.46% | 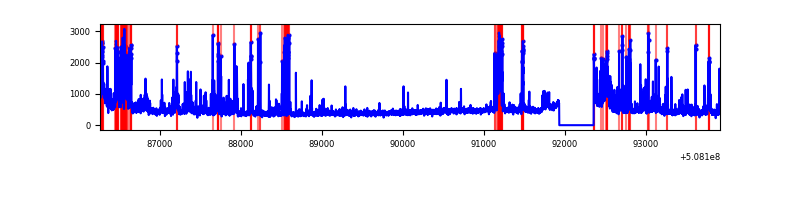 |
| B | 7654 | 7229 | 82 | 82 | 1.07% | 1.13% | 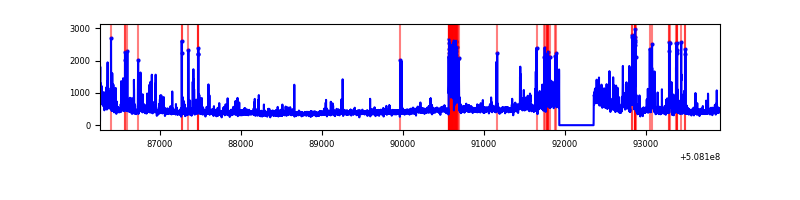 |
| C | 7654 | 7230 | 50 | 50 | 0.65% | 0.69% | 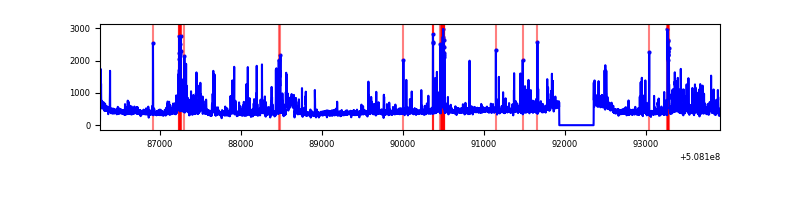 |
| D | 7654 | 7230 | 117 | 117 | 1.53% | 1.62% | 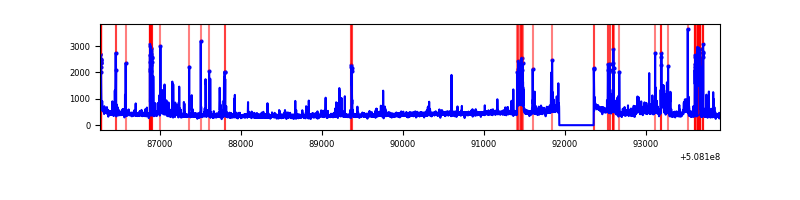 |
Top three noisy pixels from each quadrant. If the there are fewer than three noisy pixels in the level2.evt file, extra rows are filled as -1
| Pixel properties | Quadrant properties | ||||||
|---|---|---|---|---|---|---|---|
| Quadrant | DetID | PixID | Counts | Sigma | Mean | Median | Sigma |
| A | 15 | 32 | 847679 | 4562.56 | 747 | 728 | 185.6 |
| A | 3 | 14 | 138038 | 739.7 | 747 | 728 | 185.6 |
| A | 0 | 8 | 127721 | 684.12 | 747 | 728 | 185.6 |
| B | 0 | 231 | 183165 | 1151.12 | 749 | 724 | 158.5 |
| B | 2 | 249 | 180877 | 1136.69 | 749 | 724 | 158.5 |
| B | 0 | 171 | 98900 | 619.45 | 749 | 724 | 158.5 |
| C | 15 | 147 | 340179 | 1701.93 | 728 | 721 | 199.5 |
| C | 13 | 3 | 137770 | 687.12 | 728 | 721 | 199.5 |
| C | 12 | 252 | 136276 | 679.63 | 728 | 721 | 199.5 |
| D | 3 | 12 | 166844 | 823.23 | 719 | 686 | 201.8 |
| D | 8 | 240 | 113459 | 558.74 | 719 | 686 | 201.8 |
| D | 12 | 33 | 99774 | 490.93 | 719 | 686 | 201.8 |
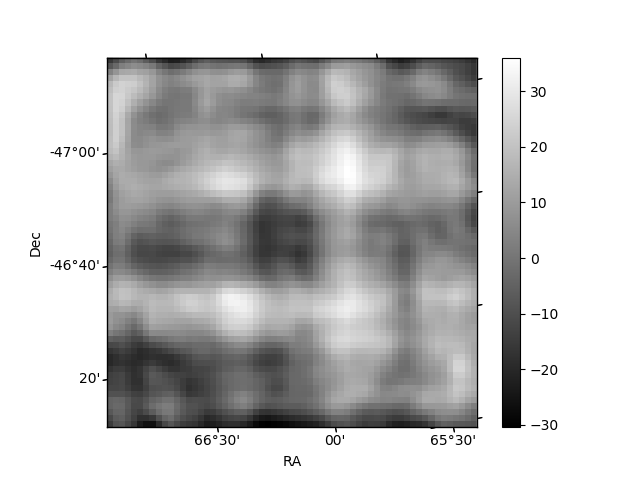
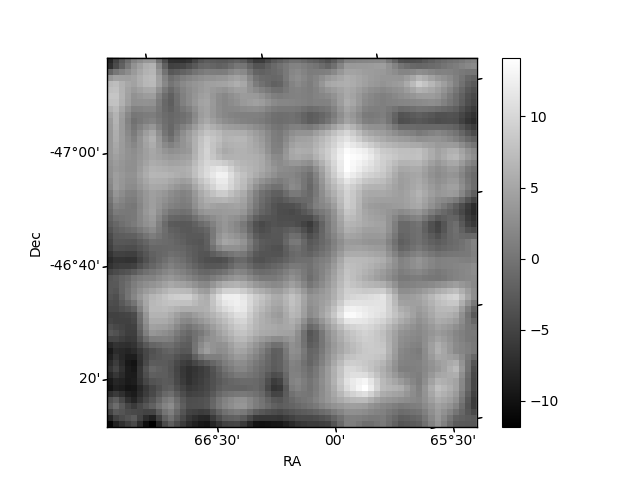
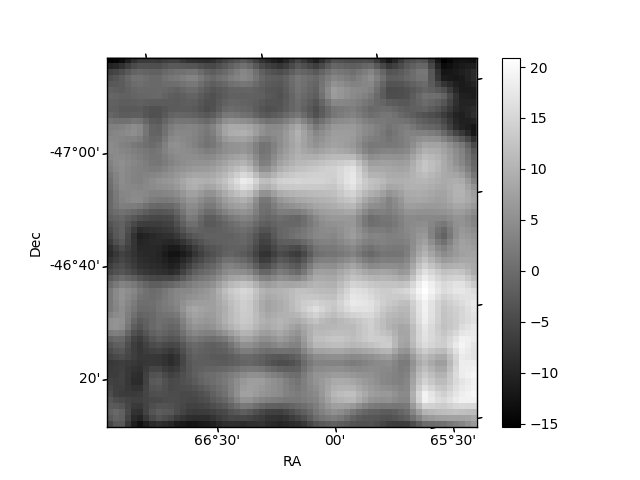
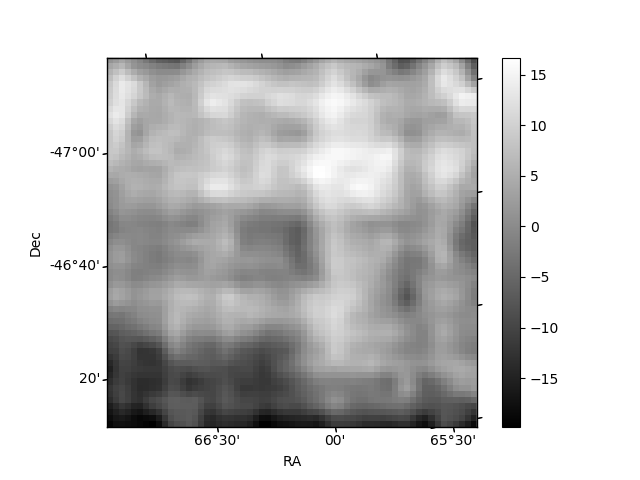
Histogram calculated using DETX and DETY for each event in the final _common_clean file
| Quadrant A | 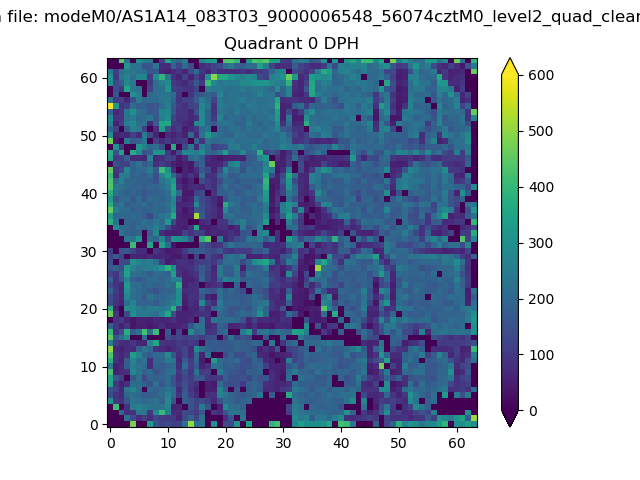 |
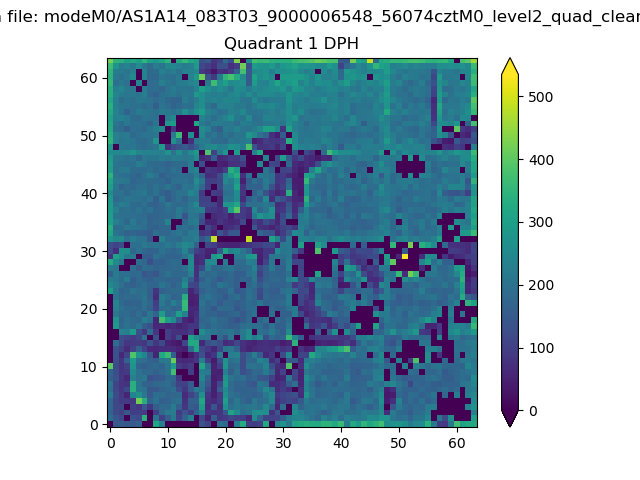 |
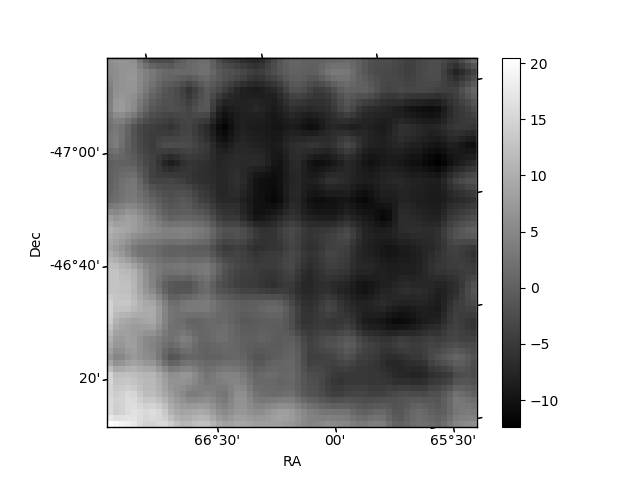
Quadrant B |
|---|---|---|---|
| Quadrant D | 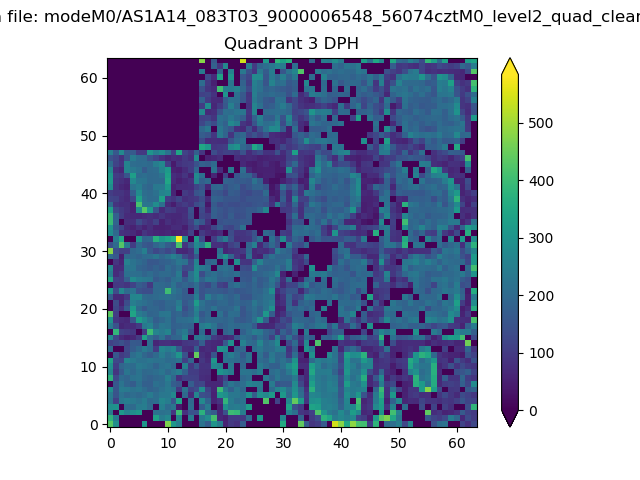 |
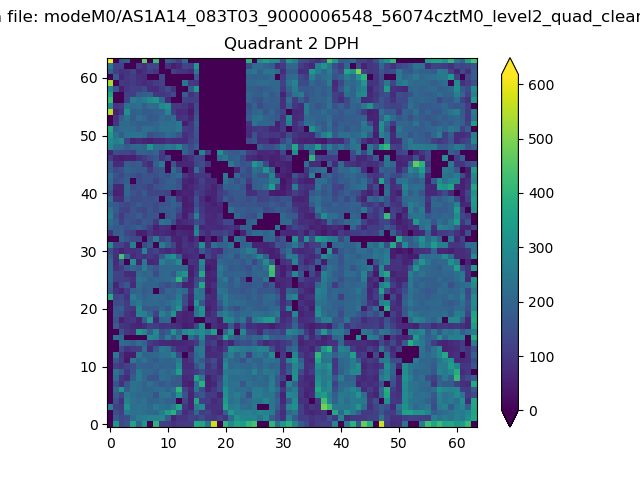 |
Quadrant C |
| Plot type | Count rate plots | Images |
|---|---|---|
| Comparison with Poisson distribution Blue bars denote a histogram of data divided into 1 sec bins. Red curve is a Poisson curve with rate = median count rate of data. |
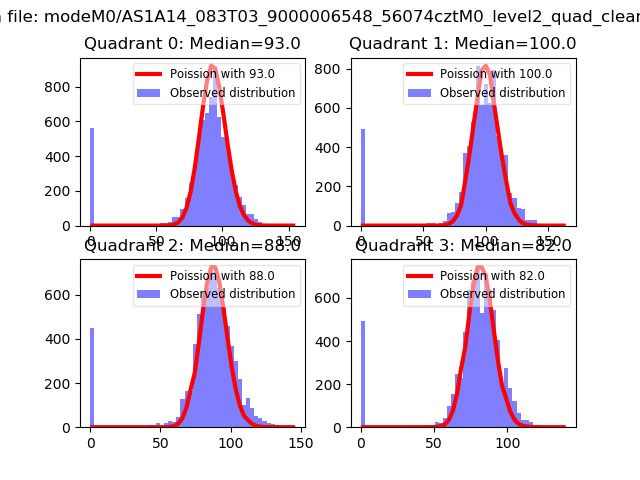 |
 |
| Quadrant-wise count rates Data is divided into 100 sec bins |
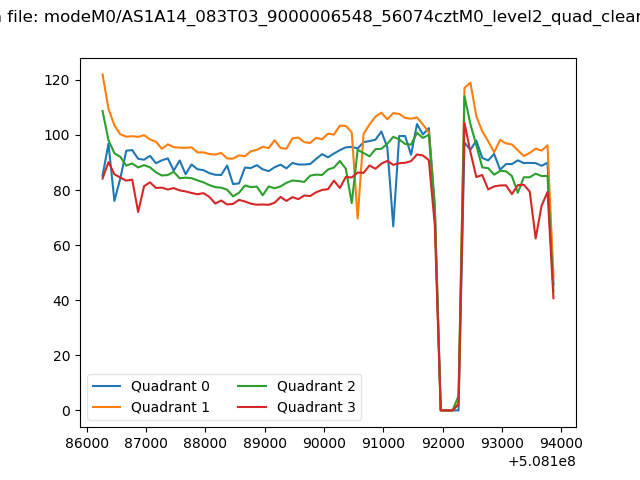 |
|
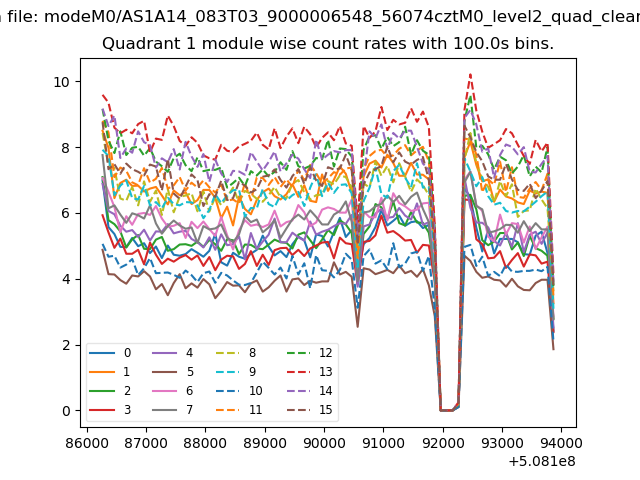
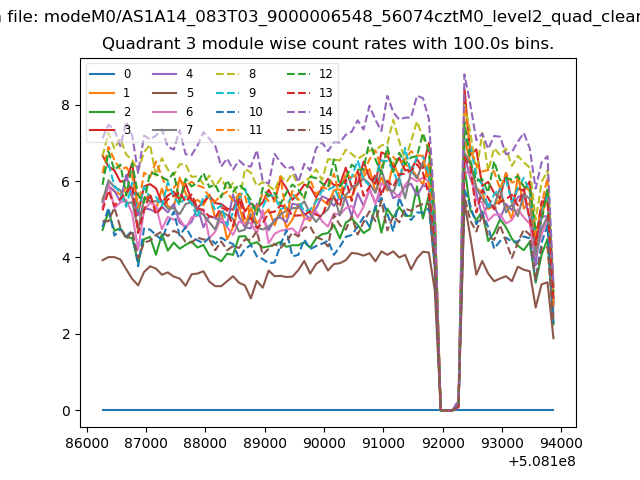
| Module-wise count rates for Quadrant A Data is divided into 100 sec bins |
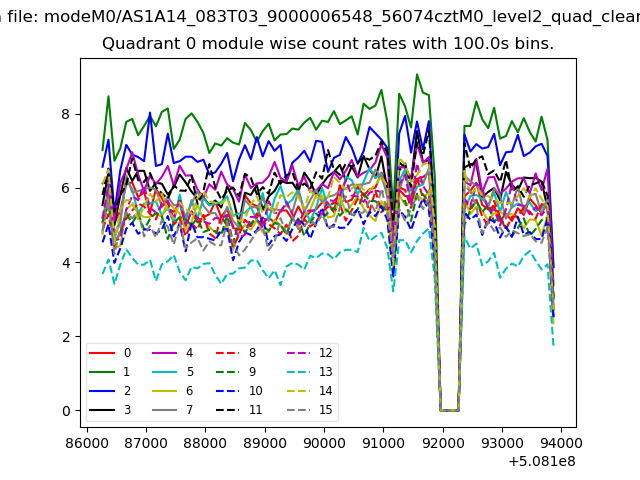 |
 |
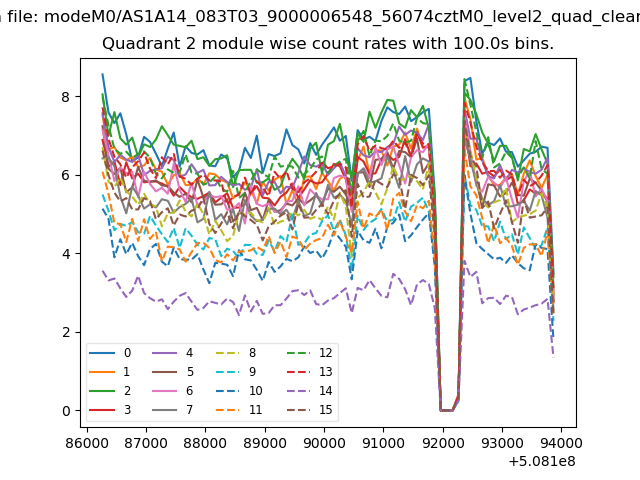
| Module-wise count rates for Quadrant B Data is divided into 100 sec bins |
 |
 |
| Module-wise count rates for Quadrant C Data is divided into 100 sec bins |
 |
 |
| Module-wise count rates for Quadrant D Data is divided into 100 sec bins |
 |
 |
| Parameter | Plot |
|---|---|
| CZT HV Monitor | 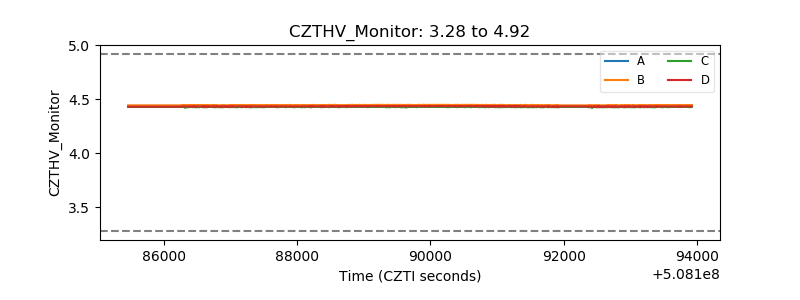 |
| D_VDD | 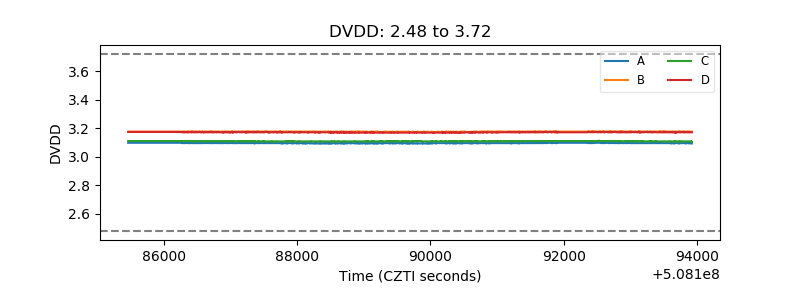 |
| Temperature 1 | 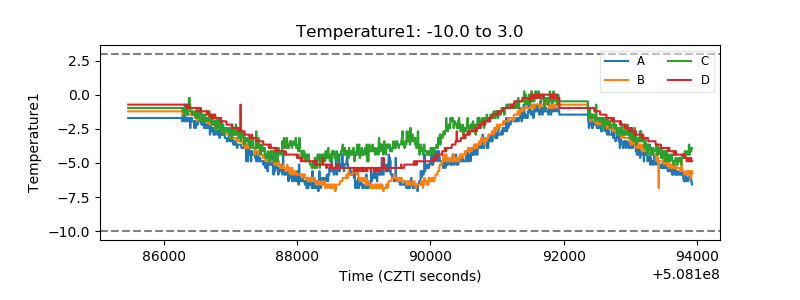 |
| Veto HV Monitor | 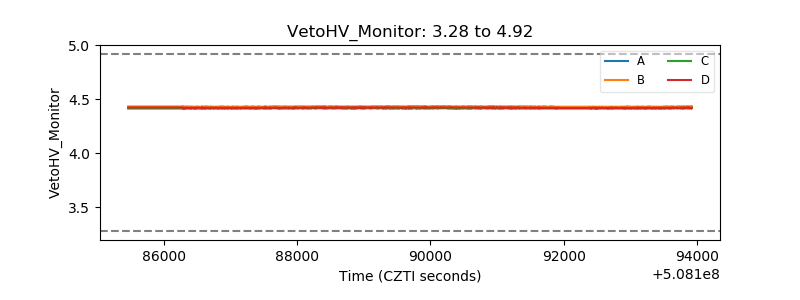 |
| Veto LLD | 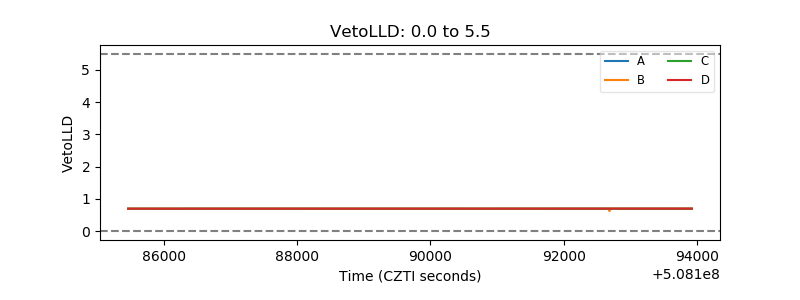 |
| Alpha Counter | 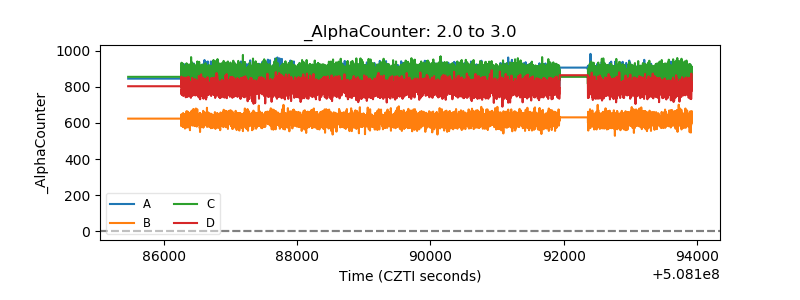 |
| _CPM_Rate | 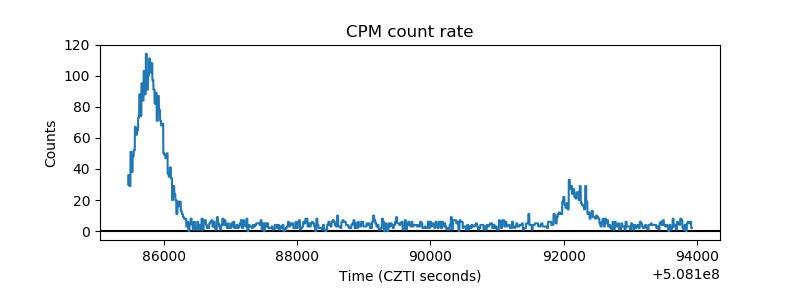 |
| CZT Counter | 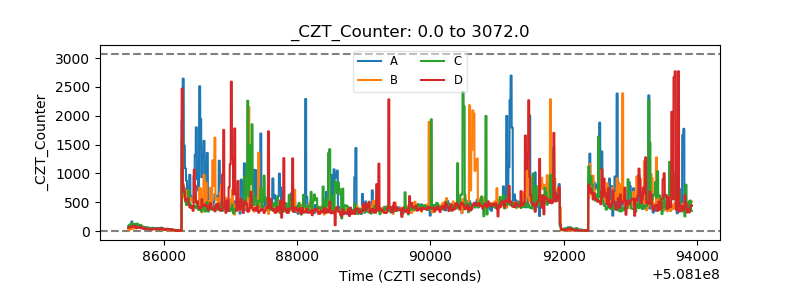 |
| +2.5 Volts monitor |  |
| +5 Volts monitor |  |
| _ROLL_ROT | 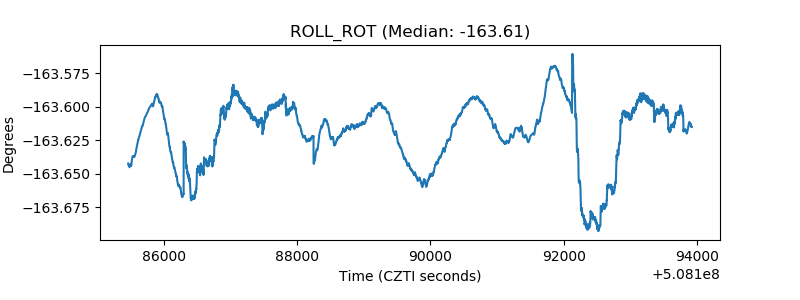 |
| _Roll_DEC | 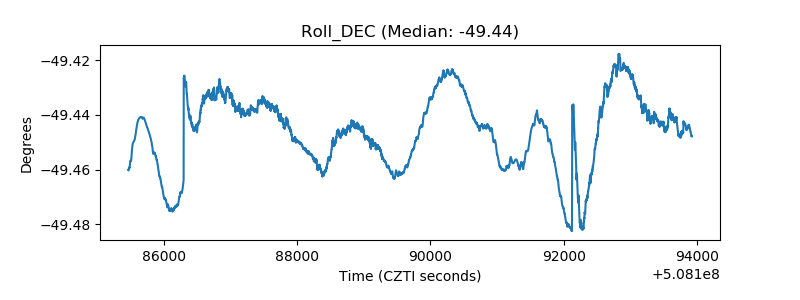 |
| _Roll_RA | 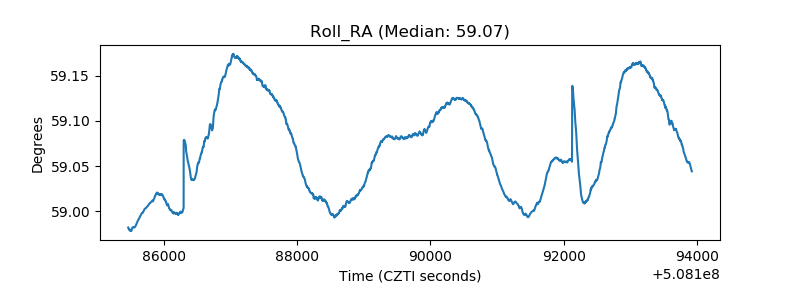 |
| Veto Counter | 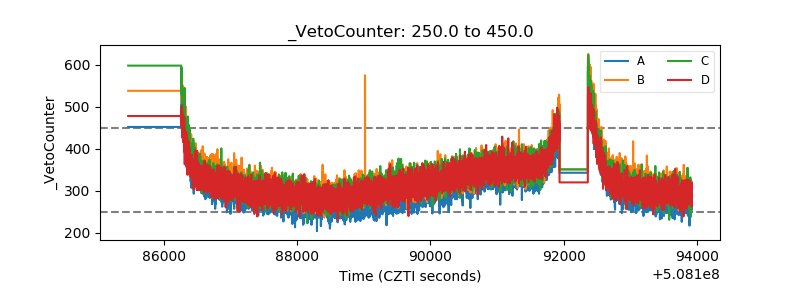 |