| Param | Original file | Final file |
|---|---|---|
| Filename | modeM0/AS1A14_083T03_9000006548_56075cztM0_level2.fits | modeM0/AS1A14_083T03_9000006548_56075cztM0_level2_quad_clean.evt |
| Size (bytes) | 508,567,680 | 107,688,960 |
| Size | 485.0 MB | 102.7 MB |
| Events in quadrant A | 4,634,609 | 691,757 |
| Events in quadrant B | 3,846,509 | 767,633 |
| Events in quadrant C | 4,085,551 | 670,337 |
| Events in quadrant D | 5,657,560 | 592,495 |
| Mode M0 | |||
|---|---|---|---|
| Quadrant | BADHDUFLAG | Total packets | Discarded packets |
| A | 0 | 19700 | 0 |
| B | 0 | 17038 | 1 |
| C | 0 | 17906 | 0 |
| D | 0 | 22618 | 0 |
| Mode SS | |||
|---|---|---|---|
| Quadrant | BADHDUFLAG | Total packets | Discarded packets |
| A | 0 | 156 | 0 |
| B | 0 | 156 | 0 |
| C | 0 | 156 | 0 |
| D | 0 | 156 | 0 |
| Quadrant | Total seconds | Saturated seconds | Saturation percentage |
|---|---|---|---|
| A | 7735 | 335 | 4.330963% |
| B | 7735 | 58 | 0.749838% |
| C | 7735 | 129 | 1.667744% |
| D | 7735 | 612 | 7.912088% |
Noise dominated data is calculated using 1-second bins in cleaned event files. If a bin has >2000 counts, and if more than 50% of those come from <1% of pixels, then it is considered to be noise-dominated and hence unusable.
| Quadrant | # 1 sec bins | Bins with >0 counts | Bins with >2000 counts | High rate bins dominated by noise | Noise dominated (total time) | Noise dominated (detector-on time) | Marked lightcurve |
|---|---|---|---|---|---|---|---|
| A | 7735 | 7735 | 268 | 268 | 3.46% | 3.46% | 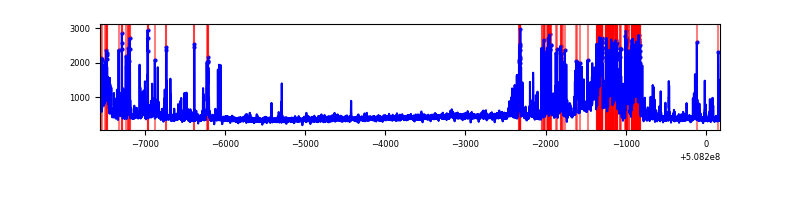 |
| B | 7735 | 7735 | 36 | 36 | 0.47% | 0.47% | 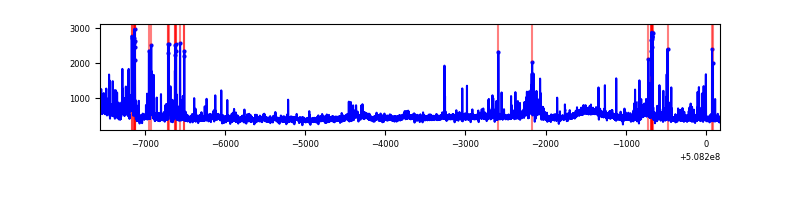 |
| C | 7735 | 7735 | 102 | 102 | 1.32% | 1.32% | 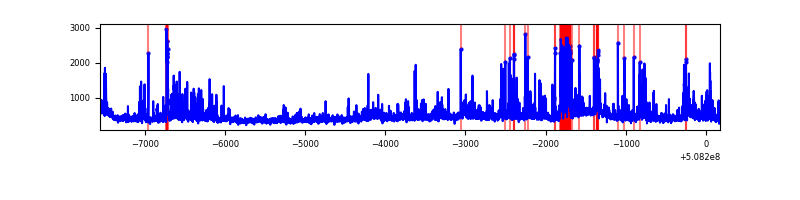 |
| D | 7735 | 7735 | 535 | 535 | 6.92% | 6.92% | 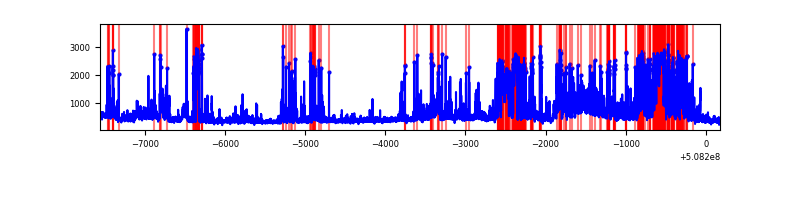 |
Top three noisy pixels from each quadrant. If the there are fewer than three noisy pixels in the level2.evt file, extra rows are filled as -1
| Pixel properties | Quadrant properties | ||||||
|---|---|---|---|---|---|---|---|
| Quadrant | DetID | PixID | Counts | Sigma | Mean | Median | Sigma |
| A | 15 | 32 | 1101986 | 5630.78 | 792 | 771 | 195.6 |
| A | 0 | 8 | 224137 | 1142.13 | 792 | 771 | 195.6 |
| A | 3 | 94 | 55896 | 281.87 | 792 | 771 | 195.6 |
| B | 0 | 171 | 119352 | 696.98 | 802 | 775 | 170.1 |
| B | 10 | 247 | 112103 | 654.37 | 802 | 775 | 170.1 |
| B | 7 | 252 | 82058 | 477.77 | 802 | 775 | 170.1 |
| C | 15 | 230 | 376788 | 1774.09 | 777 | 769 | 212.0 |
| C | 12 | 252 | 262439 | 1234.58 | 777 | 769 | 212.0 |
| C | 15 | 147 | 127671 | 598.73 | 777 | 769 | 212.0 |
| D | 11 | 129 | 924198 | 4434.1 | 739 | 707 | 208.3 |
| D | 2 | 120 | 589131 | 2825.29 | 739 | 707 | 208.3 |
| D | 3 | 12 | 305386 | 1462.9 | 739 | 707 | 208.3 |
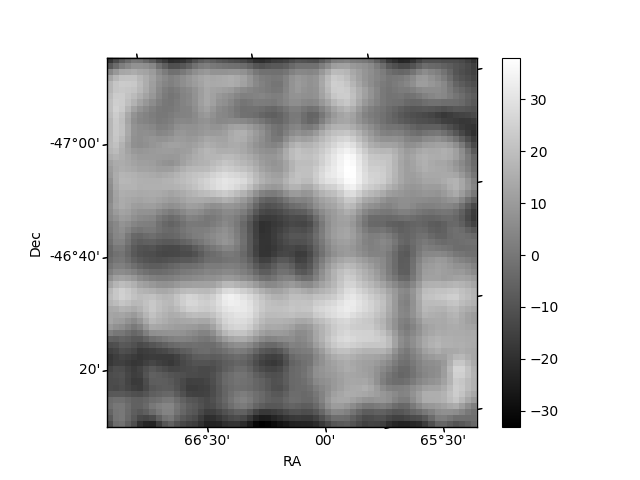
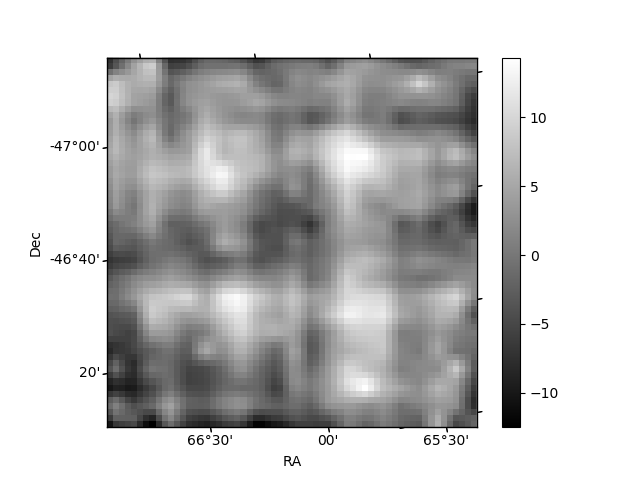
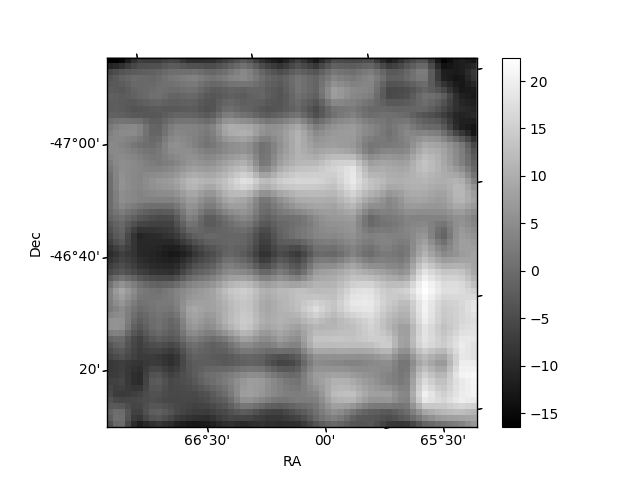
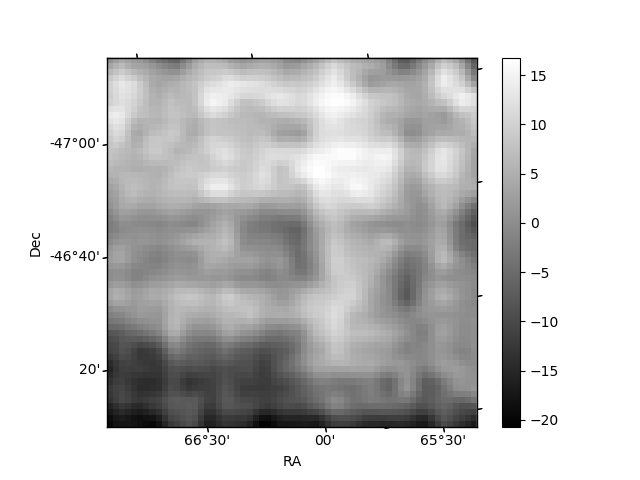
Histogram calculated using DETX and DETY for each event in the final _common_clean file
| Quadrant A | 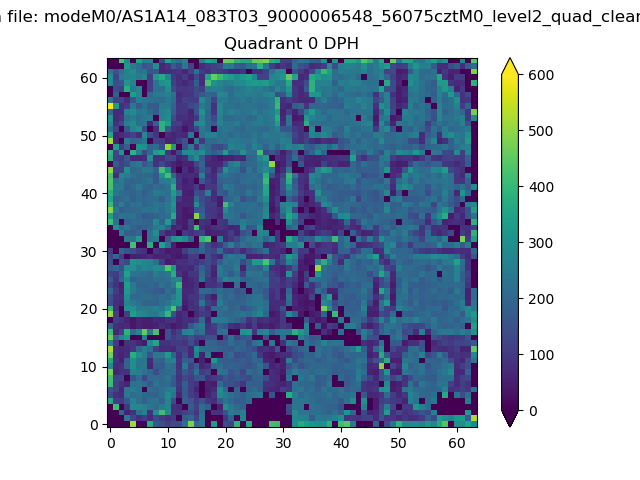 |
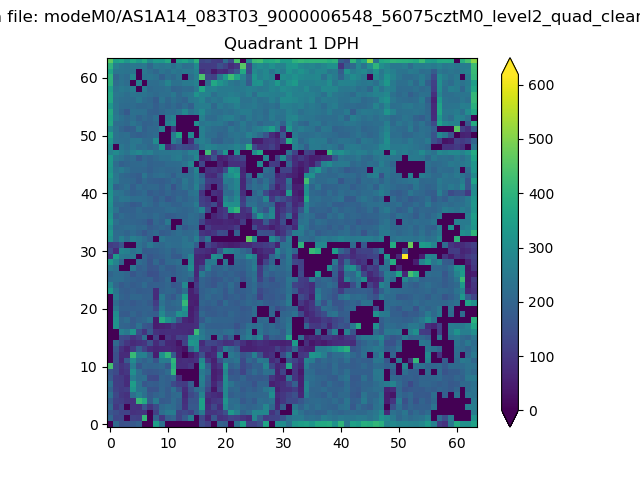 |
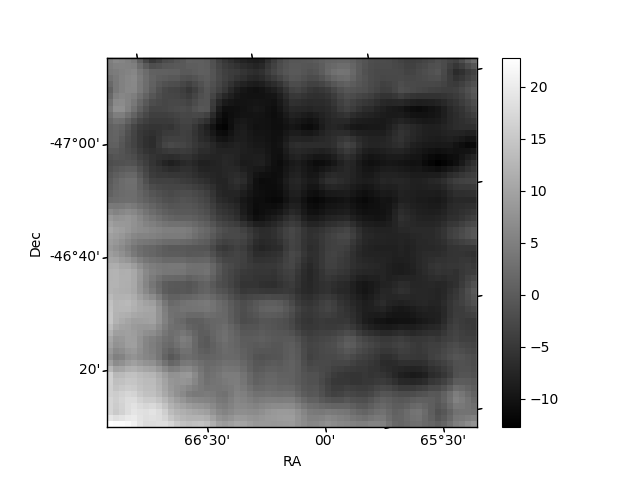
Quadrant B |
|---|---|---|---|
| Quadrant D | 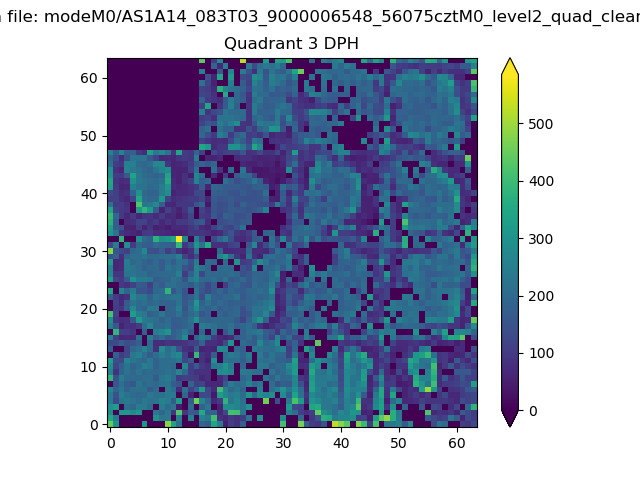 |
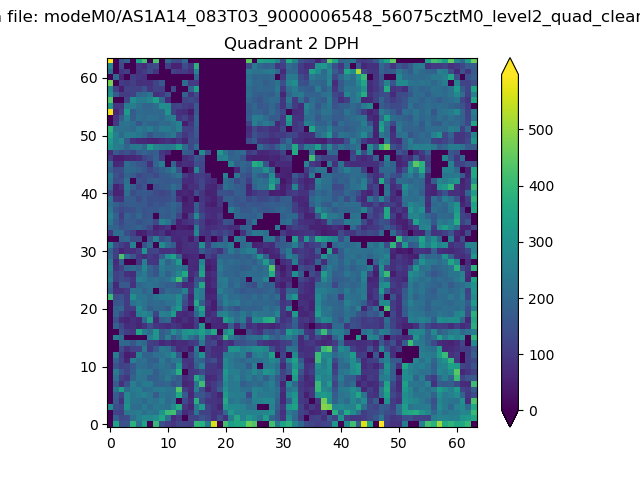 |
Quadrant C |
| Plot type | Count rate plots | Images |
|---|---|---|
| Comparison with Poisson distribution Blue bars denote a histogram of data divided into 1 sec bins. Red curve is a Poisson curve with rate = median count rate of data. |
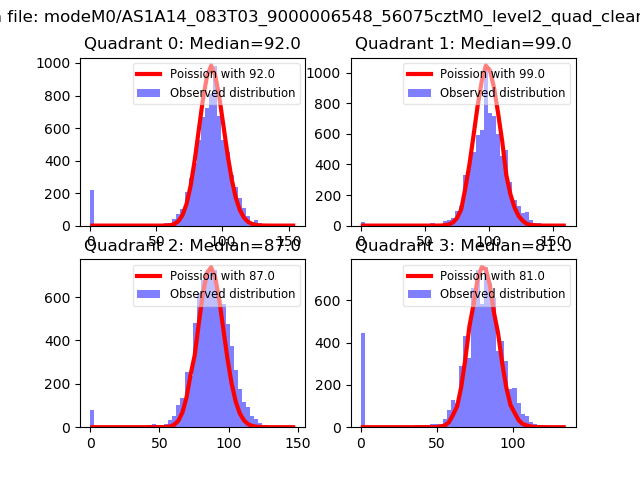 |
 |
| Quadrant-wise count rates Data is divided into 100 sec bins |
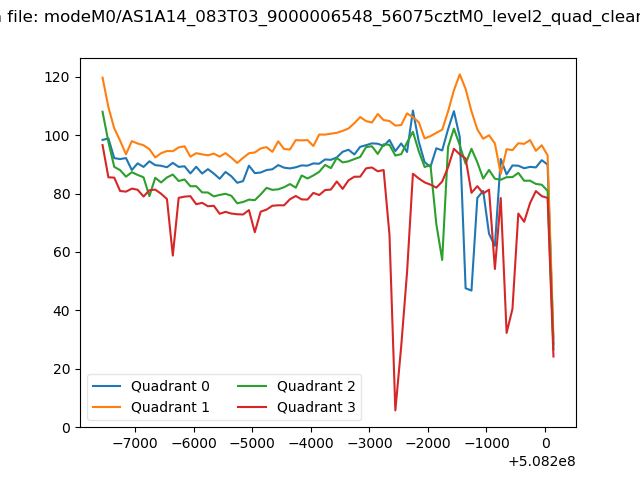 |
|
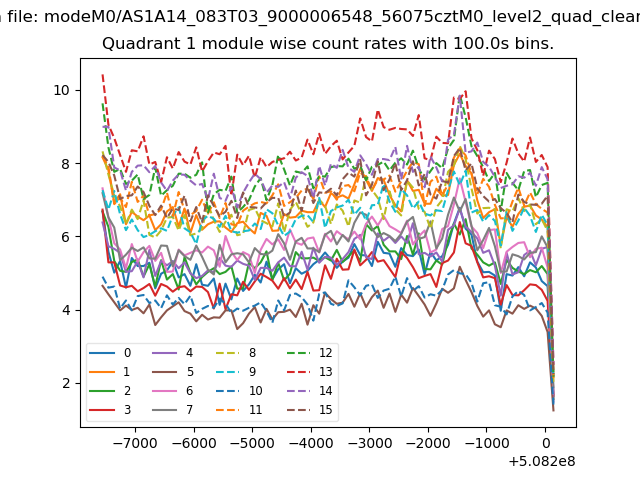
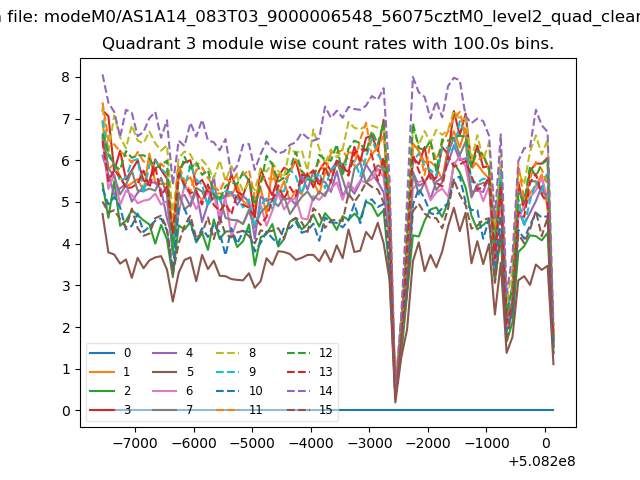
| Module-wise count rates for Quadrant A Data is divided into 100 sec bins |
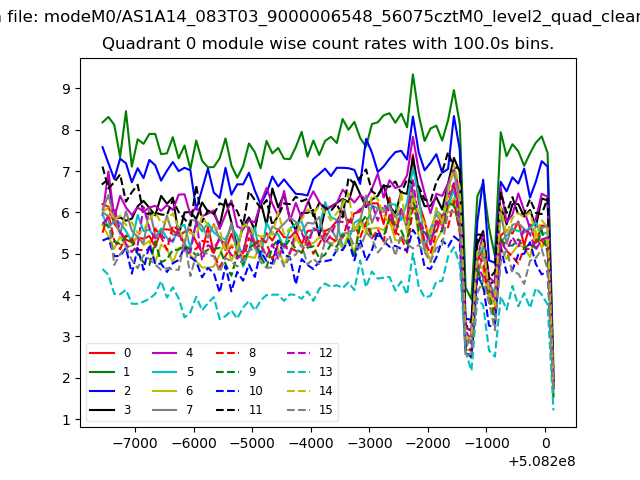 |
 |
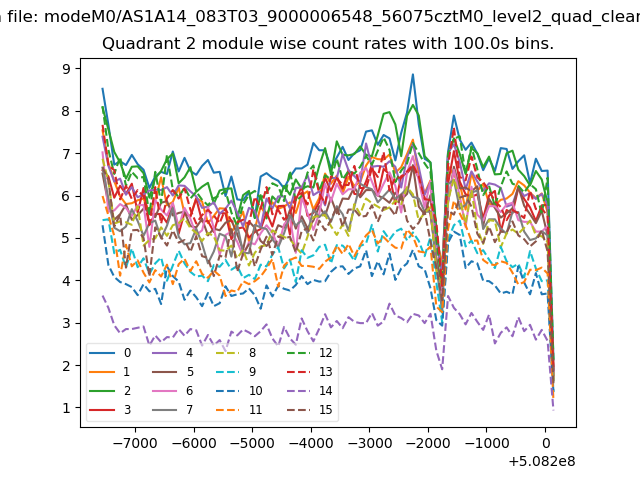
| Module-wise count rates for Quadrant B Data is divided into 100 sec bins |
 |
 |
| Module-wise count rates for Quadrant C Data is divided into 100 sec bins |
 |
 |
| Module-wise count rates for Quadrant D Data is divided into 100 sec bins |
 |
 |
| Parameter | Plot |
|---|---|
| CZT HV Monitor | 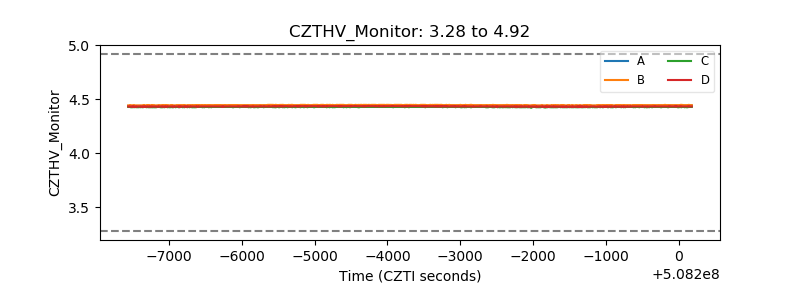 |
| D_VDD | 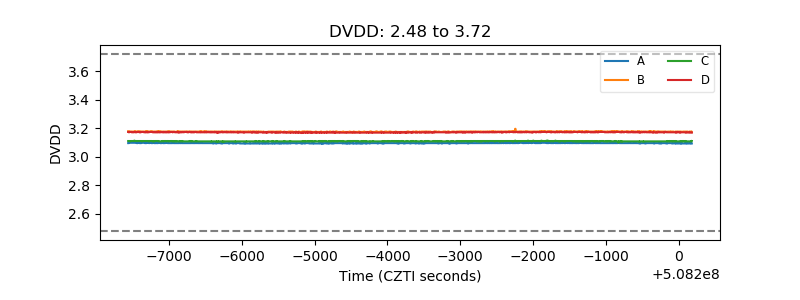 |
| Temperature 1 | 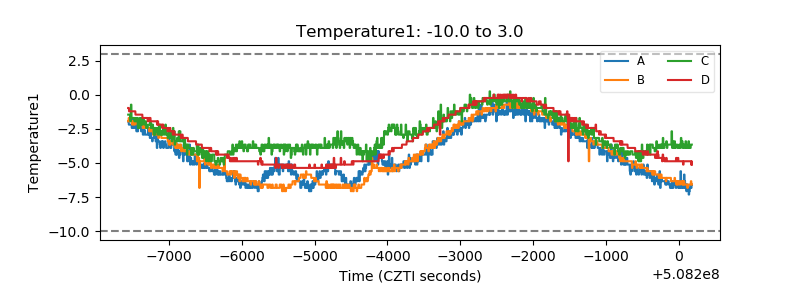 |
| Veto HV Monitor | 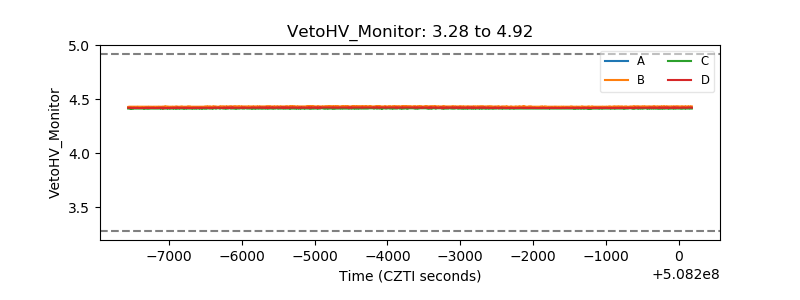 |
| Veto LLD | 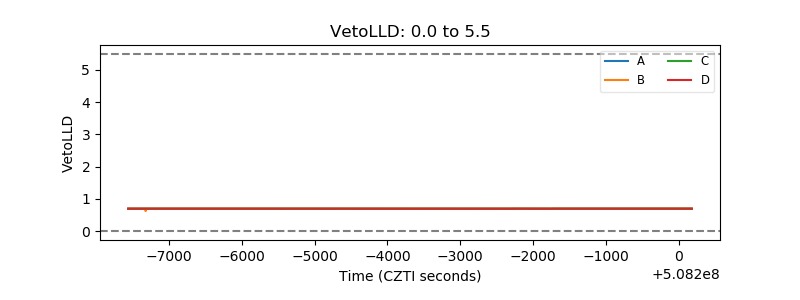 |
| Alpha Counter | 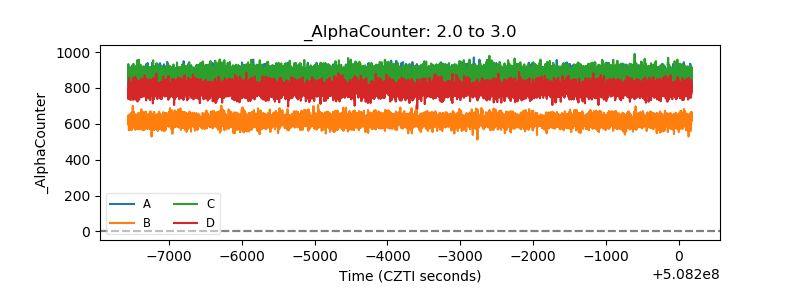 |
| _CPM_Rate | 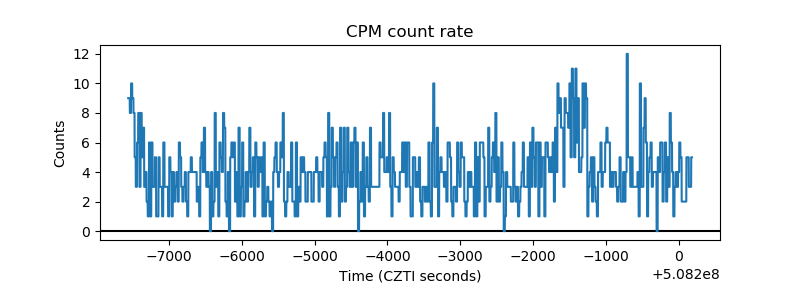 |
| CZT Counter | 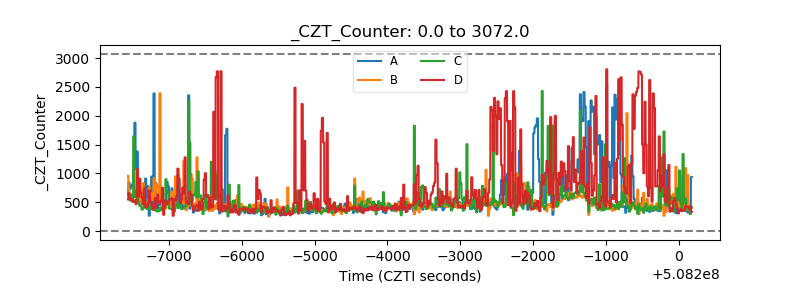 |
| +2.5 Volts monitor |  |
| +5 Volts monitor |  |
| _ROLL_ROT | 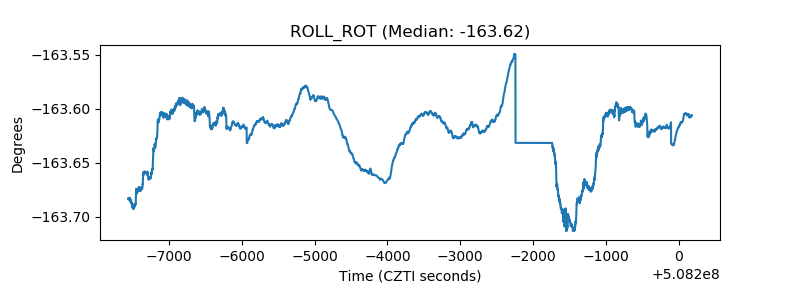 |
| _Roll_DEC | 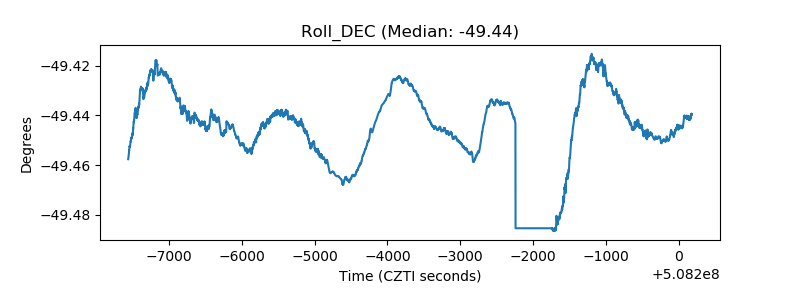 |
| _Roll_RA | 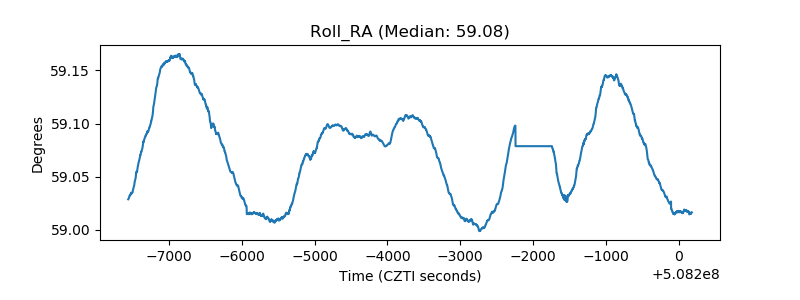 |
| Veto Counter | 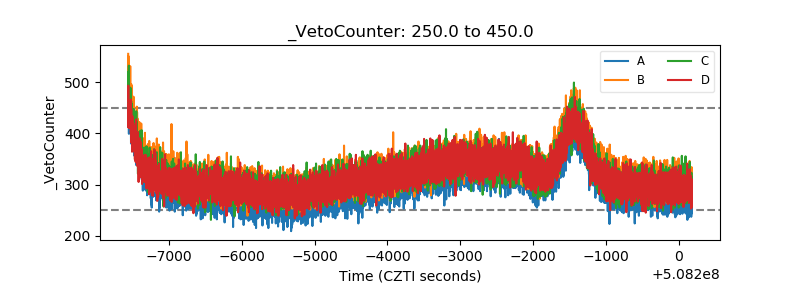 |