| Param | Original file | Final file |
|---|---|---|
| Filename | modeM0/AS1A14_083T03_9000006548_56076cztM0_level2.fits | modeM0/AS1A14_083T03_9000006548_56076cztM0_level2_quad_clean.evt |
| Size (bytes) | 580,682,880 | 117,100,800 |
| Size | 553.8 MB | 111.7 MB |
| Events in quadrant A | 5,143,734 | 753,689 |
| Events in quadrant B | 4,075,885 | 838,882 |
| Events in quadrant C | 4,467,799 | 733,282 |
| Events in quadrant D | 7,151,332 | 632,135 |
| Mode M0 | |||
|---|---|---|---|
| Quadrant | BADHDUFLAG | Total packets | Discarded packets |
| A | 0 | 21584 | 0 |
| B | 0 | 18437 | 0 |
| C | 0 | 19442 | 0 |
| D | 0 | 27457 | 0 |
| Mode SS | |||
|---|---|---|---|
| Quadrant | BADHDUFLAG | Total packets | Discarded packets |
| A | 0 | 170 | 0 |
| B | 0 | 170 | 0 |
| C | 0 | 170 | 0 |
| D | 0 | 170 | 0 |
| Quadrant | Total seconds | Saturated seconds | Saturation percentage |
|---|---|---|---|
| A | 8454 | 370 | 4.376626% |
| B | 8454 | 66 | 0.780696% |
| C | 8454 | 107 | 1.265673% |
| D | 8454 | 809 | 9.569435% |
Noise dominated data is calculated using 1-second bins in cleaned event files. If a bin has >2000 counts, and if more than 50% of those come from <1% of pixels, then it is considered to be noise-dominated and hence unusable.
| Quadrant | # 1 sec bins | Bins with >0 counts | Bins with >2000 counts | High rate bins dominated by noise | Noise dominated (total time) | Noise dominated (detector-on time) | Marked lightcurve |
|---|---|---|---|---|---|---|---|
| A | 8454 | 8454 | 295 | 295 | 3.49% | 3.49% | 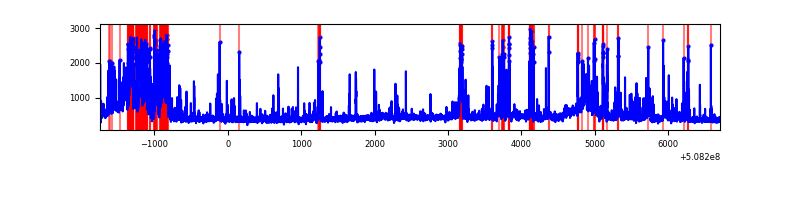 |
| B | 8454 | 8454 | 32 | 32 | 0.38% | 0.38% | 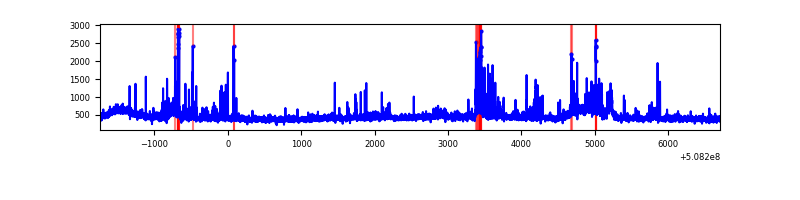 |
| C | 8454 | 8454 | 72 | 72 | 0.85% | 0.85% | 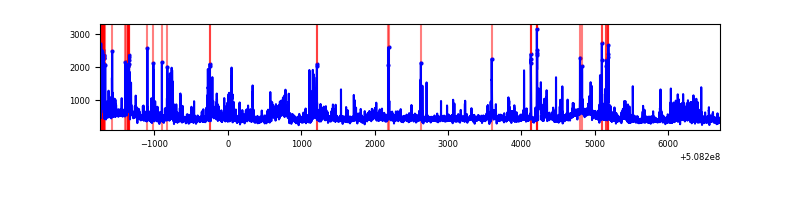 |
| D | 8454 | 8454 | 842 | 842 | 9.96% | 9.96% | 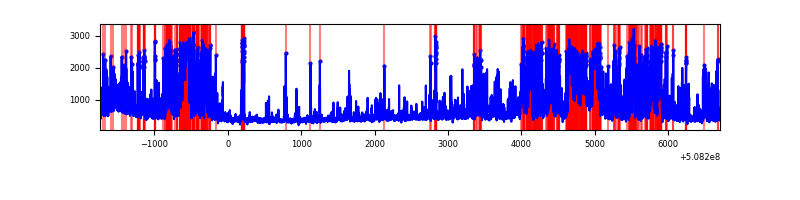 |
Top three noisy pixels from each quadrant. If the there are fewer than three noisy pixels in the level2.evt file, extra rows are filled as -1
| Pixel properties | Quadrant properties | ||||||
|---|---|---|---|---|---|---|---|
| Quadrant | DetID | PixID | Counts | Sigma | Mean | Median | Sigma |
| A | 15 | 32 | 1131992 | 5250.13 | 872 | 853 | 215.4 |
| A | 7 | 64 | 313114 | 1449.35 | 872 | 853 | 215.4 |
| A | 0 | 8 | 145266 | 670.29 | 872 | 853 | 215.4 |
| B | 5 | 185 | 125789 | 662.89 | 885 | 854 | 188.5 |
| B | 10 | 247 | 117605 | 619.46 | 885 | 854 | 188.5 |
| B | 7 | 252 | 71271 | 373.62 | 885 | 854 | 188.5 |
| C | 12 | 252 | 377339 | 1599.42 | 860 | 850 | 235.4 |
| C | 15 | 230 | 178845 | 756.17 | 860 | 850 | 235.4 |
| C | 9 | 38 | 139033 | 587.04 | 860 | 850 | 235.4 |
| D | 11 | 129 | 2834363 | 12300.86 | 819 | 782 | 230.4 |
| D | 8 | 240 | 277161 | 1199.79 | 819 | 782 | 230.4 |
| D | 8 | 129 | 221957 | 960.14 | 819 | 782 | 230.4 |
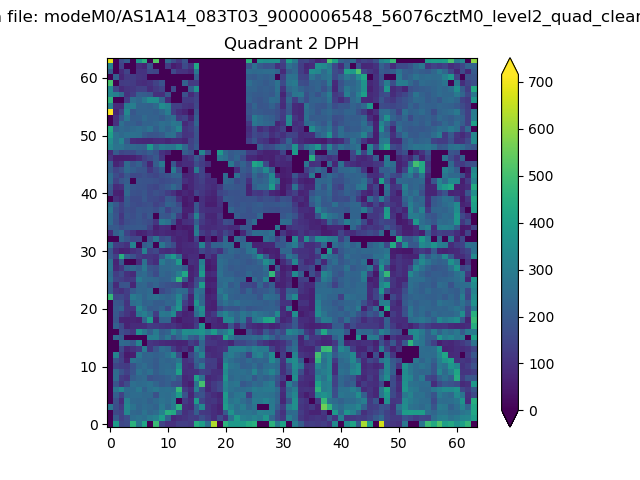
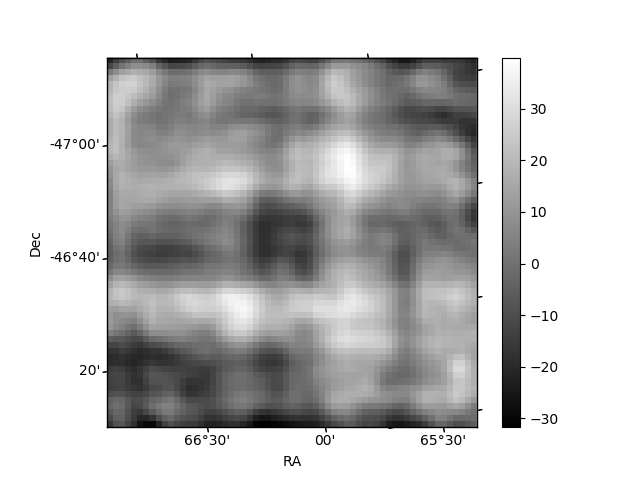
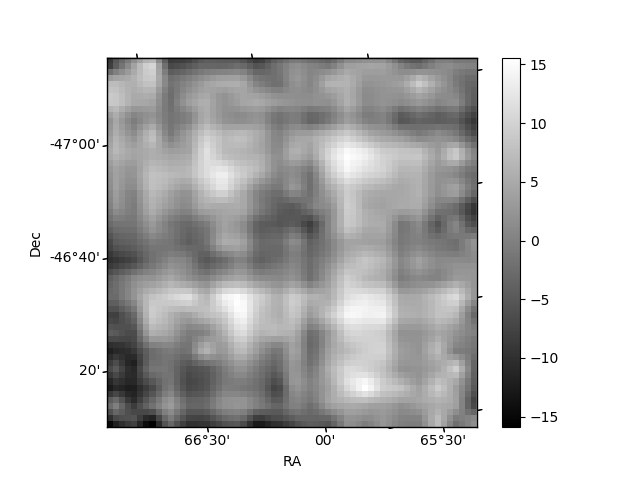
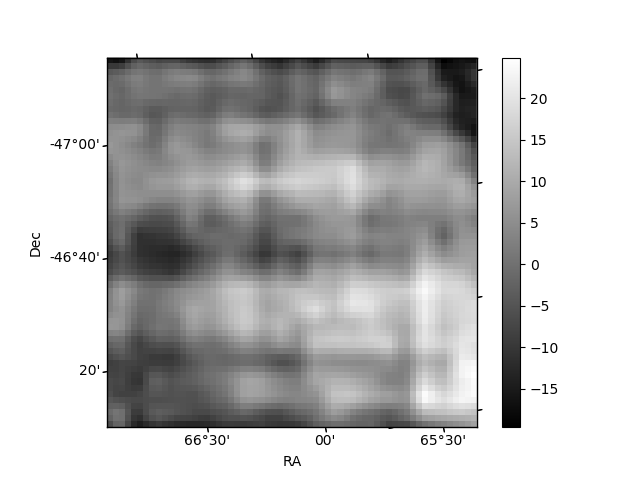
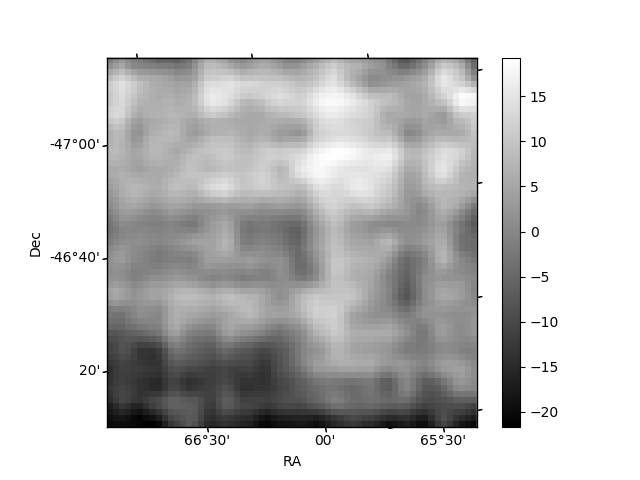
Histogram calculated using DETX and DETY for each event in the final _common_clean file
| Quadrant A | 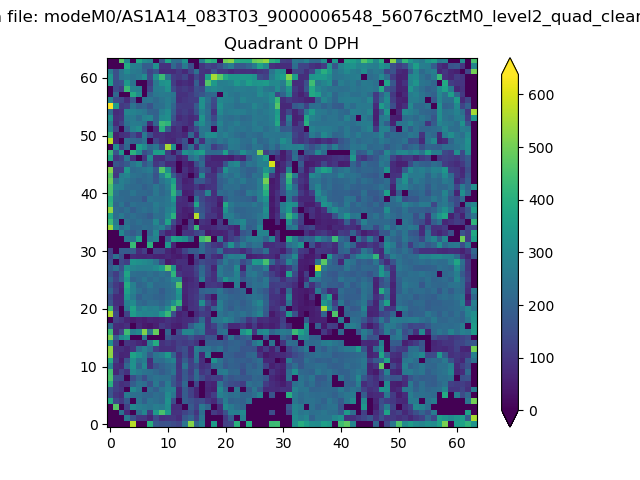 |
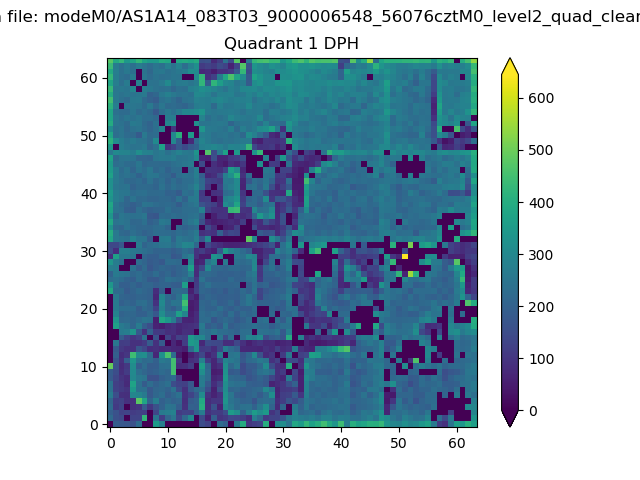 |
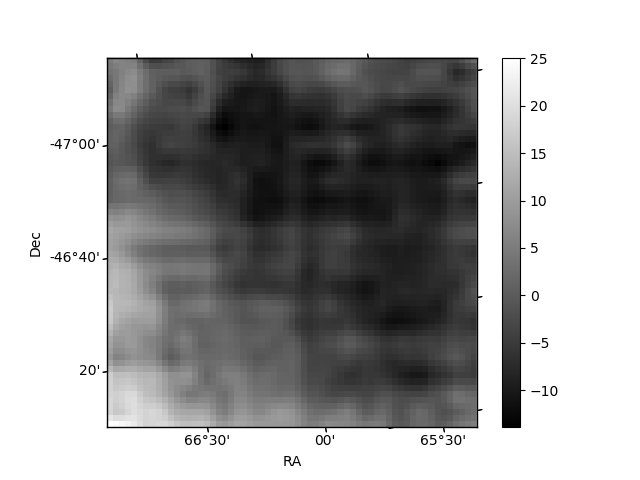
Quadrant B |
|---|---|---|---|
| Quadrant D | 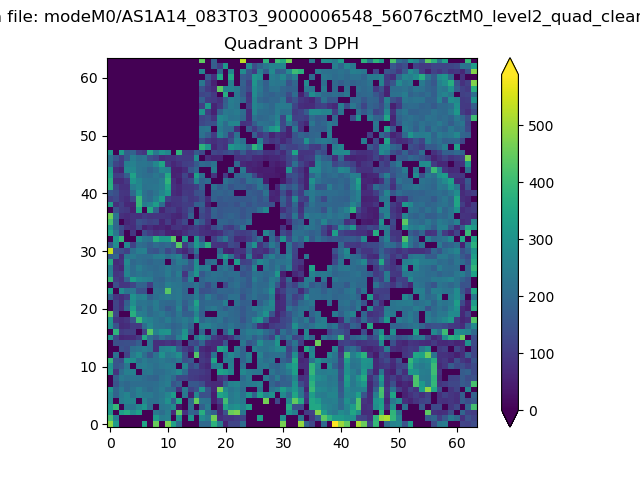 |
 |
Quadrant C |
| Plot type | Count rate plots | Images |
|---|---|---|
| Comparison with Poisson distribution Blue bars denote a histogram of data divided into 1 sec bins. Red curve is a Poisson curve with rate = median count rate of data. |
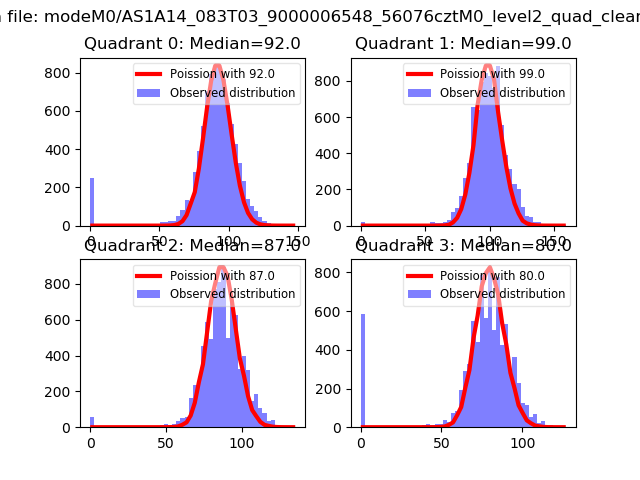 |
 |
| Quadrant-wise count rates Data is divided into 100 sec bins |
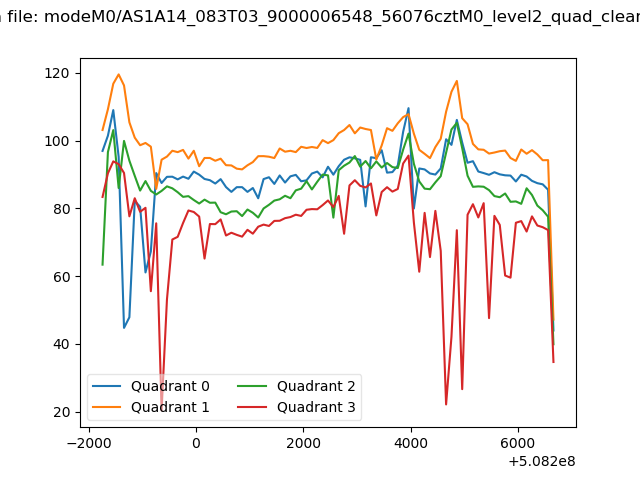 |
|
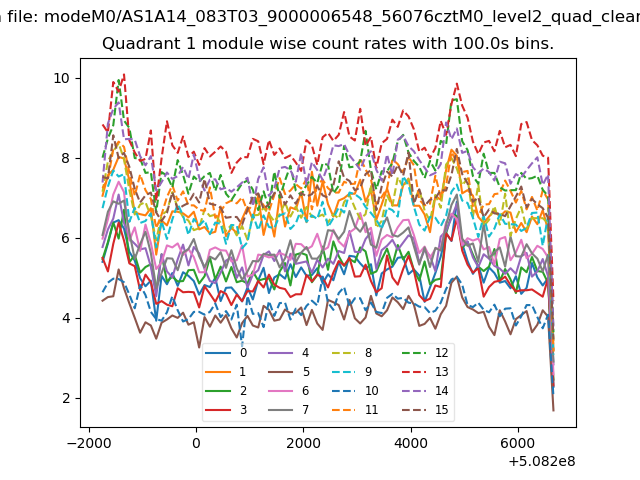
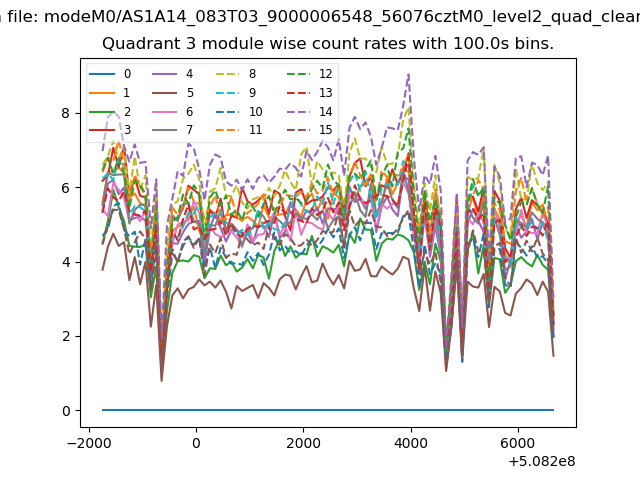
| Module-wise count rates for Quadrant A Data is divided into 100 sec bins |
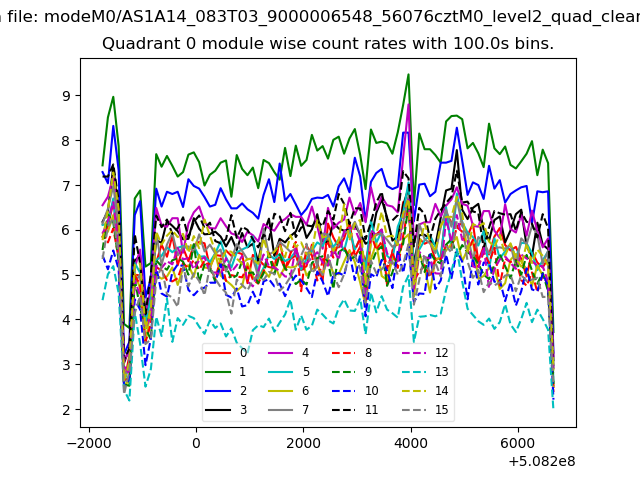 |
 |
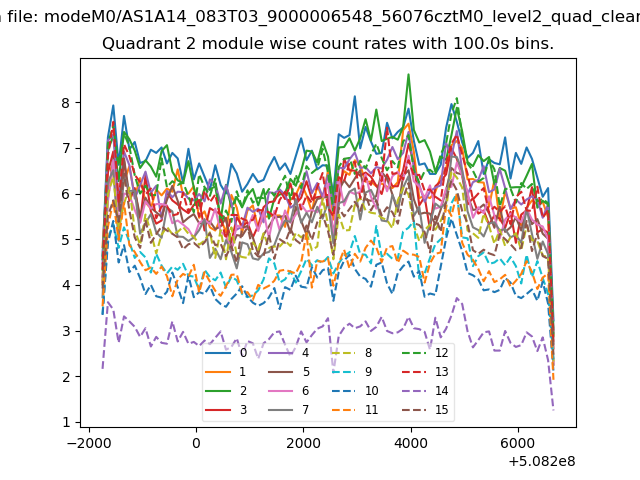
| Module-wise count rates for Quadrant B Data is divided into 100 sec bins |
 |
 |
| Module-wise count rates for Quadrant C Data is divided into 100 sec bins |
 |
 |
| Module-wise count rates for Quadrant D Data is divided into 100 sec bins |
 |
 |
| Parameter | Plot |
|---|---|
| CZT HV Monitor |  |
| D_VDD | 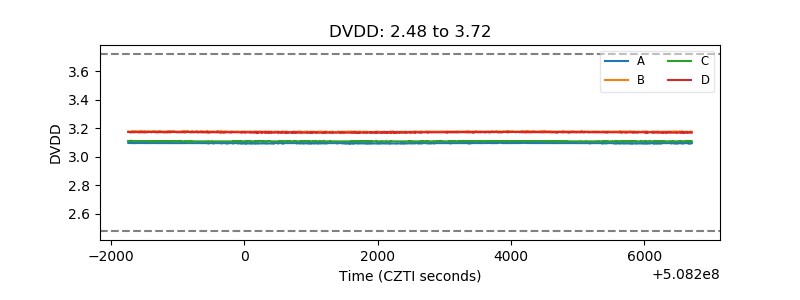 |
| Temperature 1 | 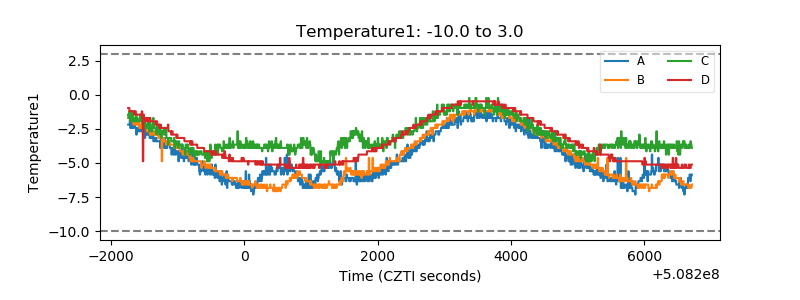 |
| Veto HV Monitor | 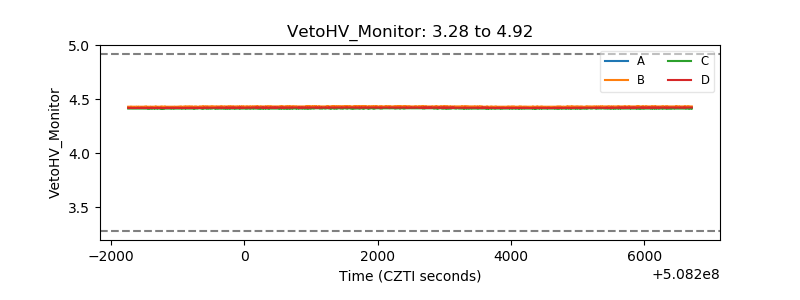 |
| Veto LLD | 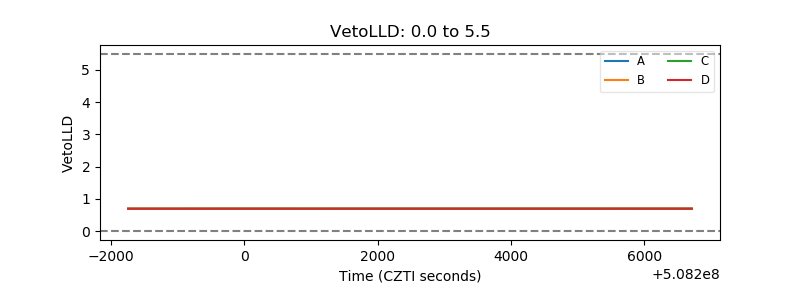 |
| Alpha Counter | 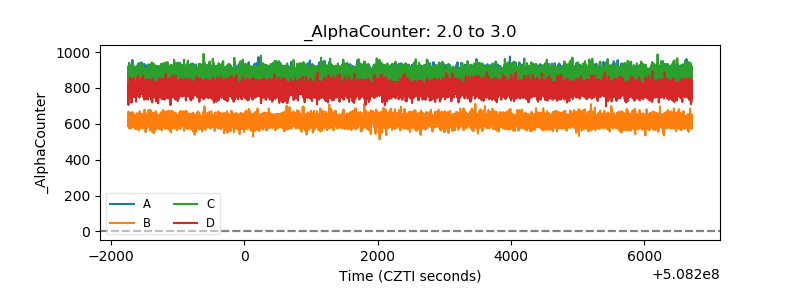 |
| _CPM_Rate | 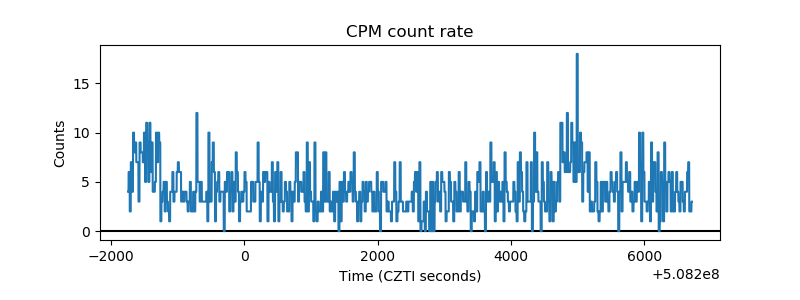 |
| CZT Counter | 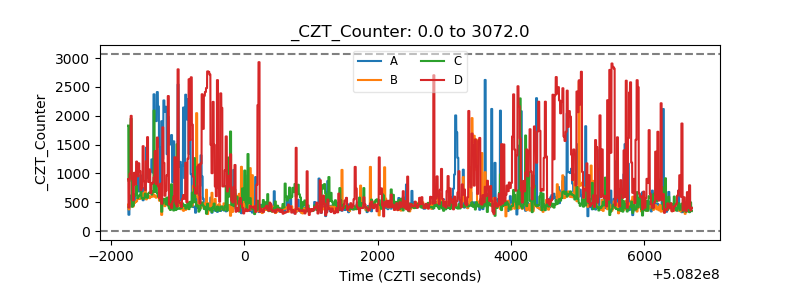 |
| +2.5 Volts monitor |  |
| +5 Volts monitor | 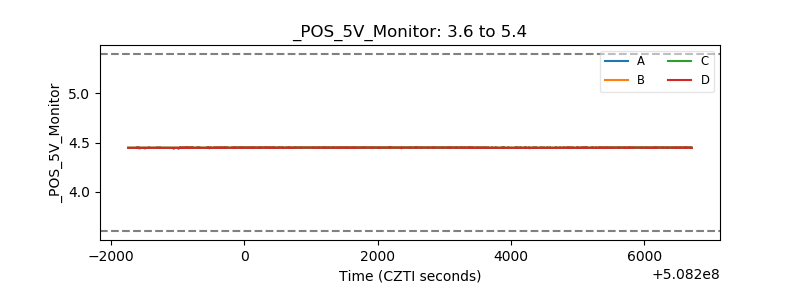 |
| _ROLL_ROT | 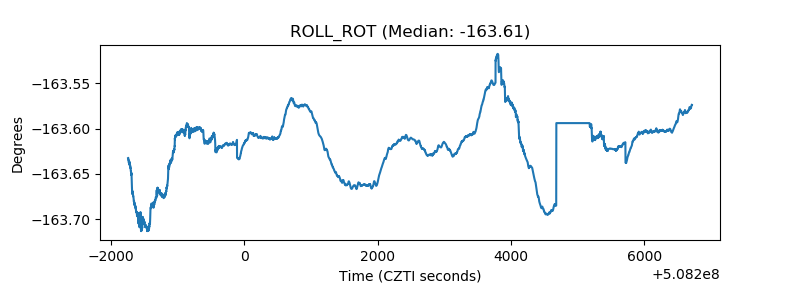 |
| _Roll_DEC | 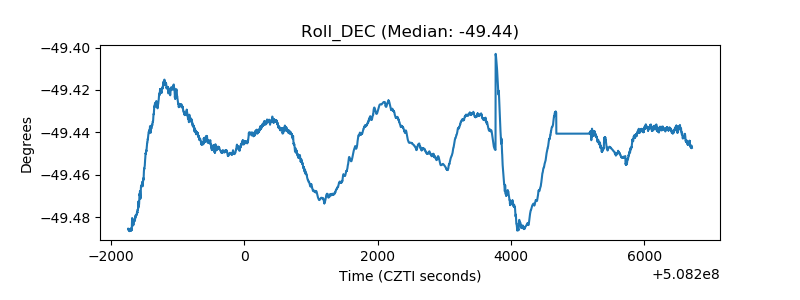 |
| _Roll_RA | 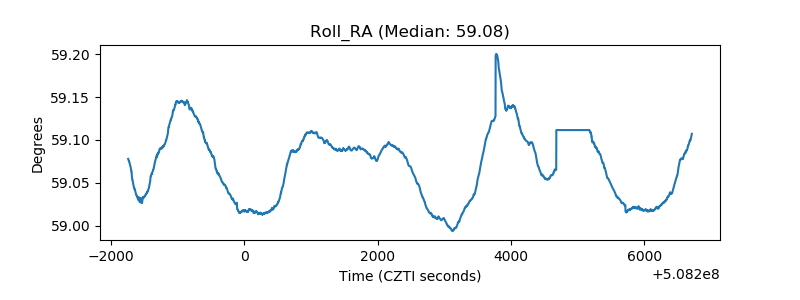 |
| Veto Counter | 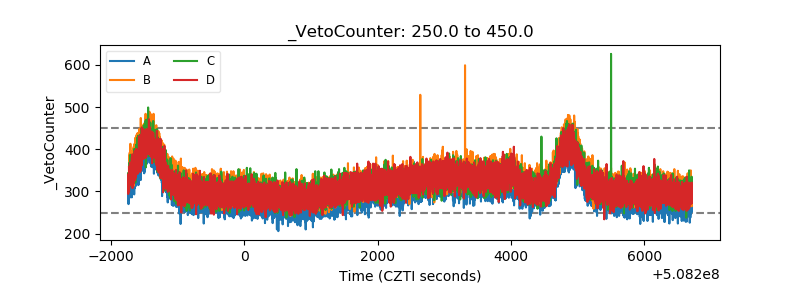 |