| Param | Original file | Final file |
|---|---|---|
| Filename | modeM0/AS1A14_083T03_9000006548_56079cztM0_level2.fits | modeM0/AS1A14_083T03_9000006548_56079cztM0_level2_quad_clean.evt |
| Size (bytes) | 653,935,680 | 144,489,600 |
| Size | 623.6 MB | 137.8 MB |
| Events in quadrant A | 5,171,883 | 944,622 |
| Events in quadrant B | 4,799,502 | 1,019,383 |
| Events in quadrant C | 5,732,048 | 897,237 |
| Events in quadrant D | 7,693,502 | 791,056 |
| Mode M0 | |||
|---|---|---|---|
| Quadrant | BADHDUFLAG | Total packets | Discarded packets |
| A | 0 | 23430 | 0 |
| B | 0 | 21956 | 0 |
| C | 0 | 24817 | 0 |
| D | 0 | 30487 | 0 |
| Mode SS | |||
|---|---|---|---|
| Quadrant | BADHDUFLAG | Total packets | Discarded packets |
| A | 0 | 208 | 0 |
| B | 0 | 208 | 0 |
| C | 0 | 208 | 0 |
| D | 0 | 208 | 0 |
| Quadrant | Total seconds | Saturated seconds | Saturation percentage |
|---|---|---|---|
| A | 10432 | 154 | 1.476227% |
| B | 10432 | 170 | 1.629601% |
| C | 10432 | 204 | 1.955521% |
| D | 10433 | 739 | 7.083293% |
Noise dominated data is calculated using 1-second bins in cleaned event files. If a bin has >2000 counts, and if more than 50% of those come from <1% of pixels, then it is considered to be noise-dominated and hence unusable.
| Quadrant | # 1 sec bins | Bins with >0 counts | Bins with >2000 counts | High rate bins dominated by noise | Noise dominated (total time) | Noise dominated (detector-on time) | Marked lightcurve |
|---|---|---|---|---|---|---|---|
| A | 10432 | 10432 | 94 | 94 | 0.90% | 0.90% | 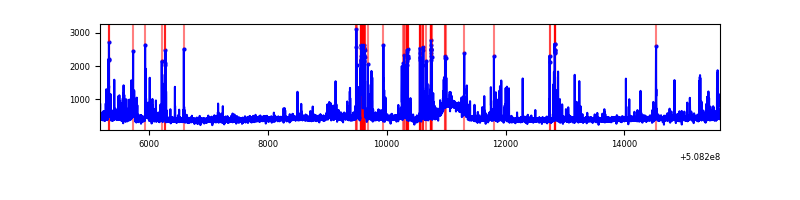 |
| B | 10432 | 10432 | 17 | 17 | 0.16% | 0.16% | 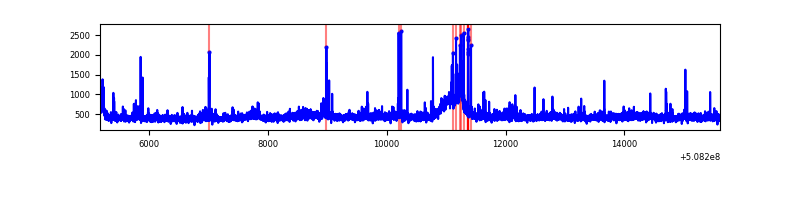 |
| C | 10432 | 10432 | 164 | 164 | 1.57% | 1.57% | 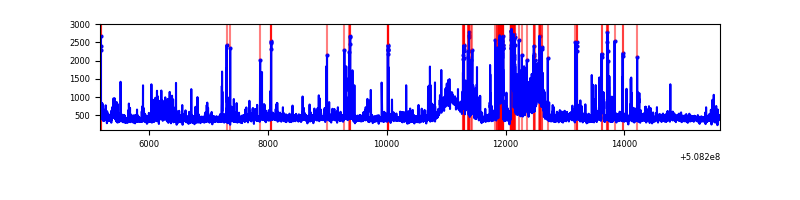 |
| D | 10433 | 10433 | 669 | 669 | 6.41% | 6.41% | 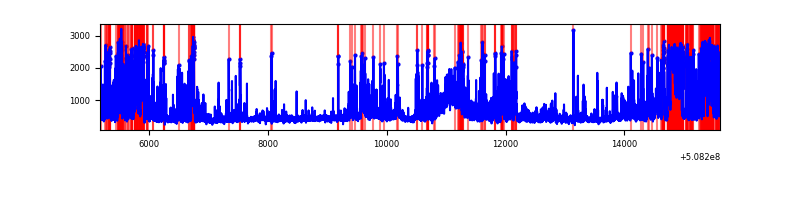 |
Top three noisy pixels from each quadrant. If the there are fewer than three noisy pixels in the level2.evt file, extra rows are filled as -1
| Pixel properties | Quadrant properties | ||||||
|---|---|---|---|---|---|---|---|
| Quadrant | DetID | PixID | Counts | Sigma | Mean | Median | Sigma |
| A | 15 | 32 | 264429 | 970.73 | 1092 | 1064 | 271.3 |
| A | 0 | 8 | 223725 | 820.7 | 1092 | 1064 | 271.3 |
| A | 7 | 64 | 176126 | 645.25 | 1092 | 1064 | 271.3 |
| B | 2 | 249 | 143332 | 614.54 | 1083 | 1042 | 231.5 |
| B | 10 | 247 | 68466 | 291.2 | 1083 | 1042 | 231.5 |
| B | 9 | 254 | 65063 | 276.5 | 1083 | 1042 | 231.5 |
| C | 12 | 252 | 438951 | 1507.78 | 1066 | 1056 | 290.4 |
| C | 9 | 38 | 437633 | 1503.24 | 1066 | 1056 | 290.4 |
| C | 15 | 147 | 390617 | 1341.35 | 1066 | 1056 | 290.4 |
| D | 11 | 129 | 3120641 | 10769.82 | 1031 | 987 | 289.7 |
| D | 8 | 240 | 183526 | 630.17 | 1031 | 987 | 289.7 |
| D | 5 | 173 | 96259 | 328.9 | 1031 | 987 | 289.7 |
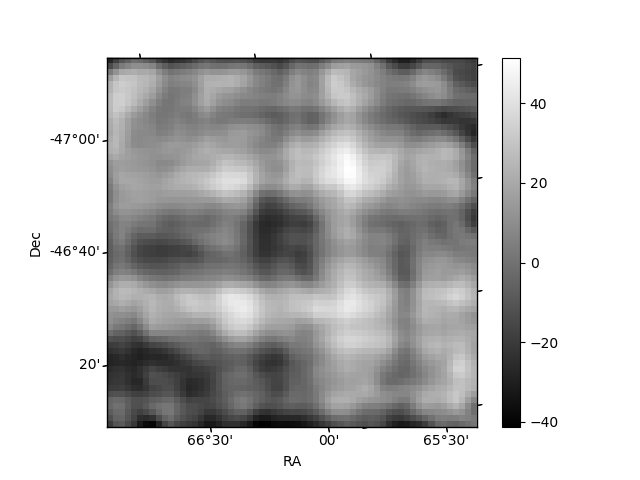
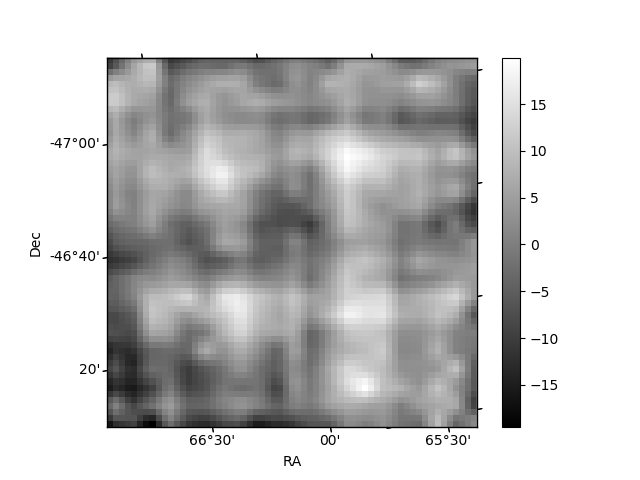
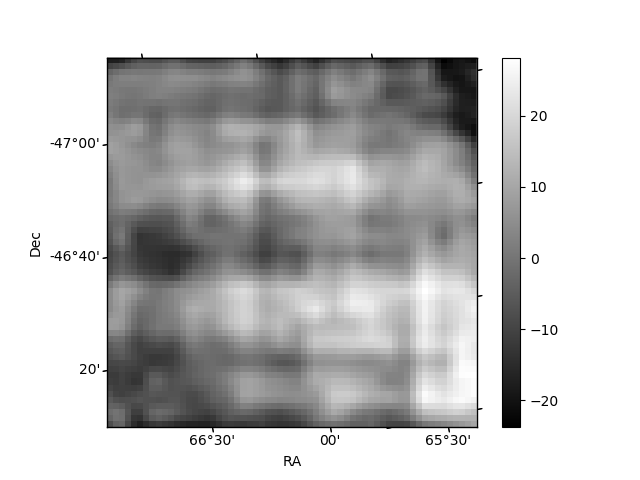
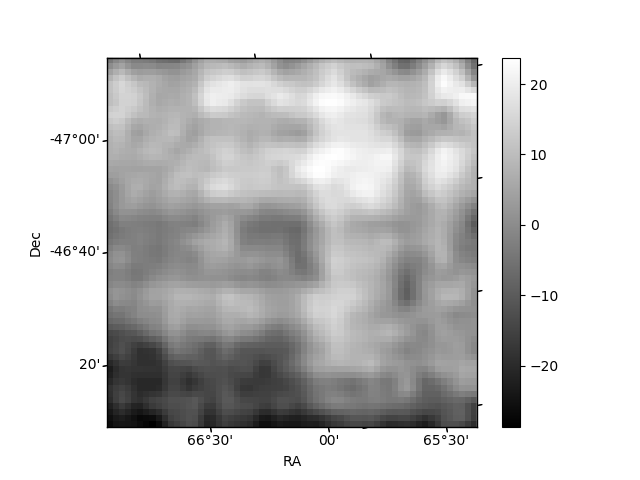
Histogram calculated using DETX and DETY for each event in the final _common_clean file
| Quadrant A | 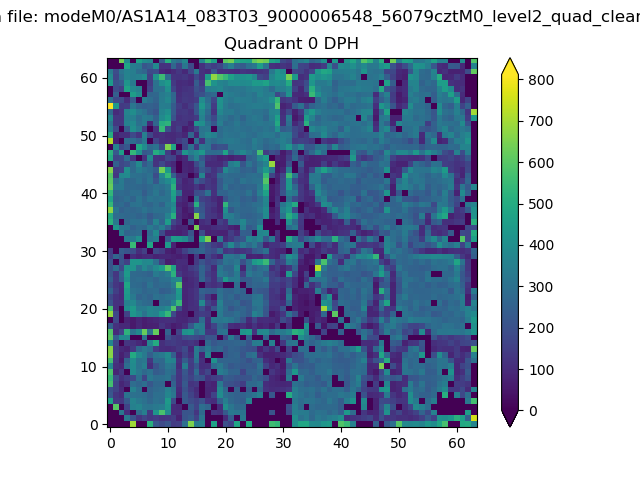 |
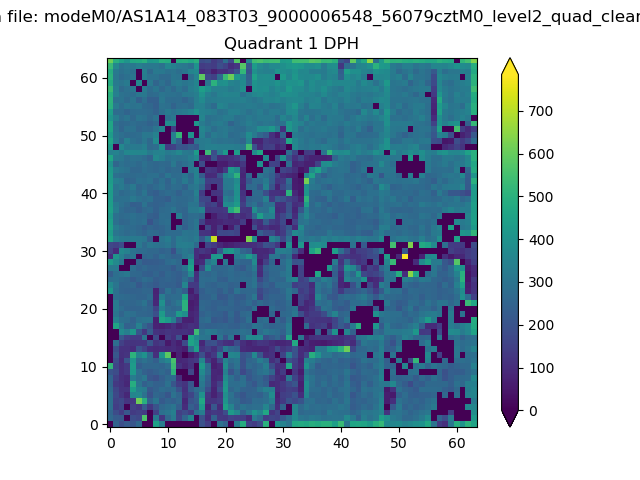 |
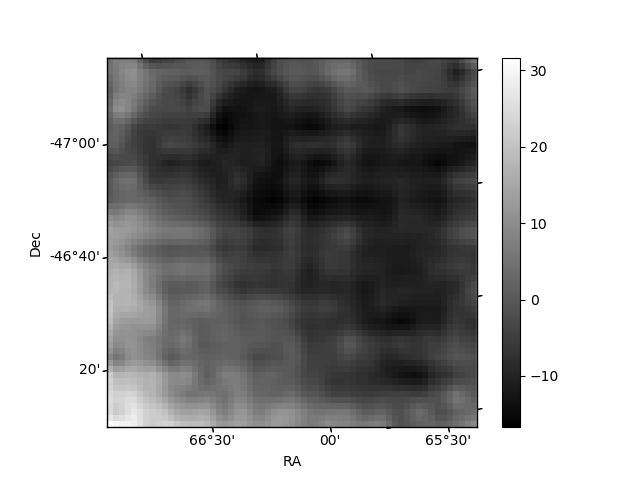
Quadrant B |
|---|---|---|---|
| Quadrant D | 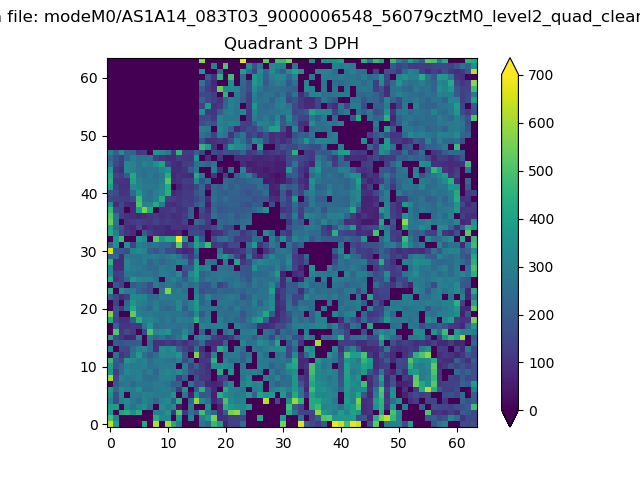 |
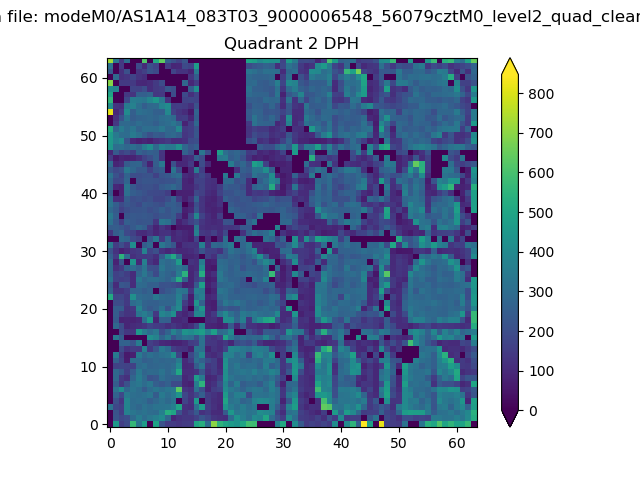 |
Quadrant C |
| Plot type | Count rate plots | Images |
|---|---|---|
| Comparison with Poisson distribution Blue bars denote a histogram of data divided into 1 sec bins. Red curve is a Poisson curve with rate = median count rate of data. |
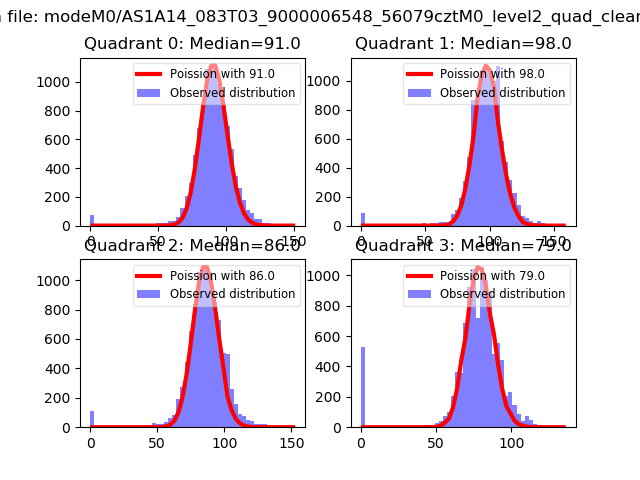 |
 |
| Quadrant-wise count rates Data is divided into 100 sec bins |
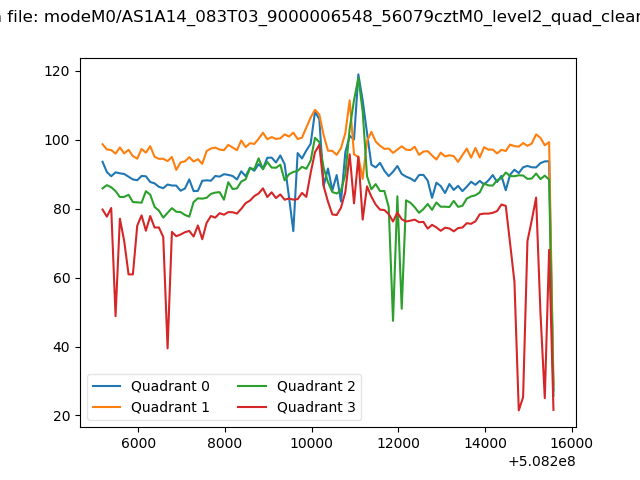 |
|
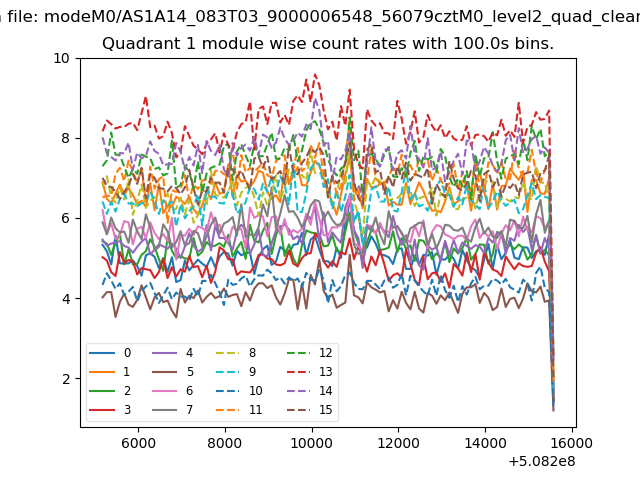
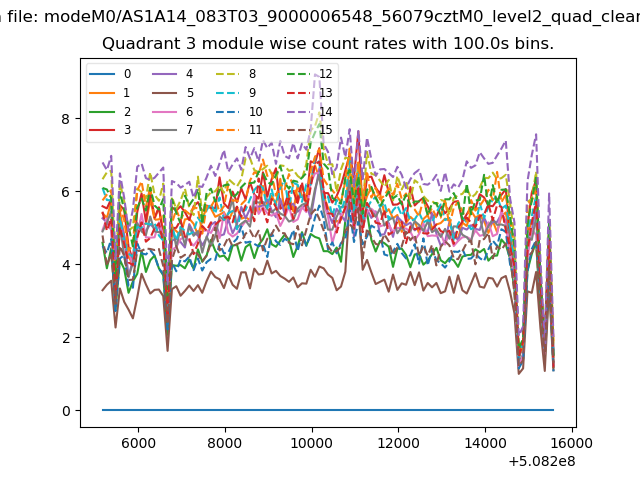
| Module-wise count rates for Quadrant A Data is divided into 100 sec bins |
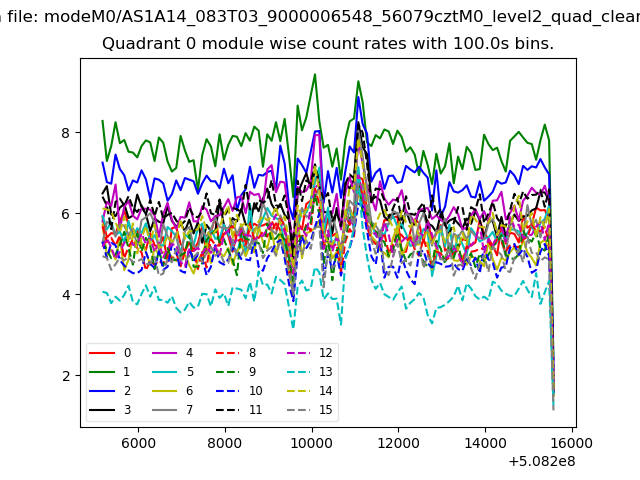 |
 |
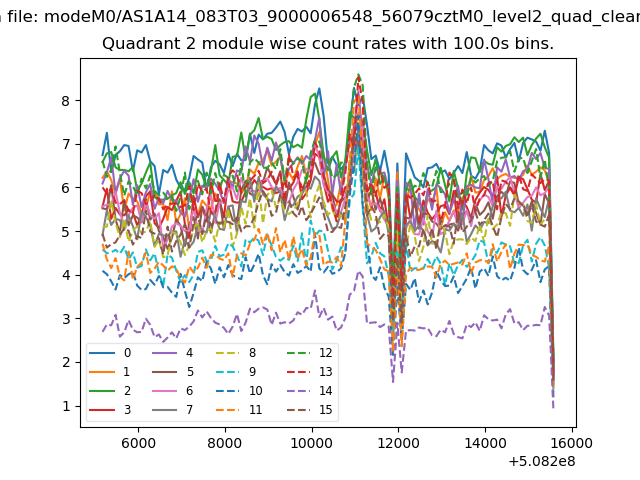
| Module-wise count rates for Quadrant B Data is divided into 100 sec bins |
 |
 |
| Module-wise count rates for Quadrant C Data is divided into 100 sec bins |
 |
 |
| Module-wise count rates for Quadrant D Data is divided into 100 sec bins |
 |
 |
| Parameter | Plot |
|---|---|
| CZT HV Monitor | 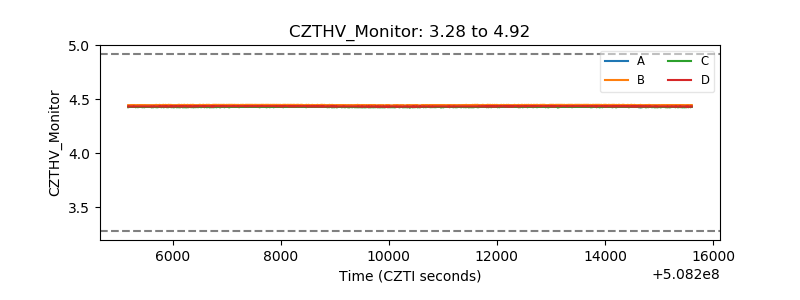 |
| D_VDD | 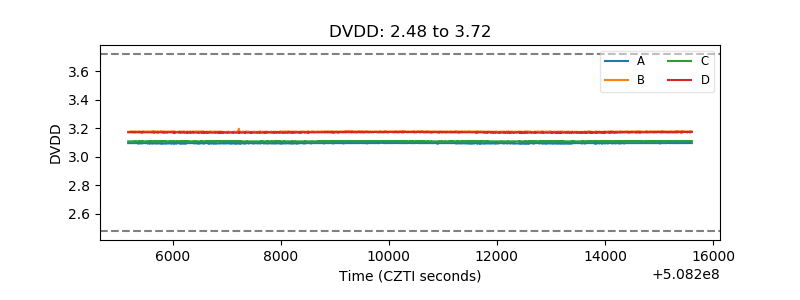 |
| Temperature 1 | 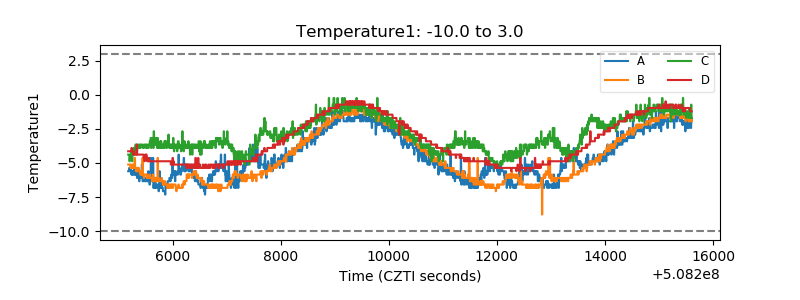 |
| Veto HV Monitor | 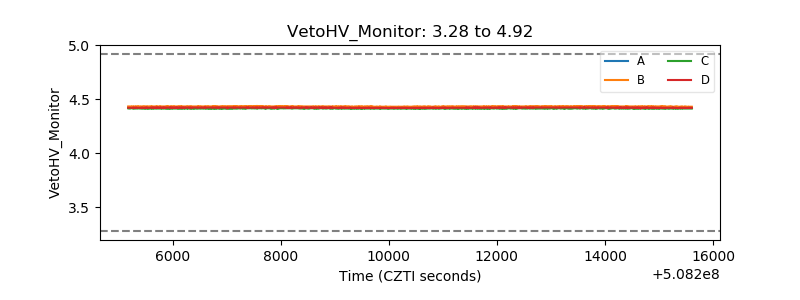 |
| Veto LLD | 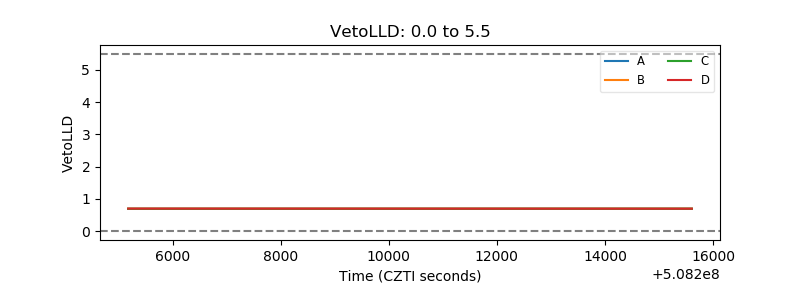 |
| Alpha Counter | 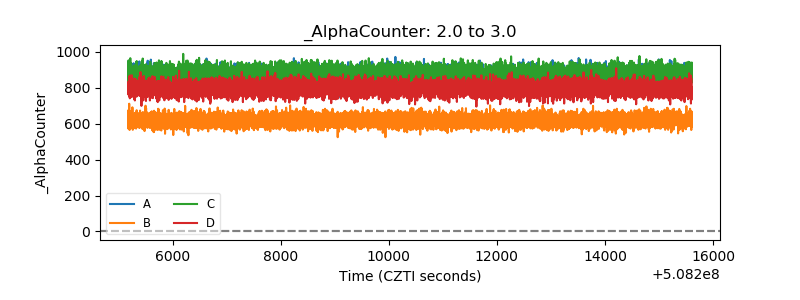 |
| _CPM_Rate | 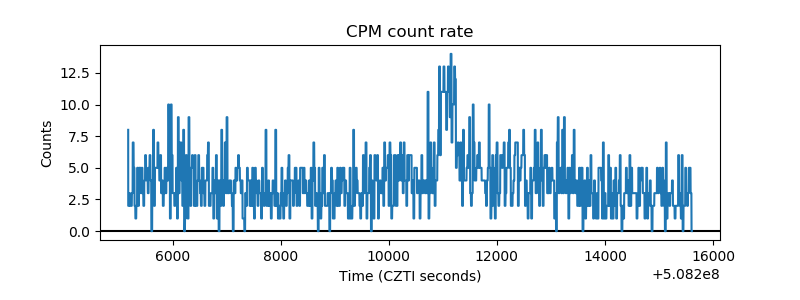 |
| CZT Counter | 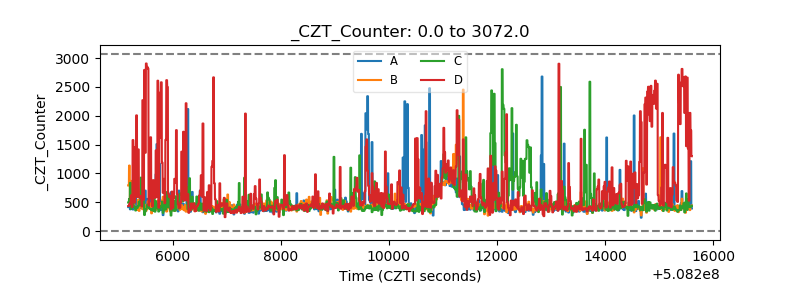 |
| +2.5 Volts monitor |  |
| +5 Volts monitor |  |
| _ROLL_ROT | 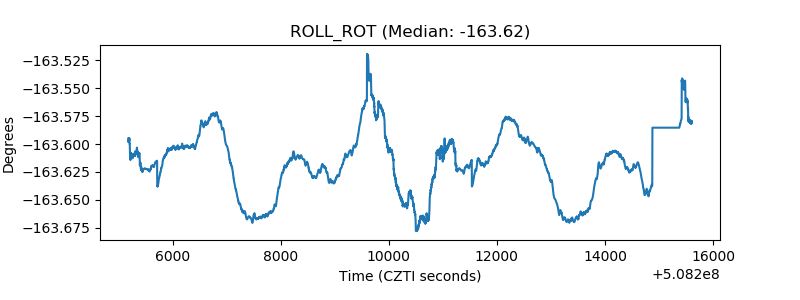 |
| _Roll_DEC | 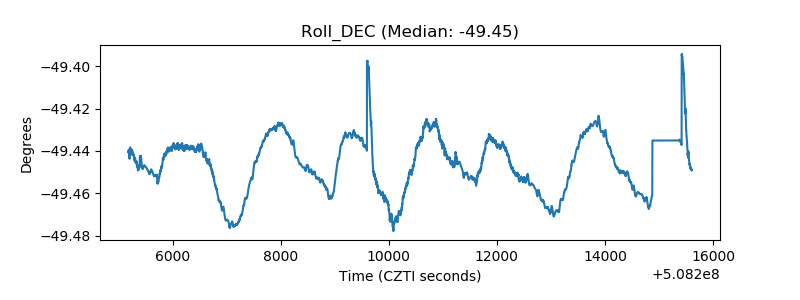 |
| _Roll_RA | 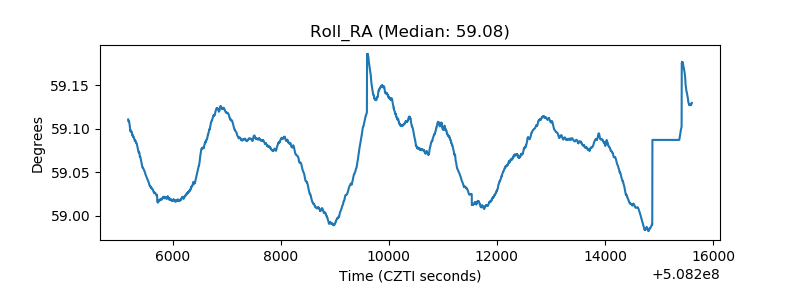 |
| Veto Counter | 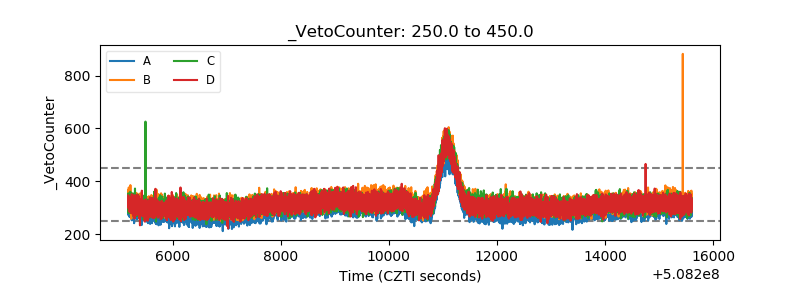 |