| Param | Original file | Final file |
|---|---|---|
| Filename | modeM0/AS1A14_083T03_9000006548_56080cztM0_level2.fits | modeM0/AS1A14_083T03_9000006548_56080cztM0_level2_quad_clean.evt |
| Size (bytes) | 1,027,123,200 | 198,953,280 |
| Size | 979.5 MB | 189.7 MB |
| Events in quadrant A | 8,219,211 | 1,307,817 |
| Events in quadrant B | 7,179,770 | 1,424,457 |
| Events in quadrant C | 6,466,853 | 1,271,275 |
| Events in quadrant D | 15,024,478 | 1,012,713 |
| Mode M0 | |||
|---|---|---|---|
| Quadrant | BADHDUFLAG | Total packets | Discarded packets |
| A | 0 | 34799 | 3 |
| B | 0 | 31698 | 3 |
| C | 0 | 30809 | 3 |
| D | 0 | 54750 | 3 |
| Mode SS | |||
|---|---|---|---|
| Quadrant | BADHDUFLAG | Total packets | Discarded packets |
| A | 0 | 300 | 0 |
| B | 0 | 300 | 0 |
| C | 0 | 300 | 0 |
| D | 0 | 300 | 0 |
| Mode M9 | |||
|---|---|---|---|
| Quadrant | BADHDUFLAG | Total packets | Discarded packets |
| A | 0 | 16 | 0 |
| B | 0 | 16 | 0 |
| C | 0 | 16 | 0 |
| D | 0 | 16 | 0 |
| Quadrant | Total seconds | Saturated seconds | Saturation percentage |
|---|---|---|---|
| A | 14589 | 448 | 3.070807% |
| B | 14589 | 348 | 2.385359% |
| C | 14589 | 254 | 1.741038% |
| D | 14589 | 2477 | 16.978545% |
Noise dominated data is calculated using 1-second bins in cleaned event files. If a bin has >2000 counts, and if more than 50% of those come from <1% of pixels, then it is considered to be noise-dominated and hence unusable.
| Quadrant | # 1 sec bins | Bins with >0 counts | Bins with >2000 counts | High rate bins dominated by noise | Noise dominated (total time) | Noise dominated (detector-on time) | Marked lightcurve |
|---|---|---|---|---|---|---|---|
| A | 16243 | 14589 | 221 | 221 | 1.36% | 1.51% | 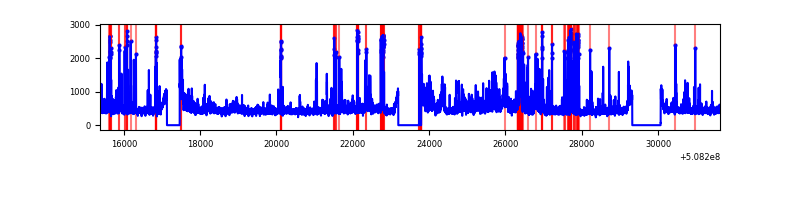 |
| B | 16243 | 14589 | 42 | 42 | 0.26% | 0.29% | 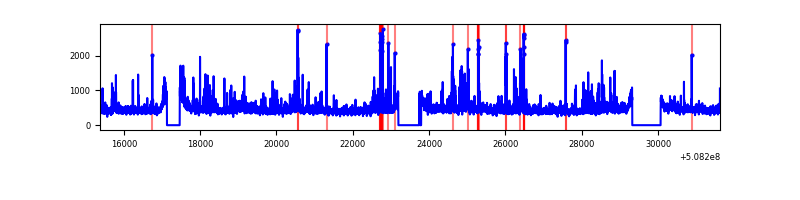 |
| C | 16243 | 14589 | 36 | 36 | 0.22% | 0.25% | 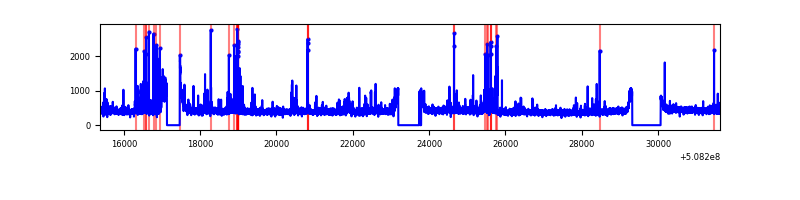 |
| D | 16243 | 14589 | 2255 | 2255 | 13.88% | 15.46% | 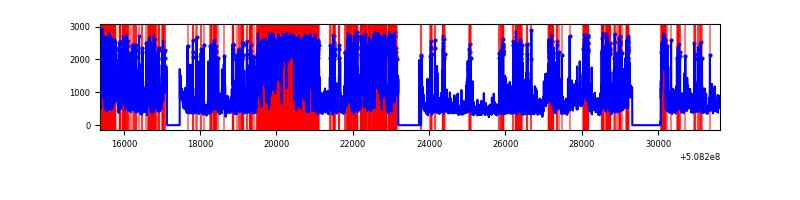 |
Top three noisy pixels from each quadrant. If the there are fewer than three noisy pixels in the level2.evt file, extra rows are filled as -1
| Pixel properties | Quadrant properties | ||||||
|---|---|---|---|---|---|---|---|
| Quadrant | DetID | PixID | Counts | Sigma | Mean | Median | Sigma |
| A | 12 | 115 | 767557 | 2023.28 | 1549 | 1510 | 378.6 |
| A | 3 | 14 | 534728 | 1408.33 | 1549 | 1510 | 378.6 |
| A | 15 | 32 | 389049 | 1023.57 | 1549 | 1510 | 378.6 |
| B | 2 | 249 | 455662 | 1376.69 | 1544 | 1483 | 329.9 |
| B | 0 | 199 | 106568 | 318.53 | 1544 | 1483 | 329.9 |
| B | 0 | 213 | 101465 | 303.06 | 1544 | 1483 | 329.9 |
| C | 15 | 230 | 118432 | 284.96 | 1518 | 1501 | 410.3 |
| C | 6 | 223 | 107654 | 258.69 | 1518 | 1501 | 410.3 |
| C | 13 | 3 | 77825 | 186.0 | 1518 | 1501 | 410.3 |
| D | 11 | 129 | 6988300 | 17745.1 | 1406 | 1344 | 393.7 |
| D | 2 | 249 | 1090632 | 2766.52 | 1406 | 1344 | 393.7 |
| D | 8 | 160 | 364264 | 921.72 | 1406 | 1344 | 393.7 |
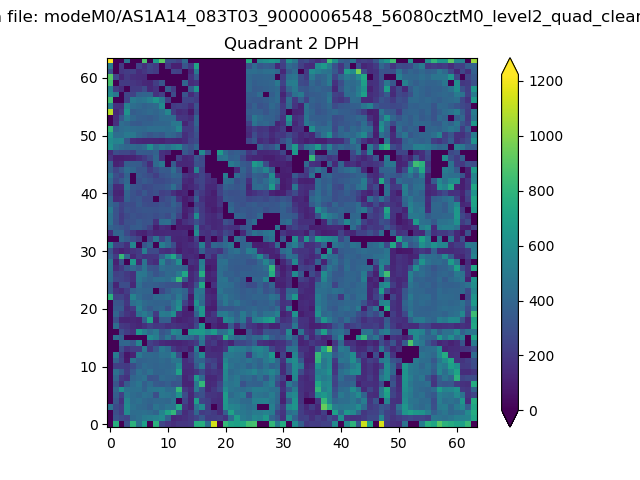
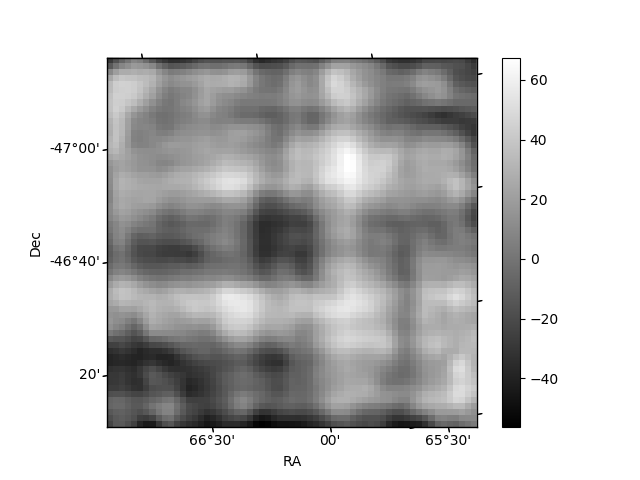
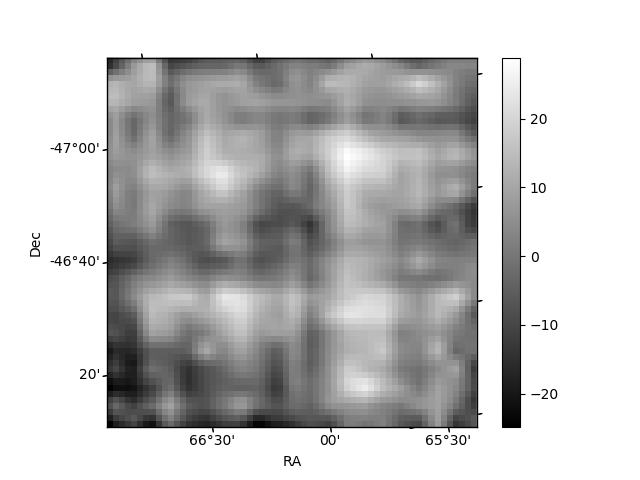
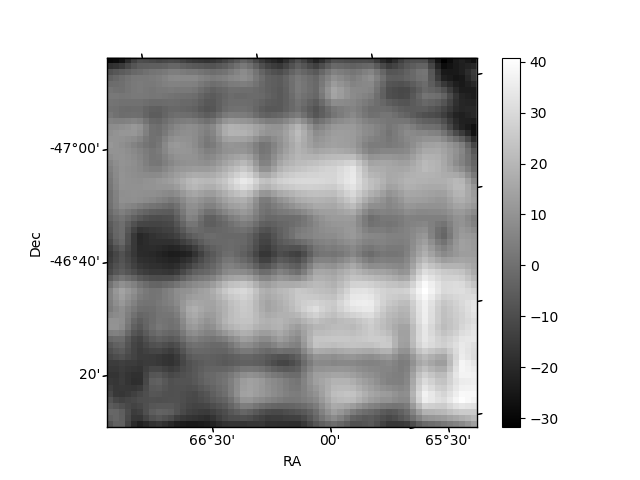
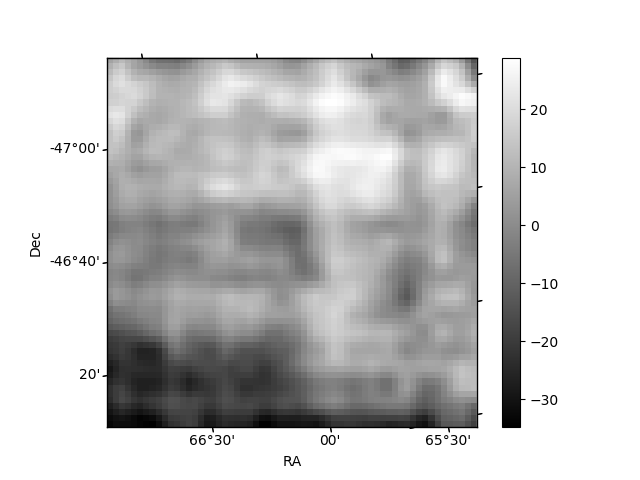
Histogram calculated using DETX and DETY for each event in the final _common_clean file
| Quadrant A | 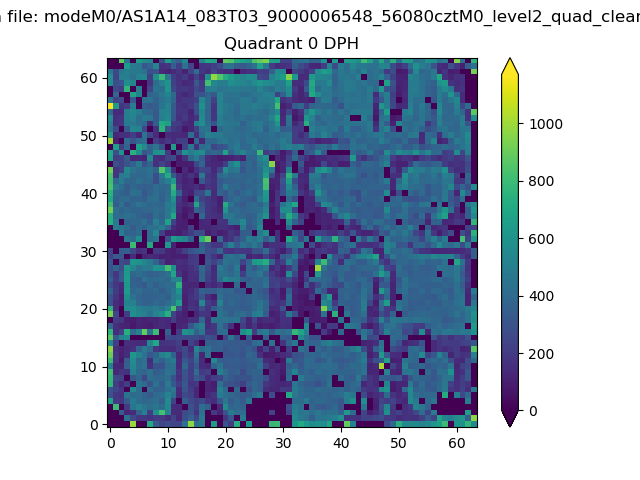 |
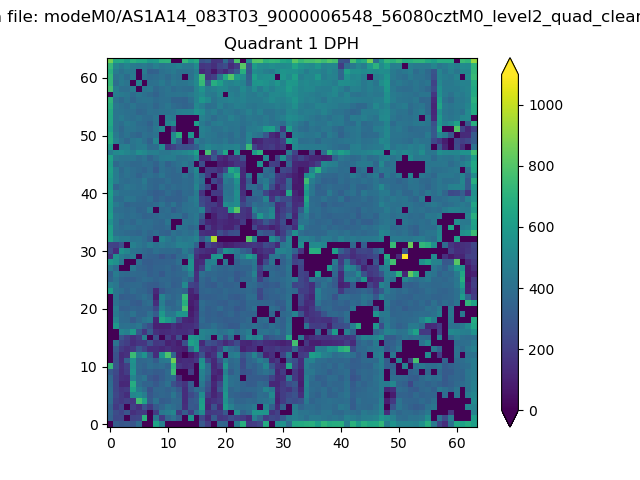 |
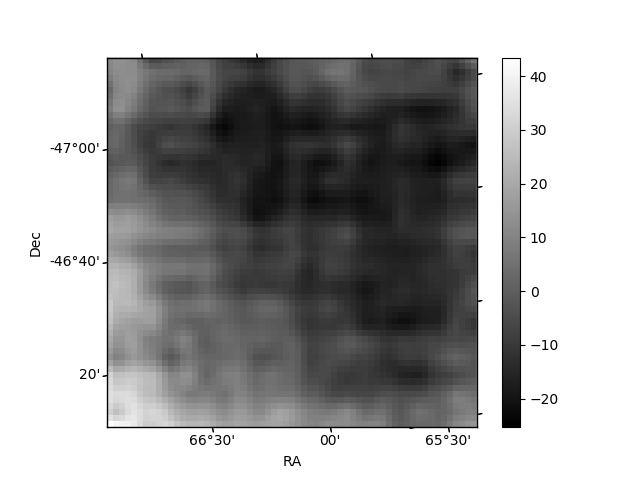
Quadrant B |
|---|---|---|---|
| Quadrant D | 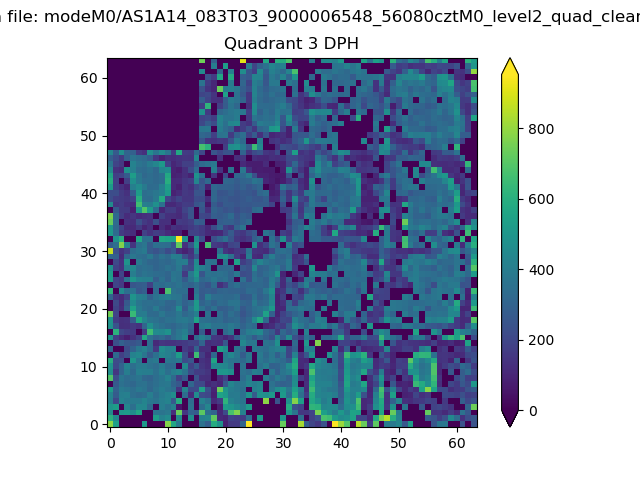 |
 |
Quadrant C |
| Plot type | Count rate plots | Images |
|---|---|---|
| Comparison with Poisson distribution Blue bars denote a histogram of data divided into 1 sec bins. Red curve is a Poisson curve with rate = median count rate of data. |
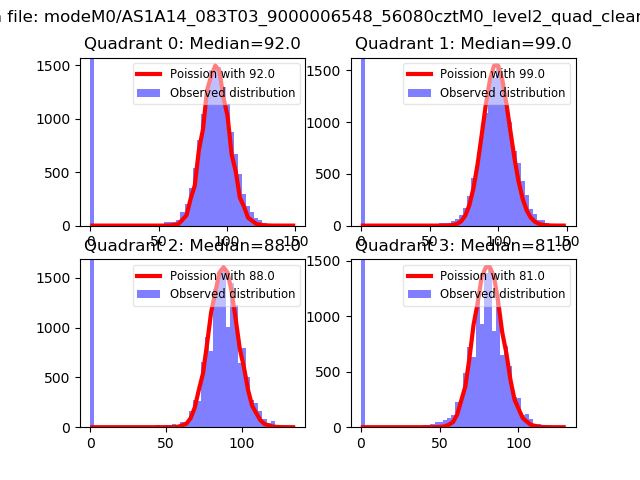 |
 |
| Quadrant-wise count rates Data is divided into 100 sec bins |
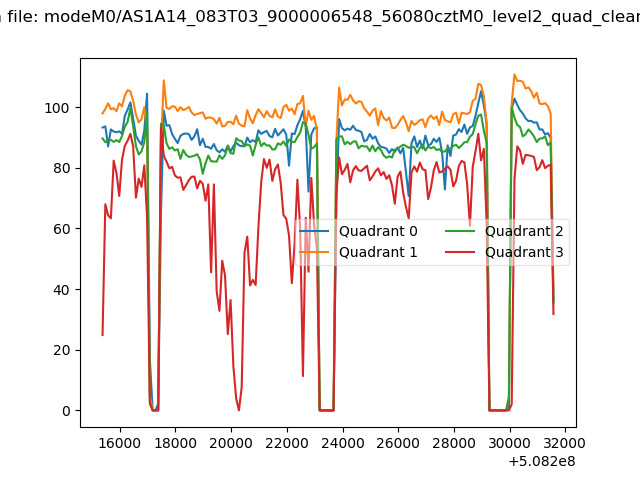 |
|
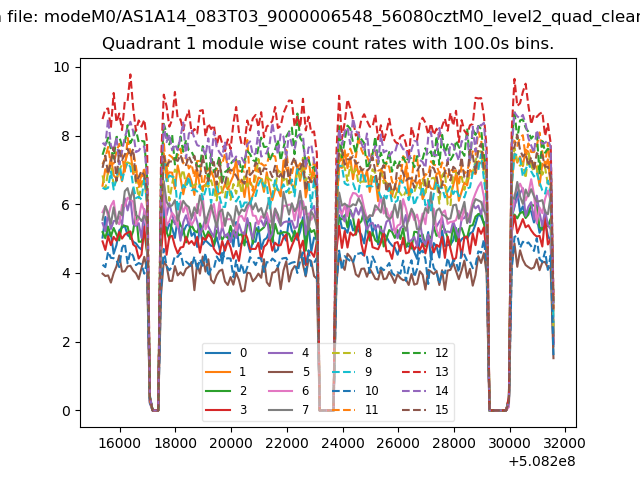
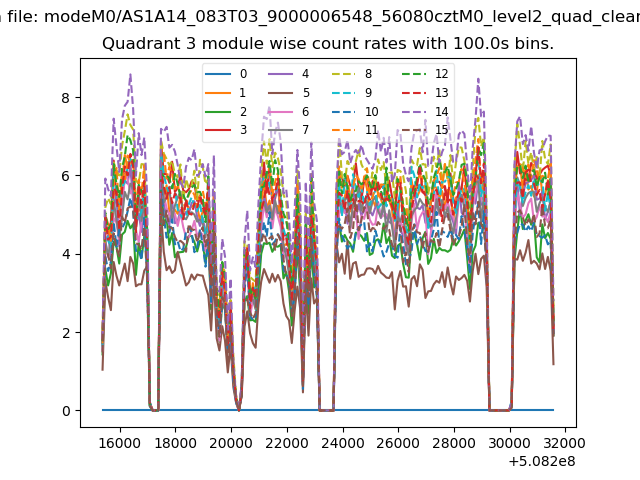
| Module-wise count rates for Quadrant A Data is divided into 100 sec bins |
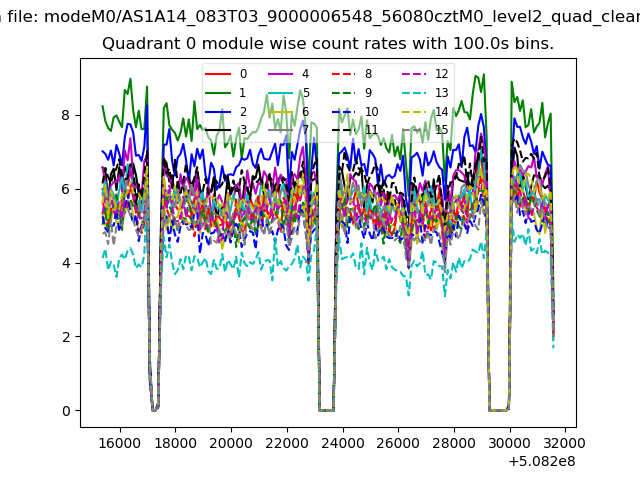 |
 |
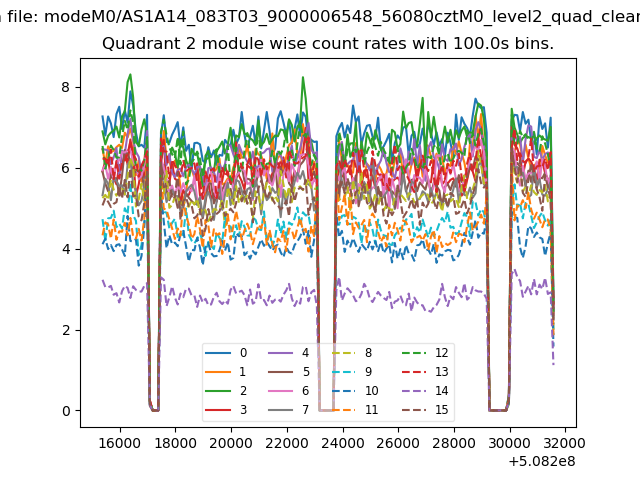
| Module-wise count rates for Quadrant B Data is divided into 100 sec bins |
 |
 |
| Module-wise count rates for Quadrant C Data is divided into 100 sec bins |
 |
 |
| Module-wise count rates for Quadrant D Data is divided into 100 sec bins |
 |
 |
| Parameter | Plot |
|---|---|
| CZT HV Monitor | 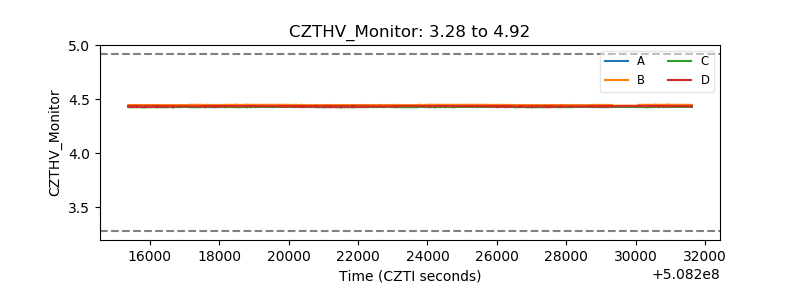 |
| D_VDD | 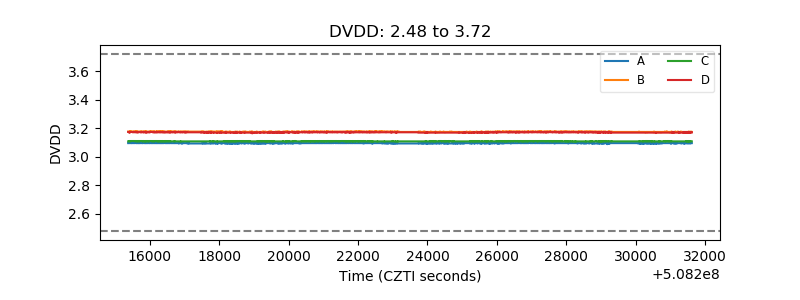 |
| Temperature 1 | 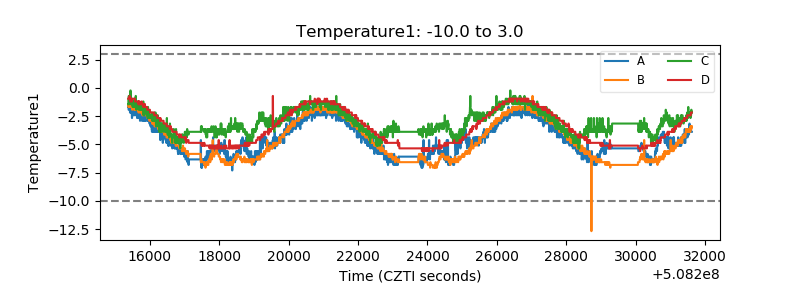 |
| Veto HV Monitor | 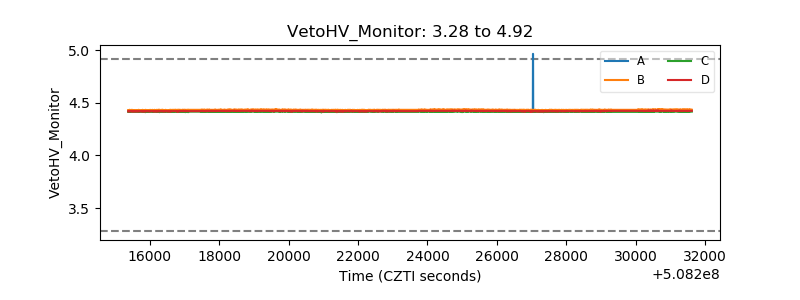 |
| Veto LLD | 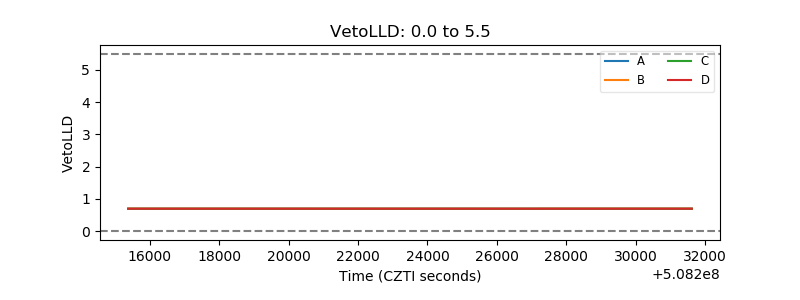 |
| Alpha Counter | 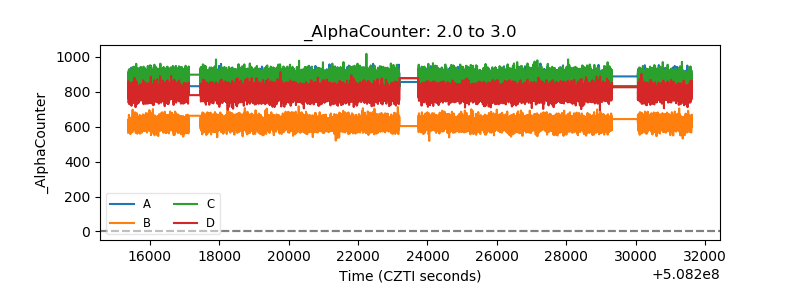 |
| _CPM_Rate | 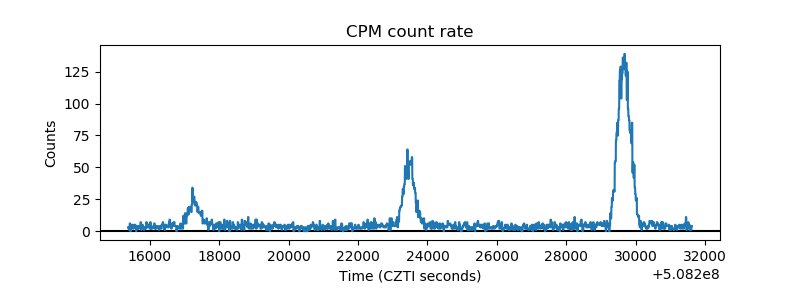 |
| CZT Counter | 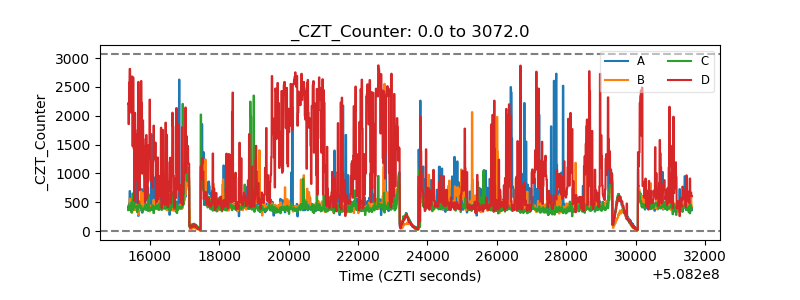 |
| +2.5 Volts monitor |  |
| +5 Volts monitor |  |
| _ROLL_ROT | 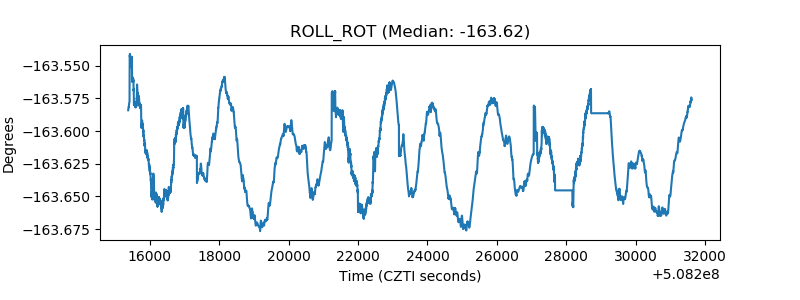 |
| _Roll_DEC | 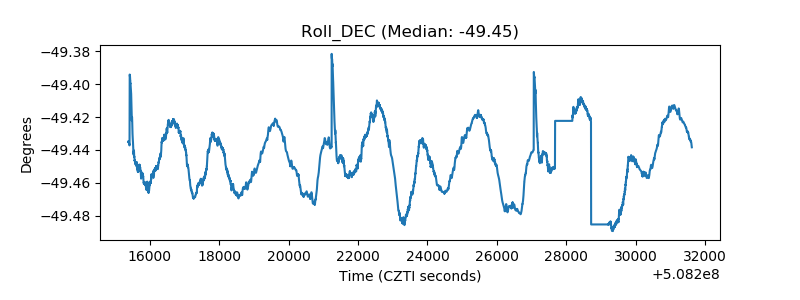 |
| _Roll_RA | 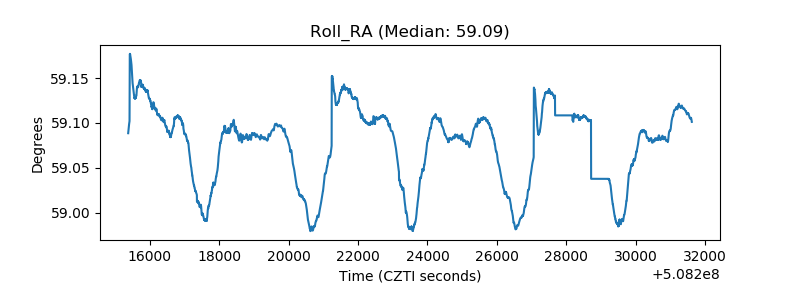 |
| Veto Counter | 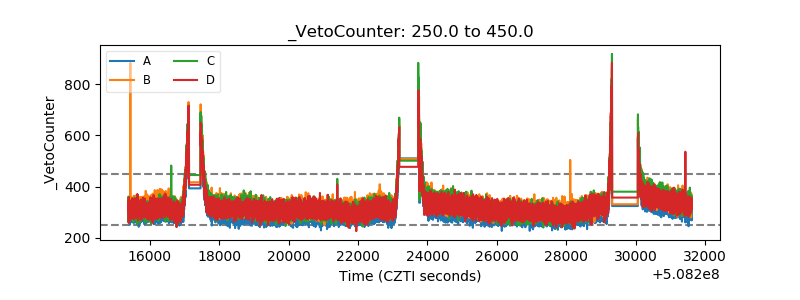 |