| Param | Original file | Final file |
|---|---|---|
| Filename | modeM0/AS1A14_083T03_9000006548_56081cztM0_level2.fits | modeM0/AS1A14_083T03_9000006548_56081cztM0_level2_quad_clean.evt |
| Size (bytes) | 420,840,000 | 99,506,880 |
| Size | 401.3 MB | 94.9 MB |
| Events in quadrant A | 3,552,978 | 647,249 |
| Events in quadrant B | 3,185,859 | 698,477 |
| Events in quadrant C | 3,039,166 | 626,176 |
| Events in quadrant D | 5,258,604 | 556,342 |
| Mode M0 | |||
|---|---|---|---|
| Quadrant | BADHDUFLAG | Total packets | Discarded packets |
| A | 0 | 15549 | 5 |
| B | 0 | 14517 | 2 |
| C | 0 | 14477 | 2 |
| D | 0 | 20479 | 2 |
| Mode SS | |||
|---|---|---|---|
| Quadrant | BADHDUFLAG | Total packets | Discarded packets |
| A | 0 | 144 | 0 |
| B | 0 | 144 | 0 |
| C | 0 | 144 | 0 |
| D | 0 | 144 | 0 |
| Mode M9 | |||
|---|---|---|---|
| Quadrant | BADHDUFLAG | Total packets | Discarded packets |
| A | 0 | 16 | 0 |
| B | 0 | 16 | 0 |
| C | 0 | 16 | 0 |
| D | 0 | 16 | 0 |
| Quadrant | Total seconds | Saturated seconds | Saturation percentage |
|---|---|---|---|
| A | 6955 | 194 | 2.789360% |
| B | 6956 | 167 | 2.400805% |
| C | 6956 | 116 | 1.667625% |
| D | 6956 | 469 | 6.742381% |
Noise dominated data is calculated using 1-second bins in cleaned event files. If a bin has >2000 counts, and if more than 50% of those come from <1% of pixels, then it is considered to be noise-dominated and hence unusable.
| Quadrant | # 1 sec bins | Bins with >0 counts | Bins with >2000 counts | High rate bins dominated by noise | Noise dominated (total time) | Noise dominated (detector-on time) | Marked lightcurve |
|---|---|---|---|---|---|---|---|
| A | 8610 | 6957 | 67 | 67 | 0.78% | 0.96% | 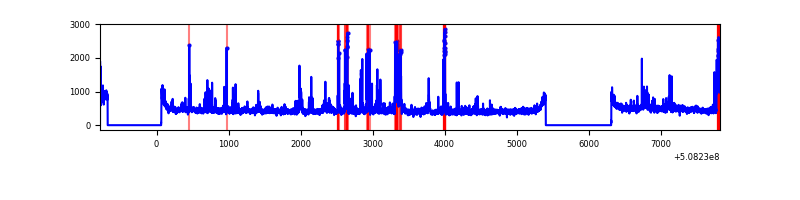 |
| B | 8611 | 6958 | 5 | 5 | 0.06% | 0.07% | 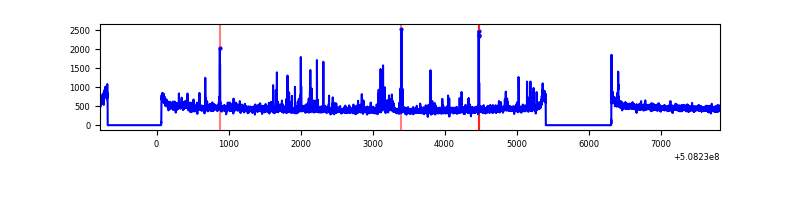 |
| C | 8611 | 6958 | 3 | 3 | 0.03% | 0.04% | 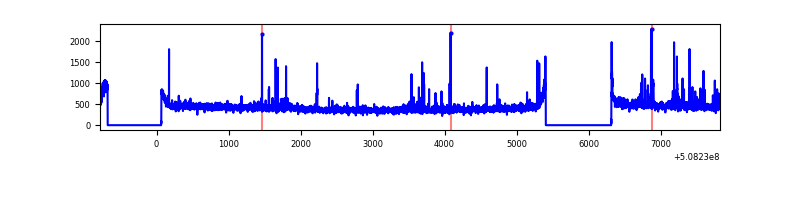 |
| D | 8611 | 6958 | 320 | 320 | 3.72% | 4.60% | 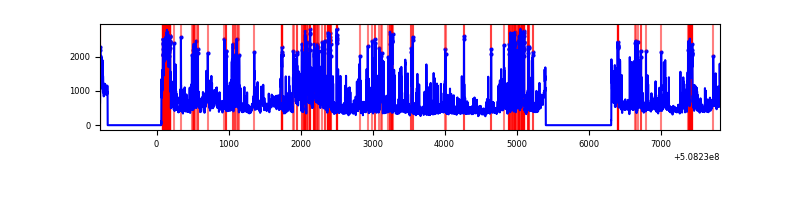 |
Top three noisy pixels from each quadrant. If the there are fewer than three noisy pixels in the level2.evt file, extra rows are filled as -1
| Pixel properties | Quadrant properties | ||||||
|---|---|---|---|---|---|---|---|
| Quadrant | DetID | PixID | Counts | Sigma | Mean | Median | Sigma |
| A | 15 | 32 | 209149 | 1125.63 | 757 | 739 | 185.1 |
| A | 12 | 115 | 131812 | 707.93 | 757 | 739 | 185.1 |
| A | 7 | 64 | 129406 | 694.94 | 757 | 739 | 185.1 |
| B | 2 | 249 | 63883 | 394.51 | 748 | 719 | 160.1 |
| B | 4 | 169 | 31993 | 195.33 | 748 | 719 | 160.1 |
| B | 0 | 213 | 25080 | 152.16 | 748 | 719 | 160.1 |
| C | 12 | 252 | 108730 | 534.84 | 740 | 731 | 201.9 |
| C | 6 | 9 | 15834 | 74.79 | 740 | 731 | 201.9 |
| C | 15 | 230 | 10817 | 49.95 | 740 | 731 | 201.9 |
| D | 2 | 249 | 726184 | 3549.97 | 723 | 690 | 204.4 |
| D | 11 | 129 | 709720 | 3469.41 | 723 | 690 | 204.4 |
| D | 8 | 160 | 575849 | 2814.35 | 723 | 690 | 204.4 |
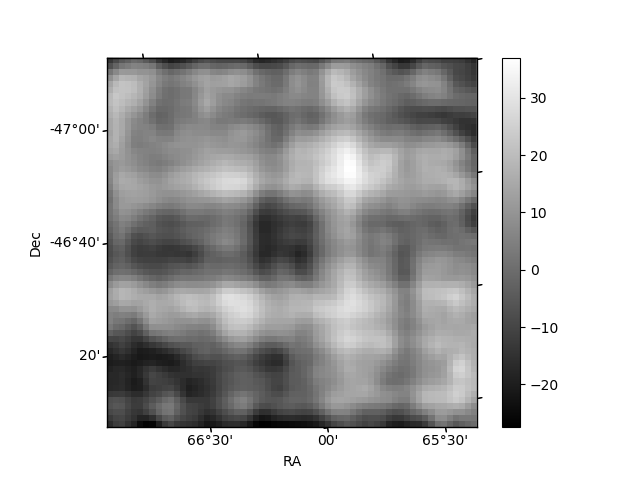
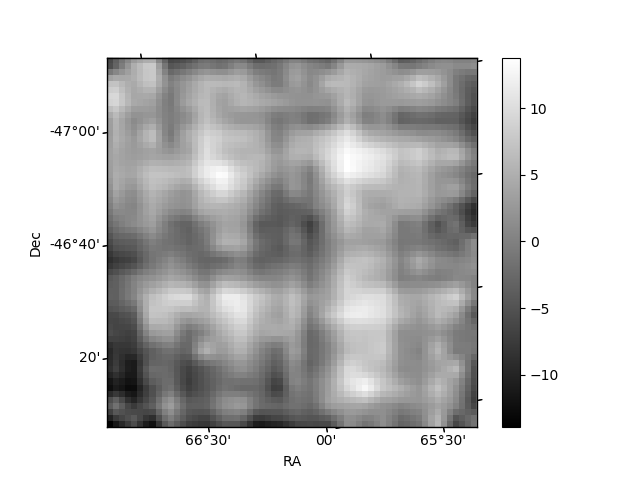
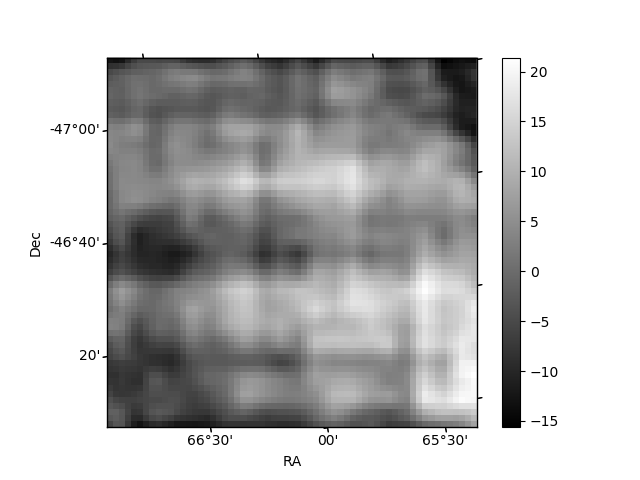
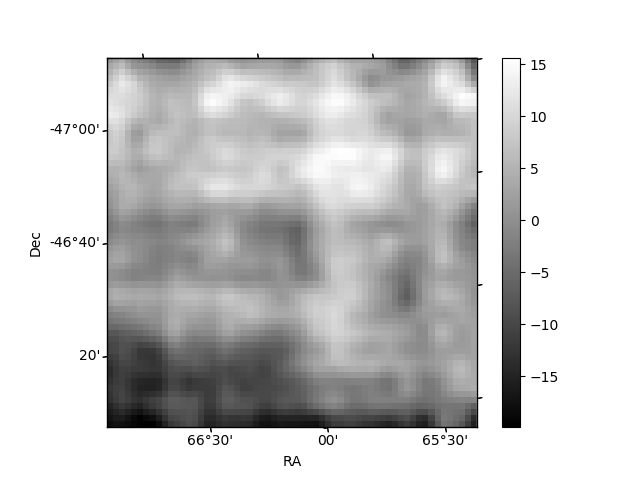
Histogram calculated using DETX and DETY for each event in the final _common_clean file
| Quadrant A | 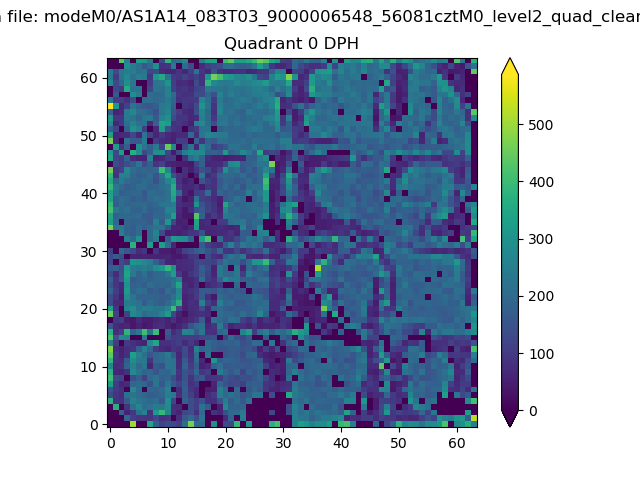 |
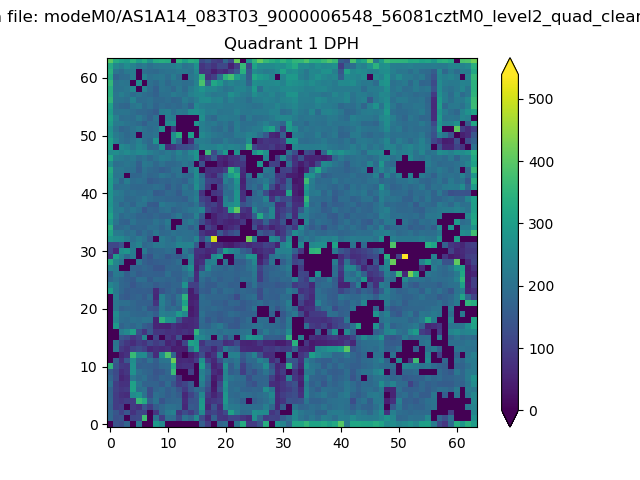 |
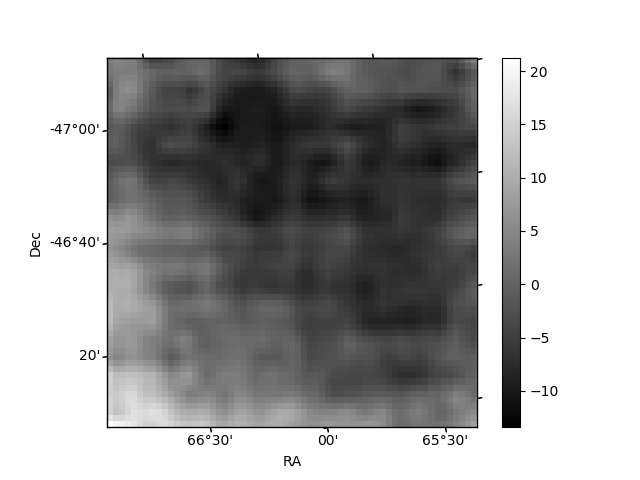
Quadrant B |
|---|---|---|---|
| Quadrant D | 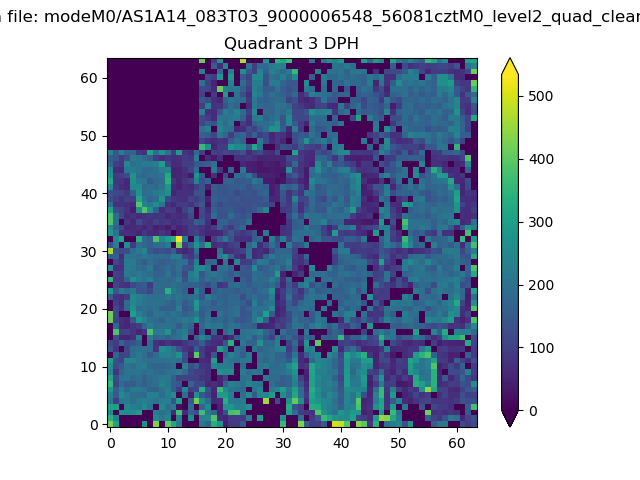 |
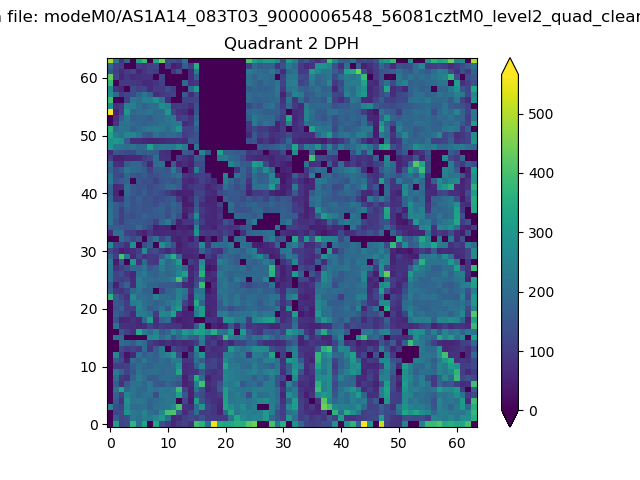 |
Quadrant C |
| Plot type | Count rate plots | Images |
|---|---|---|
| Comparison with Poisson distribution Blue bars denote a histogram of data divided into 1 sec bins. Red curve is a Poisson curve with rate = median count rate of data. |
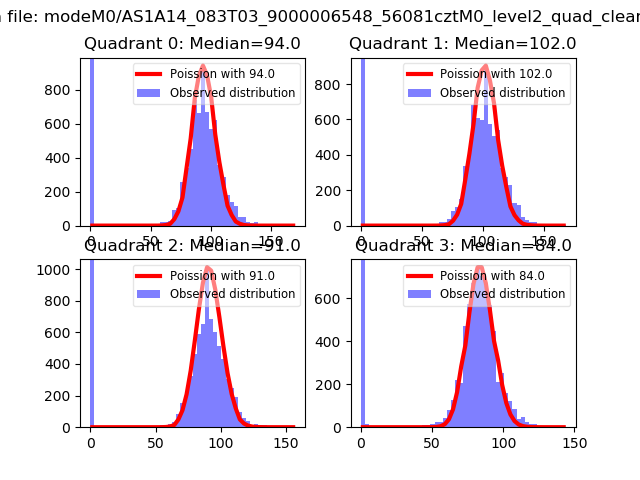 |
 |
| Quadrant-wise count rates Data is divided into 100 sec bins |
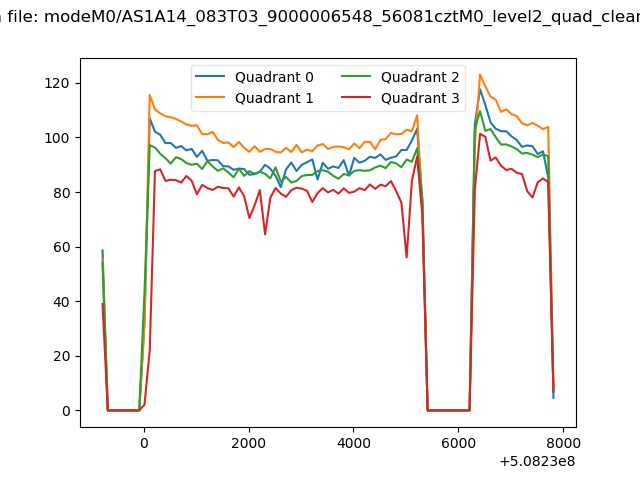 |
|
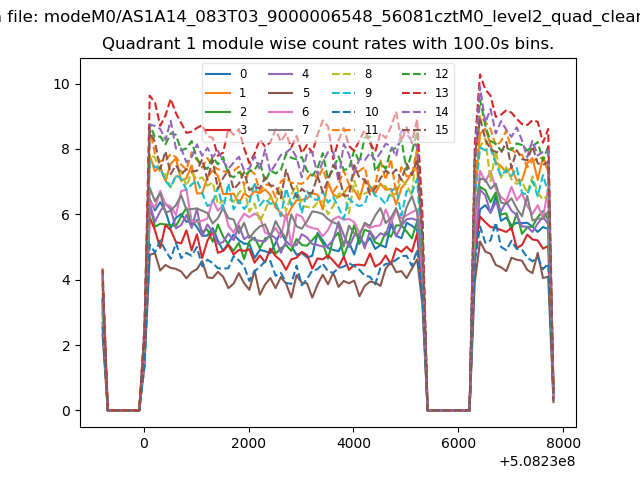
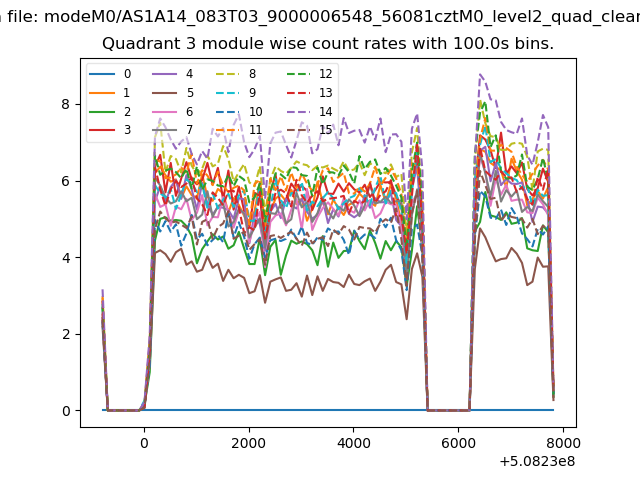
| Module-wise count rates for Quadrant A Data is divided into 100 sec bins |
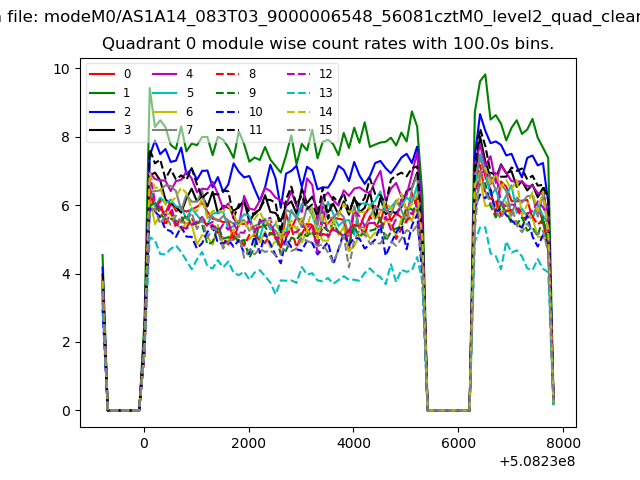 |
 |
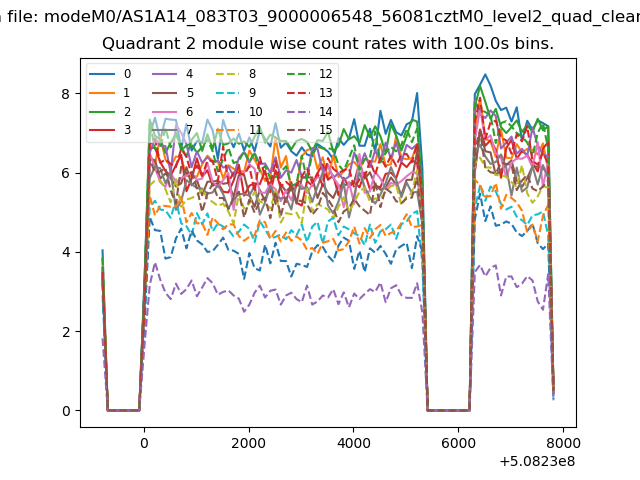
| Module-wise count rates for Quadrant B Data is divided into 100 sec bins |
 |
 |
| Module-wise count rates for Quadrant C Data is divided into 100 sec bins |
 |
 |
| Module-wise count rates for Quadrant D Data is divided into 100 sec bins |
 |
 |
| Parameter | Plot |
|---|---|
| CZT HV Monitor | 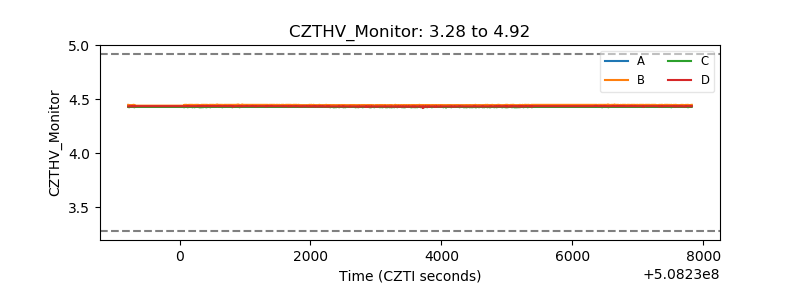 |
| D_VDD | 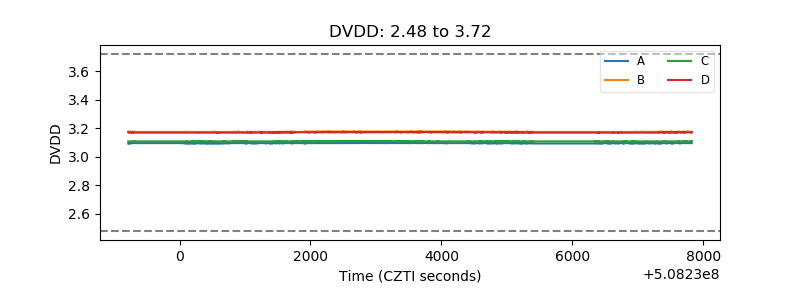 |
| Temperature 1 | 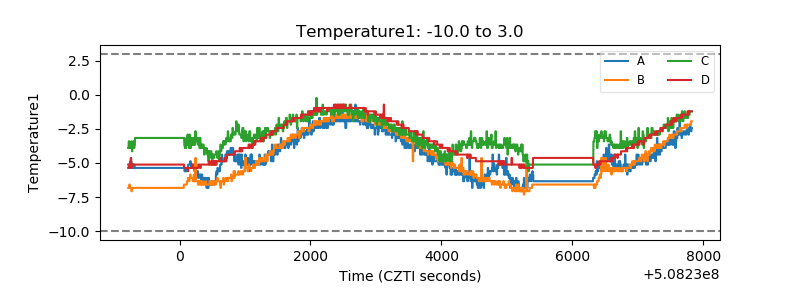 |
| Veto HV Monitor | 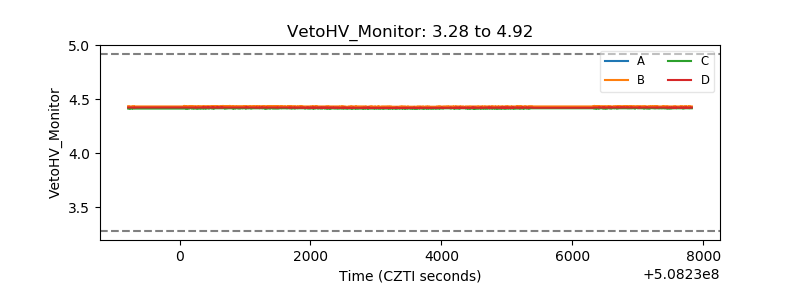 |
| Veto LLD | 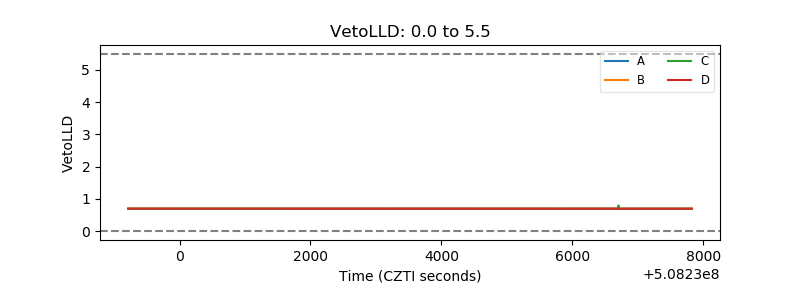 |
| Alpha Counter | 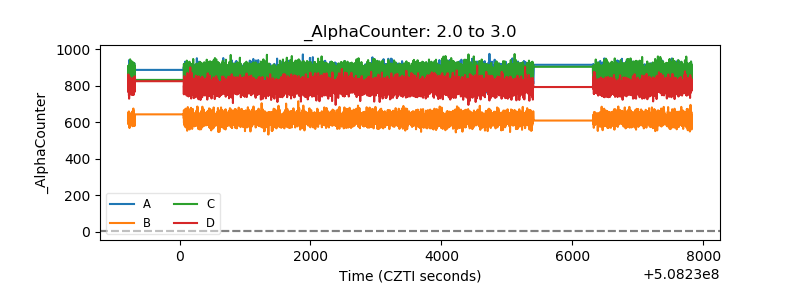 |
| _CPM_Rate | 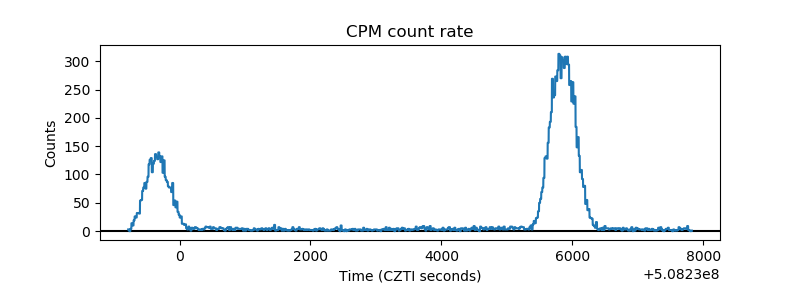 |
| CZT Counter | 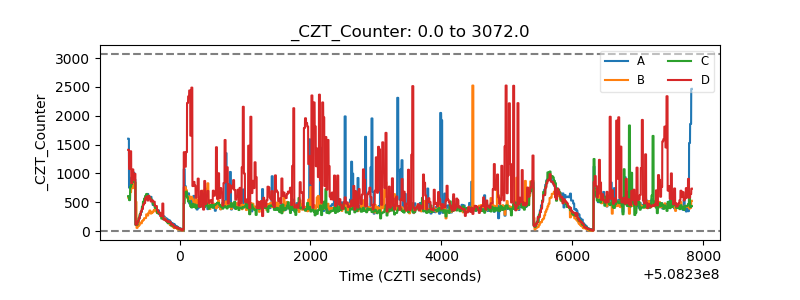 |
| +2.5 Volts monitor | 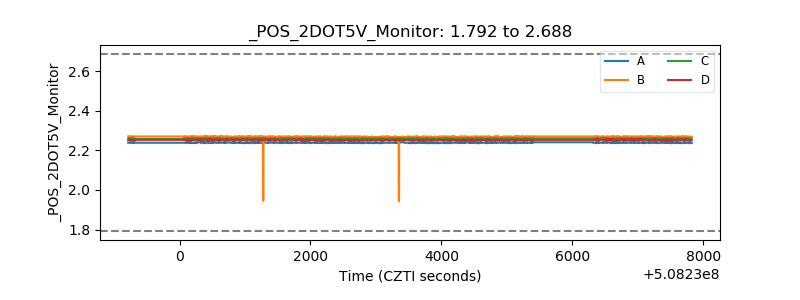 |
| +5 Volts monitor | 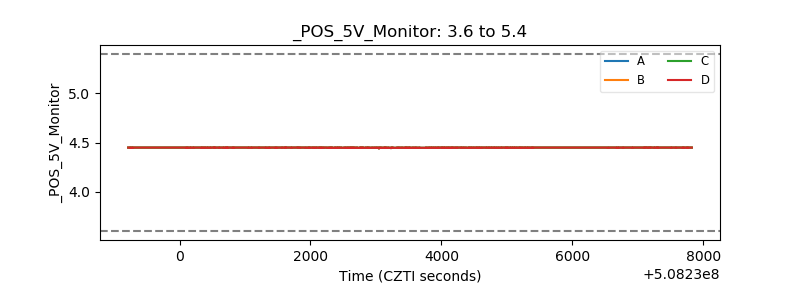 |
| _ROLL_ROT | 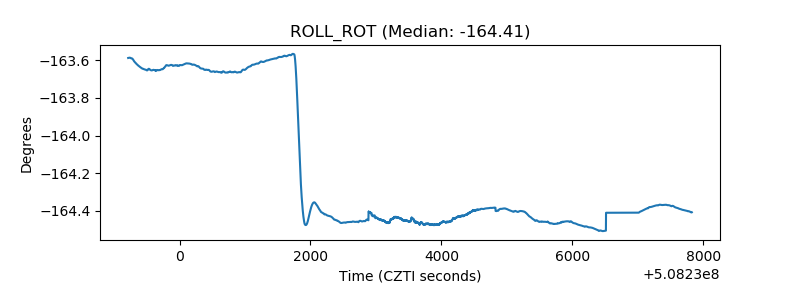 |
| _Roll_DEC | 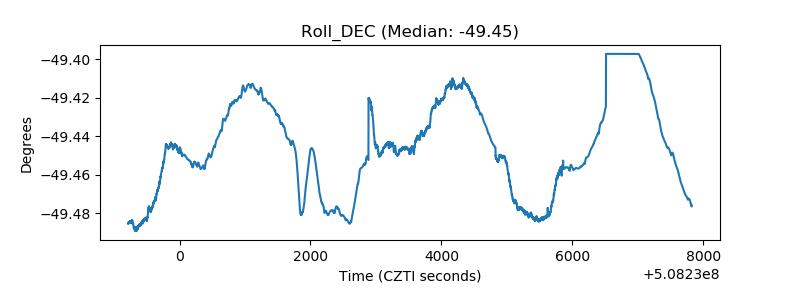 |
| _Roll_RA | 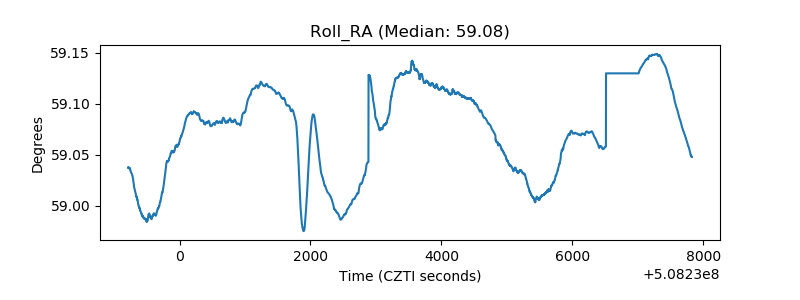 |
| Veto Counter | 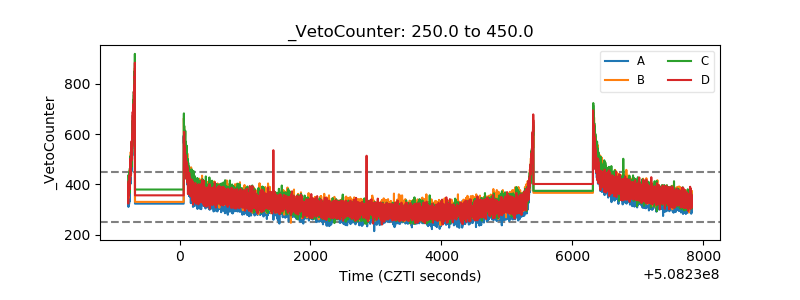 |