| Param | Original file | Final file |
|---|---|---|
| Filename | modeM0/AS1A14_083T03_9000006548_56083cztM0_level2.fits | modeM0/AS1A14_083T03_9000006548_56083cztM0_level2_quad_clean.evt |
| Size (bytes) | 392,690,880 | 86,906,880 |
| Size | 374.5 MB | 82.9 MB |
| Events in quadrant A | 4,892,900 | 540,158 |
| Events in quadrant B | 2,657,023 | 617,254 |
| Events in quadrant C | 2,697,064 | 550,941 |
| Events in quadrant D | 3,827,386 | 508,863 |
| Mode M0 | |||
|---|---|---|---|
| Quadrant | BADHDUFLAG | Total packets | Discarded packets |
| A | 0 | 18558 | 1 |
| B | 0 | 12212 | 1 |
| C | 0 | 12557 | 1 |
| D | 0 | 15454 | 1 |
| Mode SS | |||
|---|---|---|---|
| Quadrant | BADHDUFLAG | Total packets | Discarded packets |
| A | 0 | 120 | 0 |
| B | 0 | 120 | 0 |
| C | 0 | 120 | 0 |
| D | 0 | 120 | 0 |
| Mode M9 | |||
|---|---|---|---|
| Quadrant | BADHDUFLAG | Total packets | Discarded packets |
| A | 0 | 11 | 0 |
| B | 0 | 11 | 0 |
| C | 0 | 11 | 0 |
| D | 0 | 11 | 0 |
| Quadrant | Total seconds | Saturated seconds | Saturation percentage |
|---|---|---|---|
| A | 5933 | 539 | 9.084780% |
| B | 5933 | 51 | 0.859599% |
| C | 5933 | 55 | 0.927018% |
| D | 5933 | 169 | 2.848475% |
Noise dominated data is calculated using 1-second bins in cleaned event files. If a bin has >2000 counts, and if more than 50% of those come from <1% of pixels, then it is considered to be noise-dominated and hence unusable.
| Quadrant | # 1 sec bins | Bins with >0 counts | Bins with >2000 counts | High rate bins dominated by noise | Noise dominated (total time) | Noise dominated (detector-on time) | Marked lightcurve |
|---|---|---|---|---|---|---|---|
| A | 6988 | 5934 | 549 | 549 | 7.86% | 9.25% | 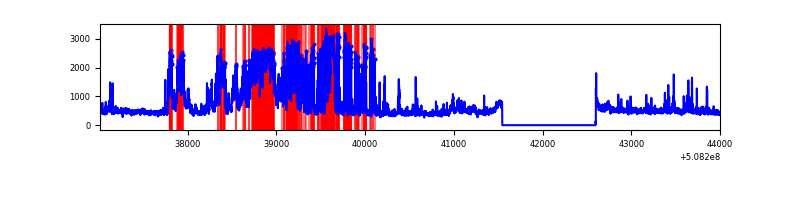 |
| B | 6988 | 5934 | 6 | 6 | 0.09% | 0.10% | 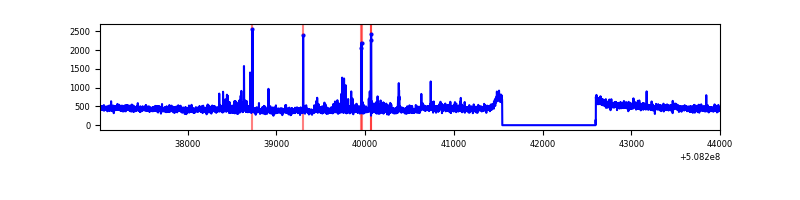 |
| C | 6988 | 5934 | 12 | 12 | 0.17% | 0.20% | 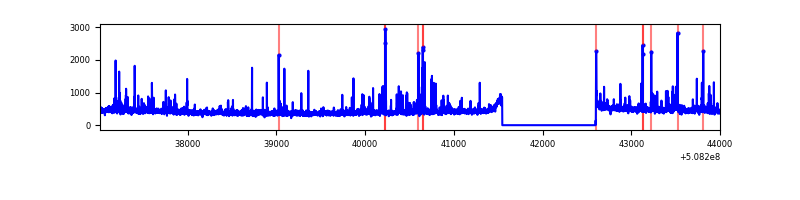 |
| D | 6988 | 5934 | 149 | 149 | 2.13% | 2.51% | 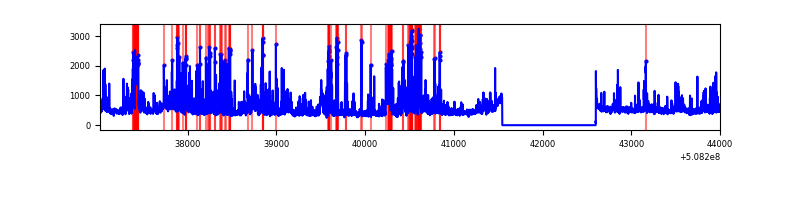 |
Top three noisy pixels from each quadrant. If the there are fewer than three noisy pixels in the level2.evt file, extra rows are filled as -1
| Pixel properties | Quadrant properties | ||||||
|---|---|---|---|---|---|---|---|
| Quadrant | DetID | PixID | Counts | Sigma | Mean | Median | Sigma |
| A | 12 | 115 | 1253092 | 8083.74 | 623 | 606 | 154.9 |
| A | 7 | 64 | 864046 | 5572.78 | 623 | 606 | 154.9 |
| A | 15 | 32 | 272518 | 1754.96 | 623 | 606 | 154.9 |
| B | 10 | 247 | 36974 | 267.11 | 629 | 606 | 136.2 |
| B | 0 | 231 | 30831 | 221.99 | 629 | 606 | 136.2 |
| B | 0 | 213 | 24868 | 178.2 | 629 | 606 | 136.2 |
| C | 12 | 252 | 214407 | 1254.53 | 616 | 609 | 170.4 |
| C | 15 | 165 | 38836 | 224.31 | 616 | 609 | 170.4 |
| C | 12 | 249 | 10702 | 59.22 | 616 | 609 | 170.4 |
| D | 11 | 129 | 407874 | 2303.43 | 614 | 584 | 176.8 |
| D | 2 | 249 | 383658 | 2166.48 | 614 | 584 | 176.8 |
| D | 8 | 240 | 193991 | 1093.81 | 614 | 584 | 176.8 |
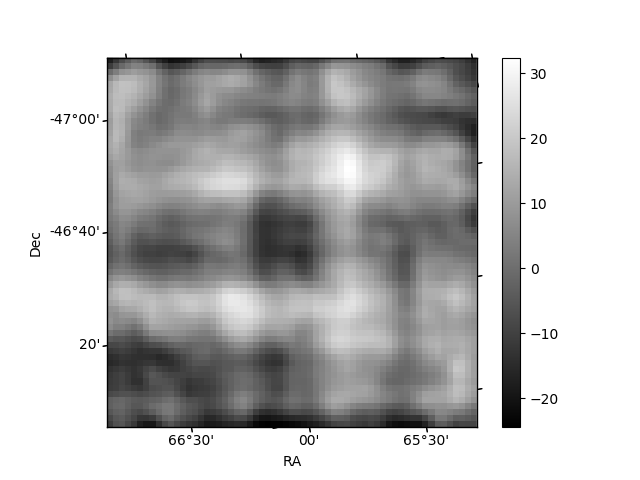
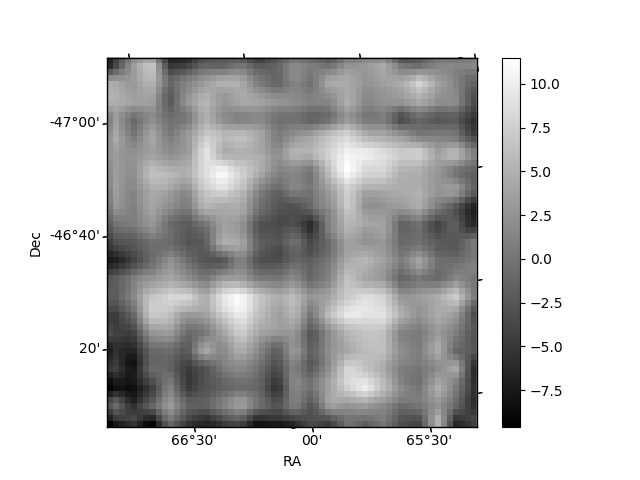
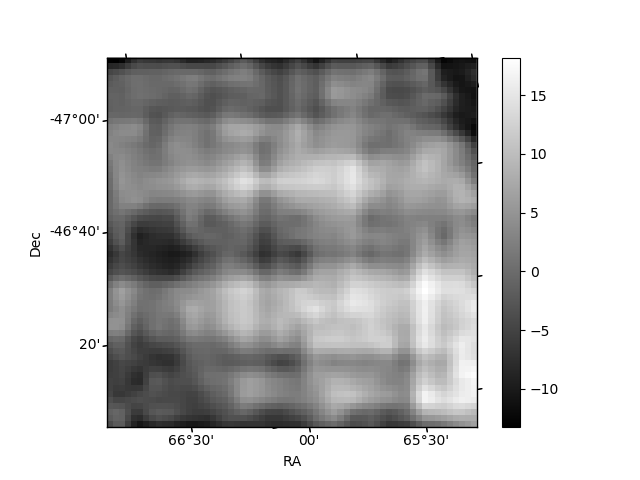
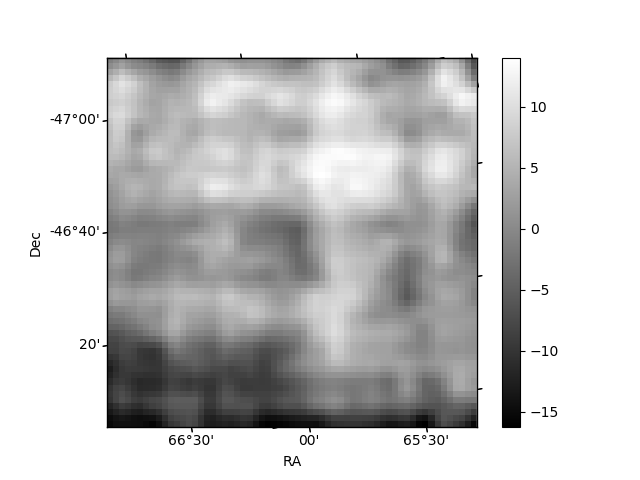
Histogram calculated using DETX and DETY for each event in the final _common_clean file
| Quadrant A | 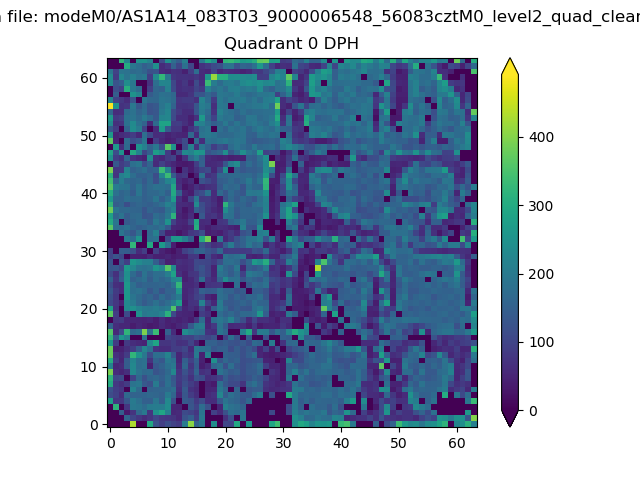 |
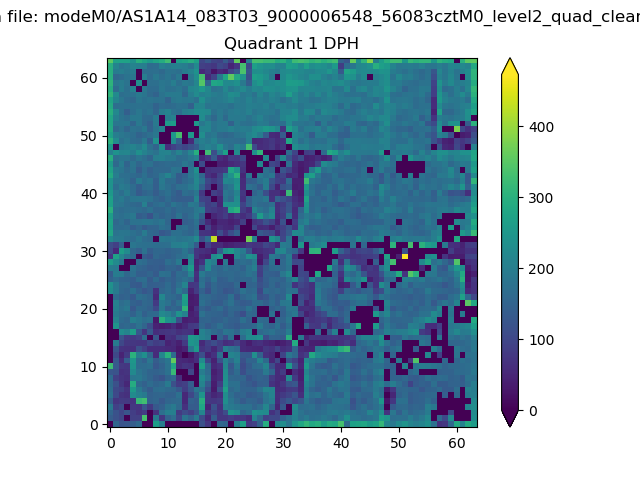 |
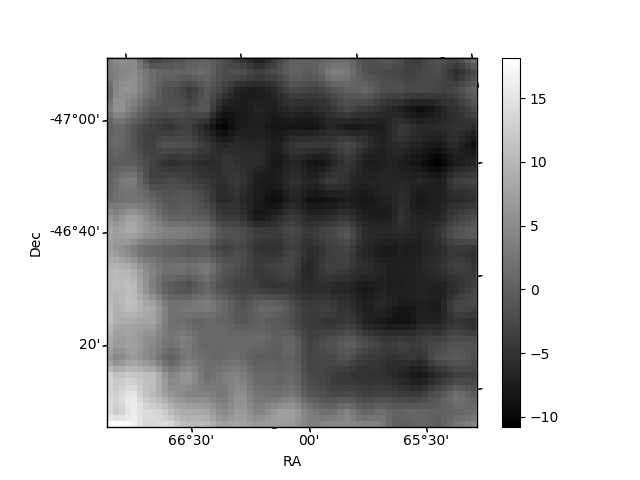
Quadrant B |
|---|---|---|---|
| Quadrant D | 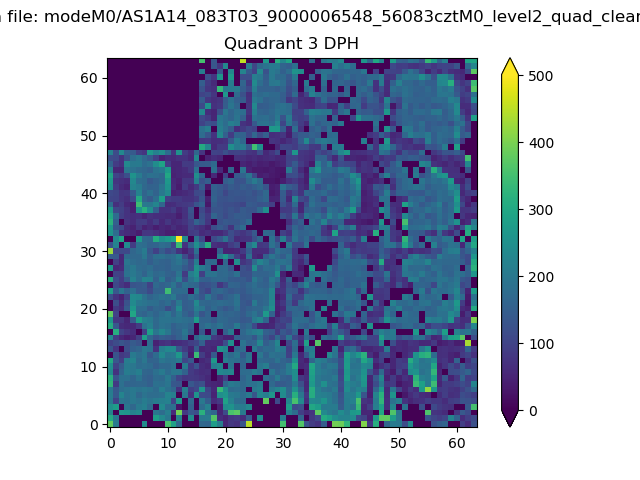 |
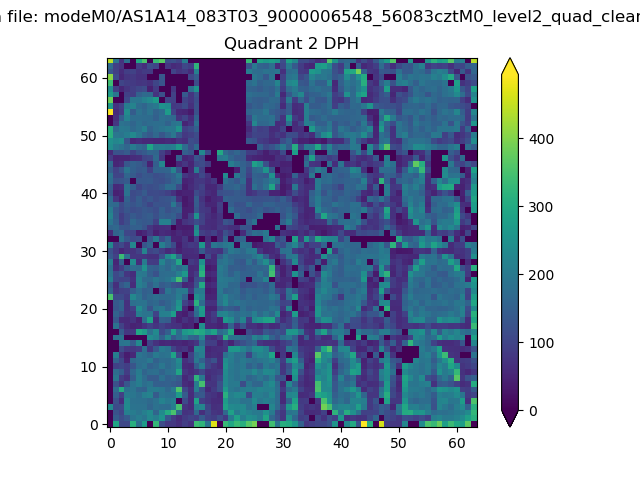 |
Quadrant C |
| Plot type | Count rate plots | Images |
|---|---|---|
| Comparison with Poisson distribution Blue bars denote a histogram of data divided into 1 sec bins. Red curve is a Poisson curve with rate = median count rate of data. |
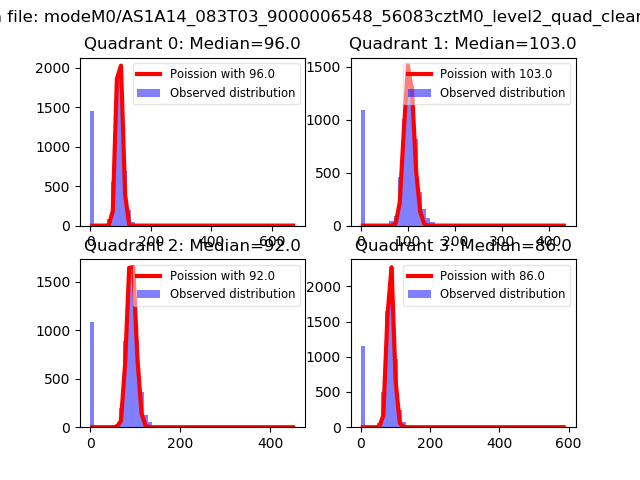 |
 |
| Quadrant-wise count rates Data is divided into 100 sec bins |
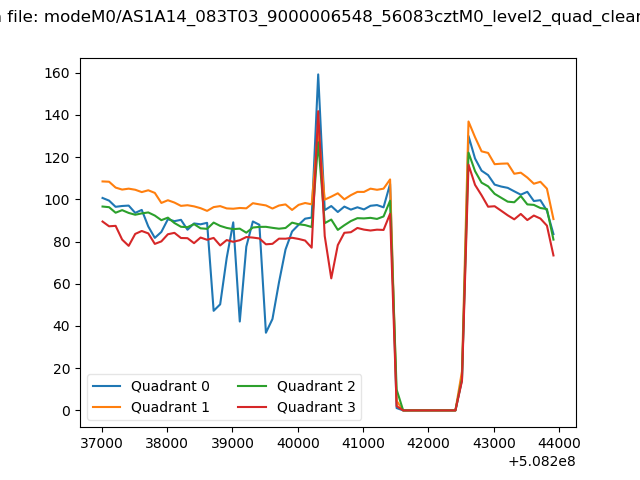 |
|
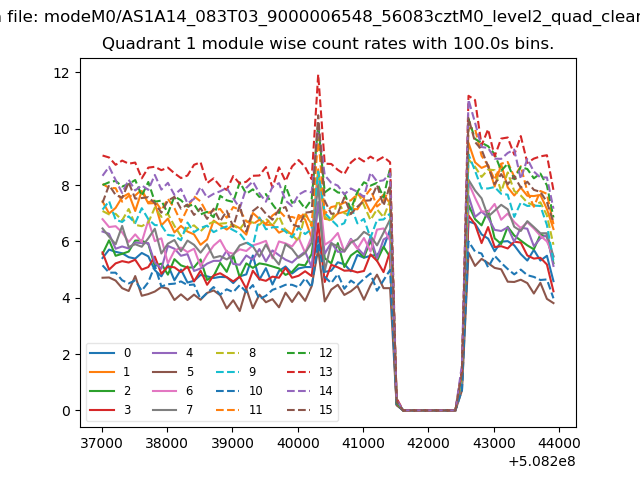
| Module-wise count rates for Quadrant A Data is divided into 100 sec bins |
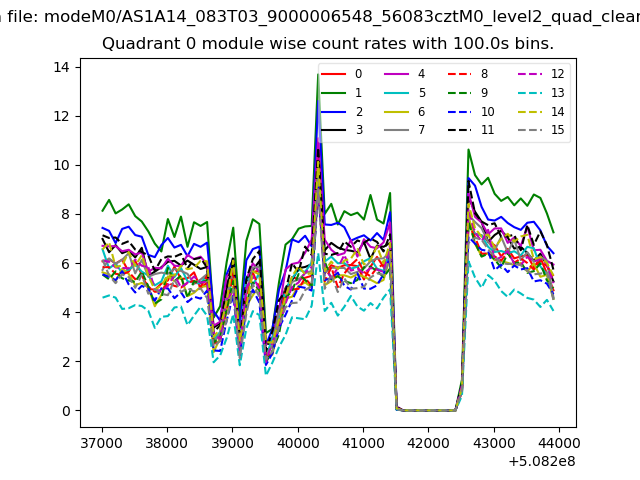 |
 |
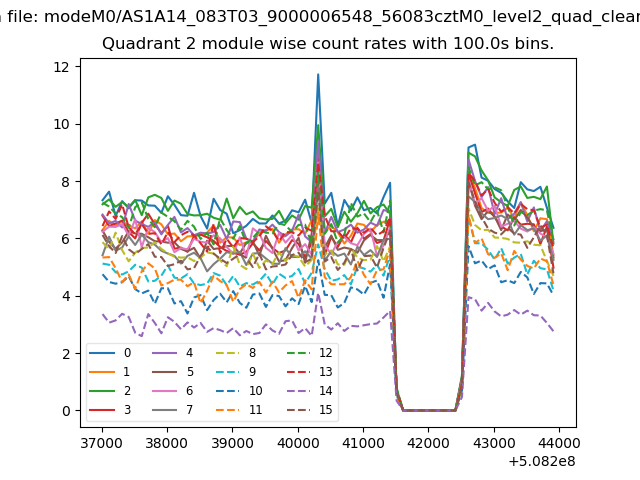
| Module-wise count rates for Quadrant B Data is divided into 100 sec bins |
 |
 |
| Module-wise count rates for Quadrant C Data is divided into 100 sec bins |
 |
 |
| Module-wise count rates for Quadrant D Data is divided into 100 sec bins |
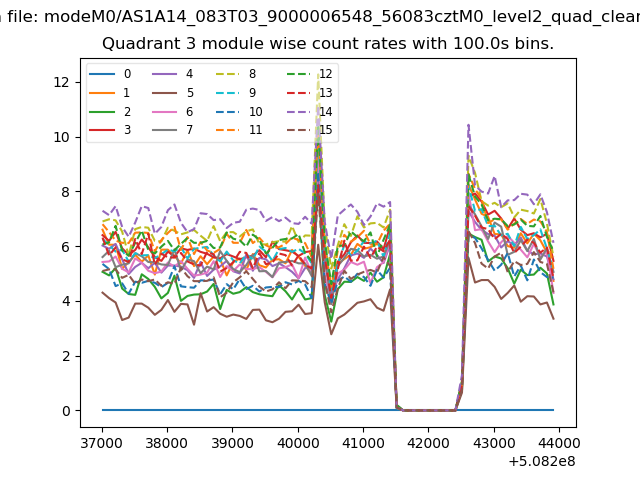 |
 |
| Parameter | Plot |
|---|---|
| CZT HV Monitor | 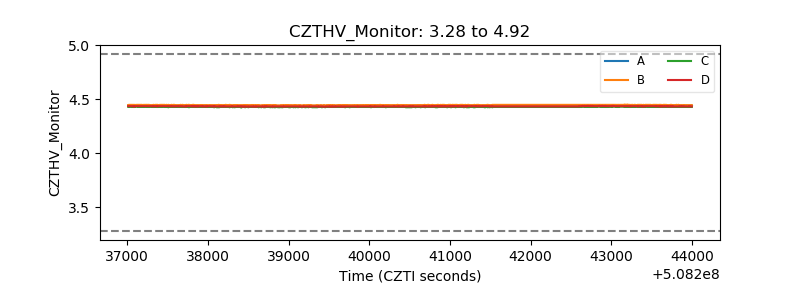 |
| D_VDD | 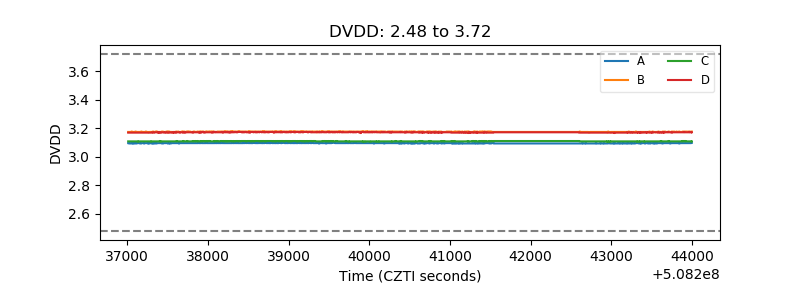 |
| Temperature 1 | 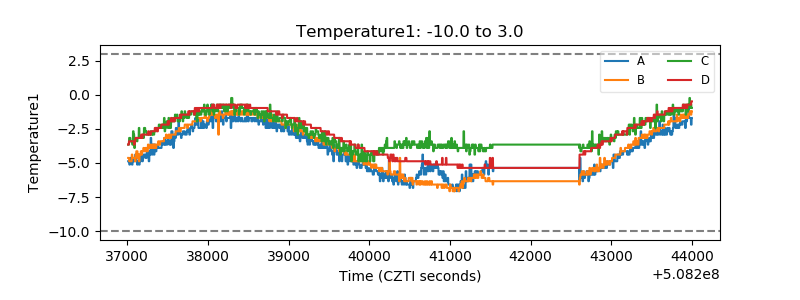 |
| Veto HV Monitor | 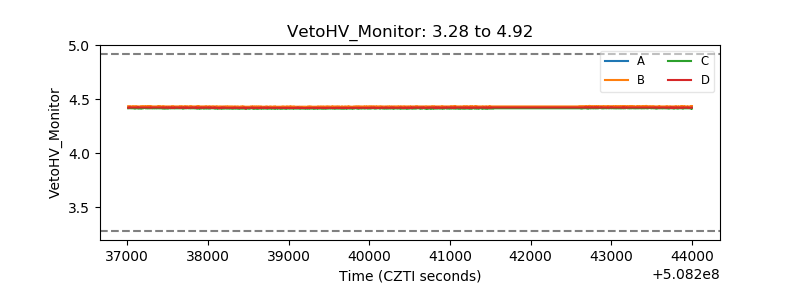 |
| Veto LLD | 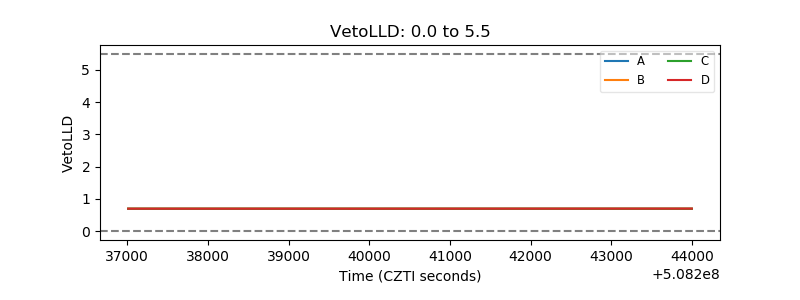 |
| Alpha Counter | 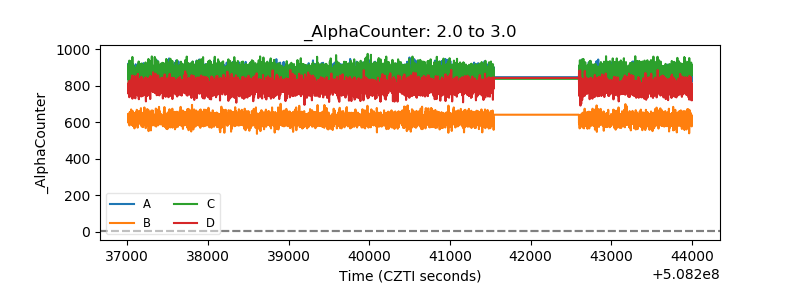 |
| _CPM_Rate | 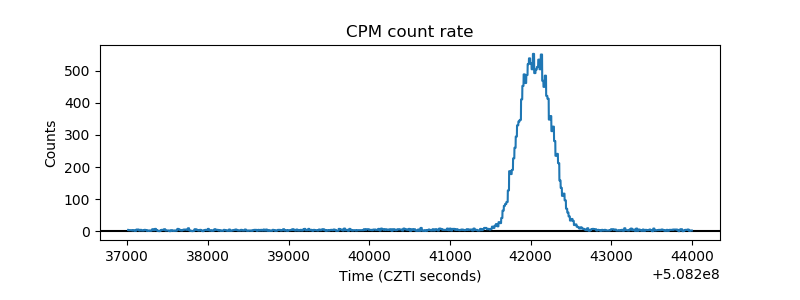 |
| CZT Counter | 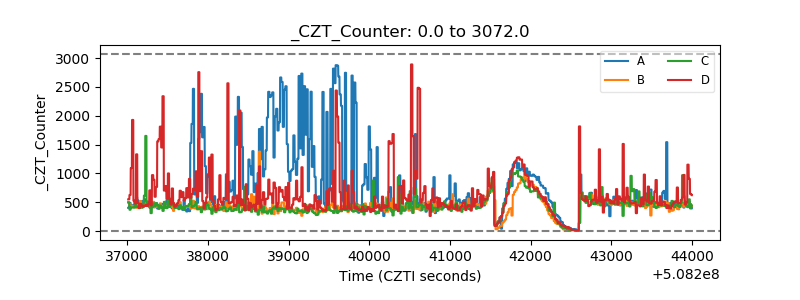 |
| +2.5 Volts monitor |  |
| +5 Volts monitor |  |
| _ROLL_ROT | 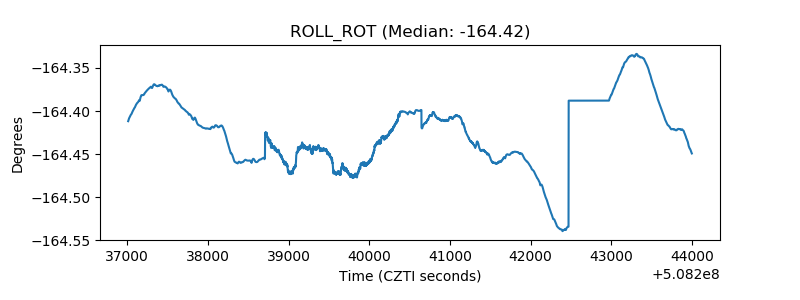 |
| _Roll_DEC | 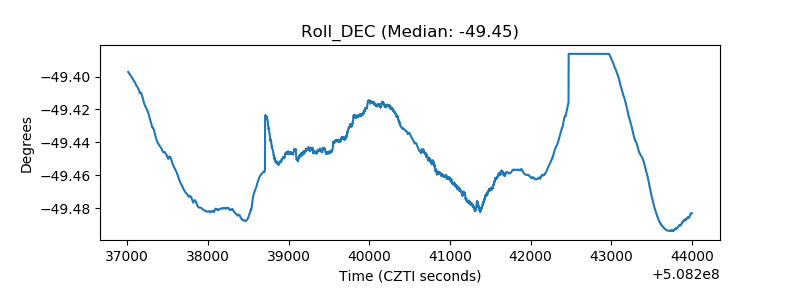 |
| _Roll_RA | 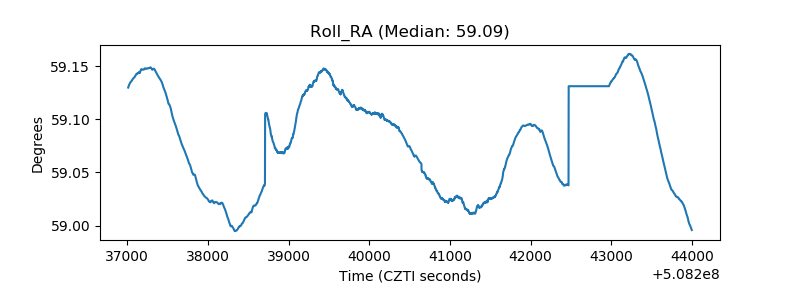 |
| Veto Counter | 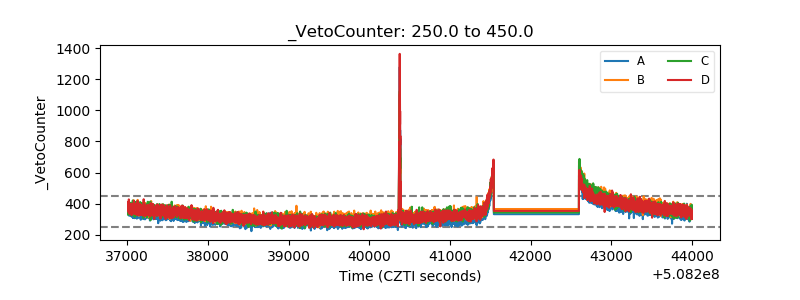 |