| Param | Original file | Final file |
|---|---|---|
| Filename | modeM0/AS1A14_083T03_9000006548_56084cztM0_level2.fits | modeM0/AS1A14_083T03_9000006548_56084cztM0_level2_quad_clean.evt |
| Size (bytes) | 382,383,360 | 95,613,120 |
| Size | 364.7 MB | 91.2 MB |
| Events in quadrant A | 3,619,651 | 622,022 |
| Events in quadrant B | 3,011,231 | 674,841 |
| Events in quadrant C | 3,097,441 | 599,407 |
| Events in quadrant D | 3,928,527 | 552,872 |
| Mode M0 | |||
|---|---|---|---|
| Quadrant | BADHDUFLAG | Total packets | Discarded packets |
| A | 0 | 15107 | 5 |
| B | 0 | 13444 | 1 |
| C | 0 | 13928 | 1 |
| D | 0 | 15975 | 1 |
| Mode SS | |||
|---|---|---|---|
| Quadrant | BADHDUFLAG | Total packets | Discarded packets |
| A | 0 | 130 | 0 |
| B | 0 | 130 | 0 |
| C | 0 | 130 | 0 |
| D | 0 | 130 | 0 |
| Mode M9 | |||
|---|---|---|---|
| Quadrant | BADHDUFLAG | Total packets | Discarded packets |
| A | 0 | 11 | 0 |
| B | 0 | 11 | 0 |
| C | 0 | 11 | 0 |
| D | 0 | 11 | 0 |
| Quadrant | Total seconds | Saturated seconds | Saturation percentage |
|---|---|---|---|
| A | 6393 | 143 | 2.236822% |
| B | 6394 | 69 | 1.079137% |
| C | 6394 | 59 | 0.922740% |
| D | 6394 | 180 | 2.815139% |
Noise dominated data is calculated using 1-second bins in cleaned event files. If a bin has >2000 counts, and if more than 50% of those come from <1% of pixels, then it is considered to be noise-dominated and hence unusable.
| Quadrant | # 1 sec bins | Bins with >0 counts | Bins with >2000 counts | High rate bins dominated by noise | Noise dominated (total time) | Noise dominated (detector-on time) | Marked lightcurve |
|---|---|---|---|---|---|---|---|
| A | 7513 | 6394 | 92 | 92 | 1.22% | 1.44% | 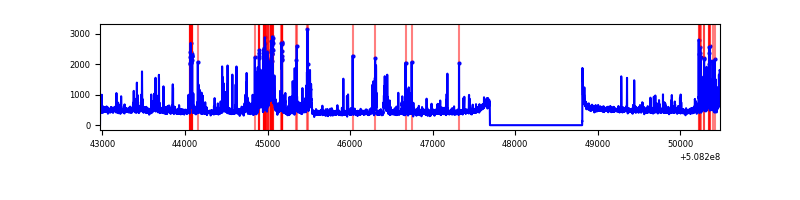 |
| B | 7514 | 6395 | 5 | 5 | 0.07% | 0.08% | 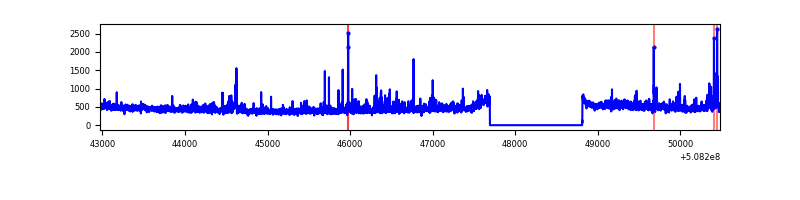 |
| C | 7514 | 6395 | 23 | 23 | 0.31% | 0.36% | 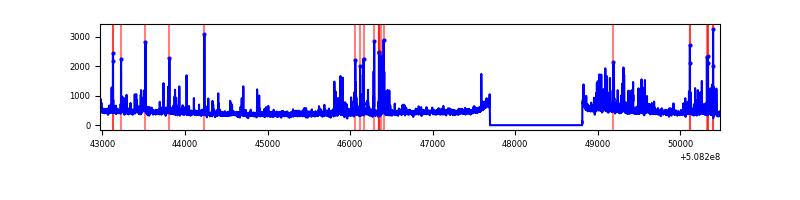 |
| D | 7514 | 6395 | 148 | 148 | 1.97% | 2.31% | 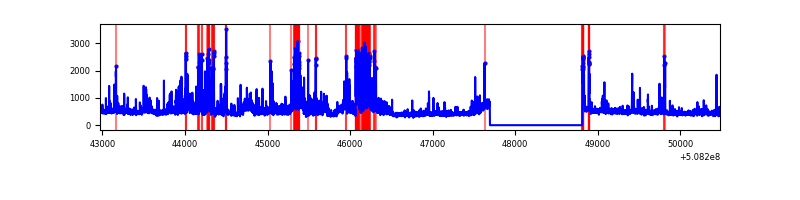 |
Top three noisy pixels from each quadrant. If the there are fewer than three noisy pixels in the level2.evt file, extra rows are filled as -1
| Pixel properties | Quadrant properties | ||||||
|---|---|---|---|---|---|---|---|
| Quadrant | DetID | PixID | Counts | Sigma | Mean | Median | Sigma |
| A | 15 | 32 | 536477 | 3146.78 | 694 | 677 | 170.3 |
| A | 7 | 64 | 176638 | 1033.43 | 694 | 677 | 170.3 |
| A | 12 | 115 | 64241 | 373.31 | 694 | 677 | 170.3 |
| B | 0 | 231 | 67784 | 459.16 | 684 | 660 | 146.2 |
| B | 0 | 213 | 66671 | 451.55 | 684 | 660 | 146.2 |
| B | 2 | 249 | 56482 | 381.85 | 684 | 660 | 146.2 |
| C | 12 | 252 | 258225 | 1402.3 | 666 | 655 | 183.7 |
| C | 15 | 165 | 121224 | 656.42 | 666 | 655 | 183.7 |
| C | 15 | 199 | 59460 | 320.15 | 666 | 655 | 183.7 |
| D | 2 | 249 | 488049 | 2585.4 | 663 | 633 | 188.5 |
| D | 8 | 245 | 320784 | 1698.18 | 663 | 633 | 188.5 |
| D | 8 | 240 | 126877 | 669.64 | 663 | 633 | 188.5 |
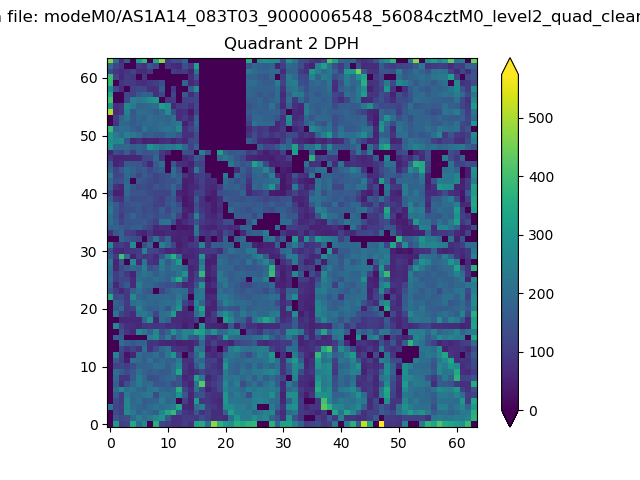
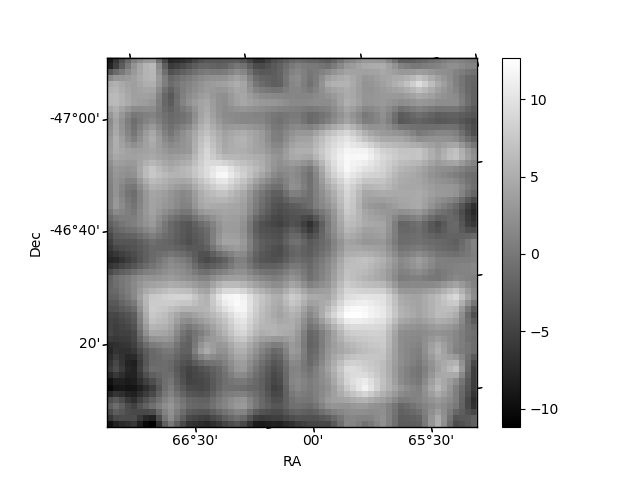
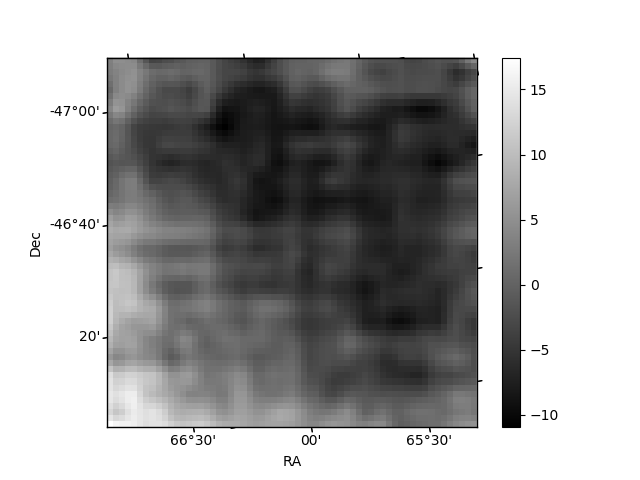
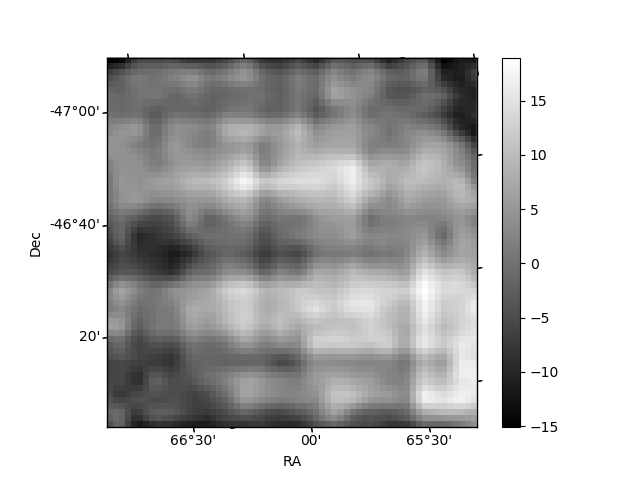
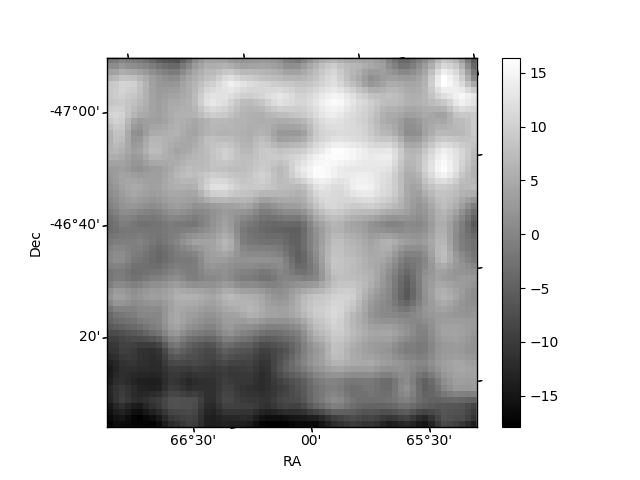
Histogram calculated using DETX and DETY for each event in the final _common_clean file
| Quadrant A | 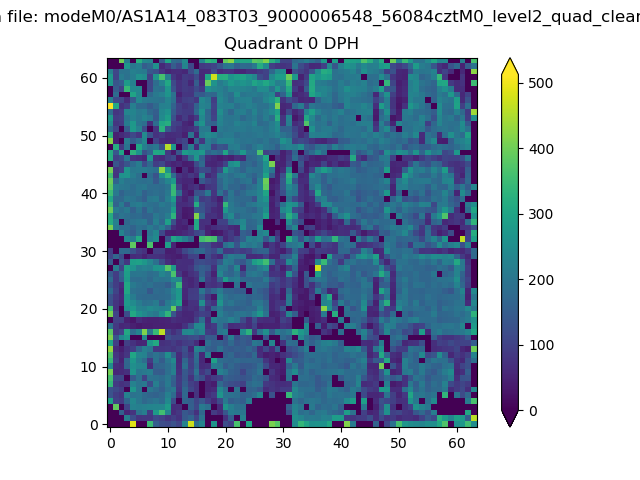 |
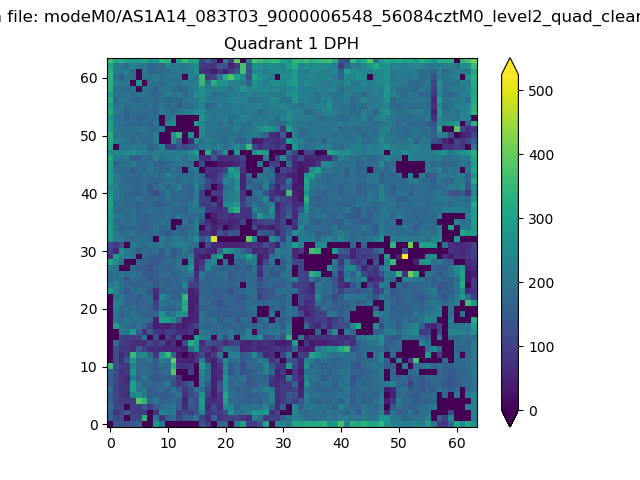 |
Quadrant B |
|---|---|---|---|
| Quadrant D | 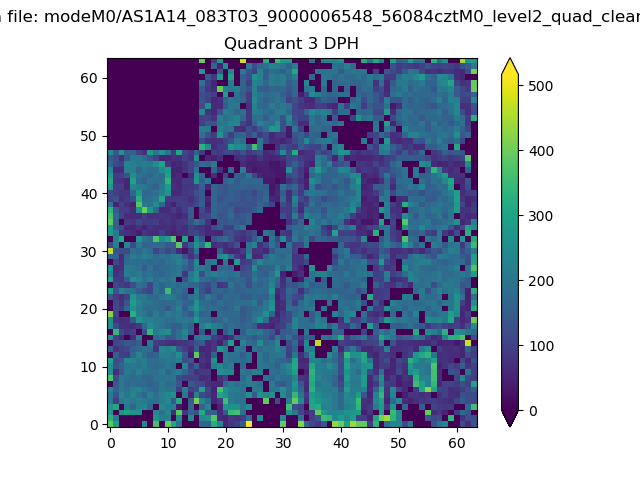 |
 |
Quadrant C |
| Plot type | Count rate plots | Images |
|---|---|---|
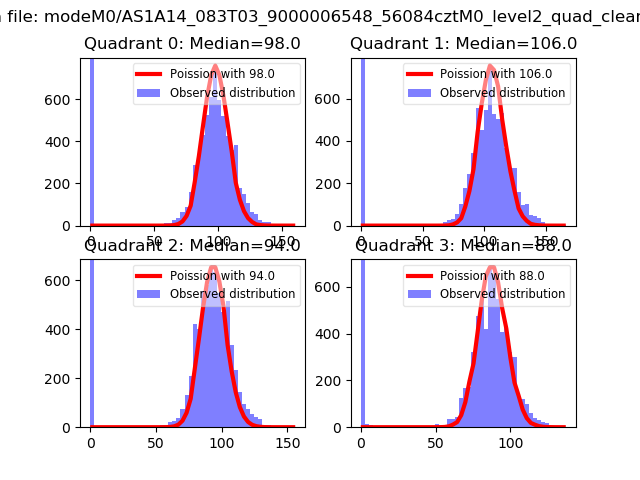
| Comparison with Poisson distribution Blue bars denote a histogram of data divided into 1 sec bins. Red curve is a Poisson curve with rate = median count rate of data. |
 |
 |
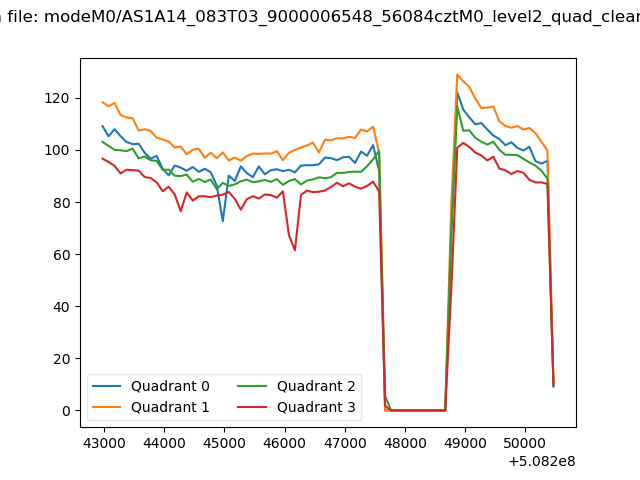
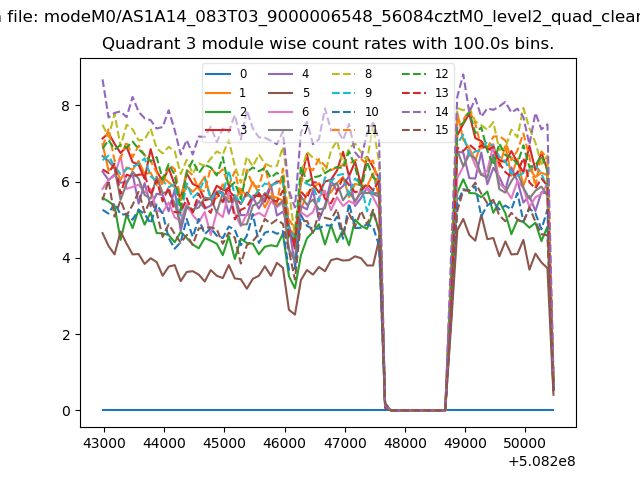
| Quadrant-wise count rates Data is divided into 100 sec bins |
 |
|
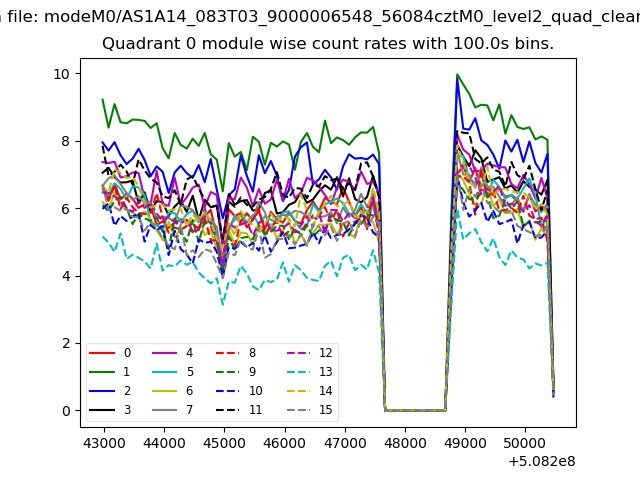
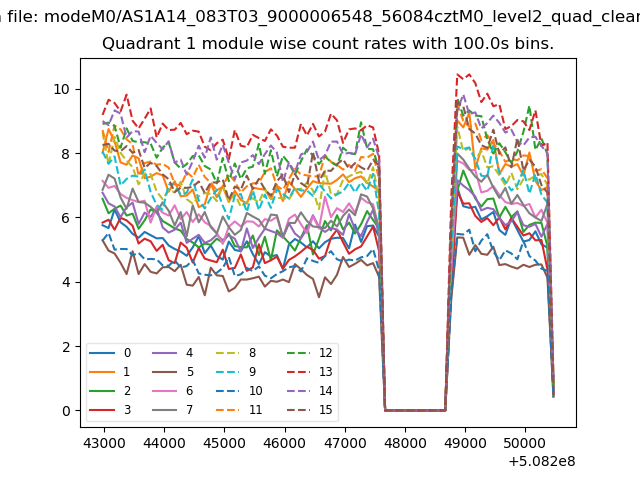
| Module-wise count rates for Quadrant A Data is divided into 100 sec bins |
 |
 |
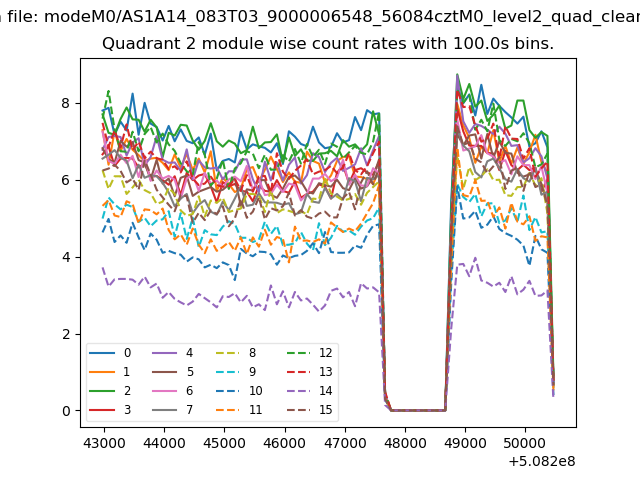
| Module-wise count rates for Quadrant B Data is divided into 100 sec bins |
 |
 |
| Module-wise count rates for Quadrant C Data is divided into 100 sec bins |
 |
 |
| Module-wise count rates for Quadrant D Data is divided into 100 sec bins |
 |
 |
| Parameter | Plot |
|---|---|
| CZT HV Monitor |  |
| D_VDD | 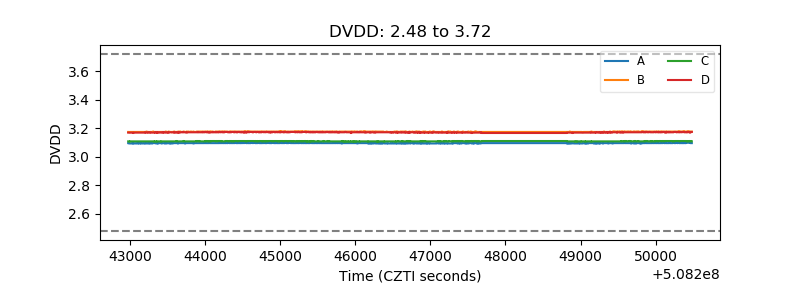 |
| Temperature 1 | 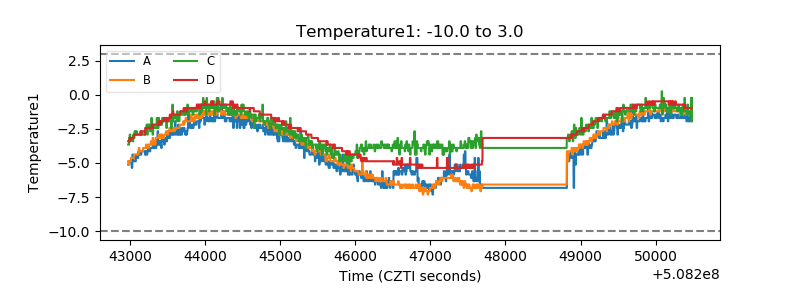 |
| Veto HV Monitor | 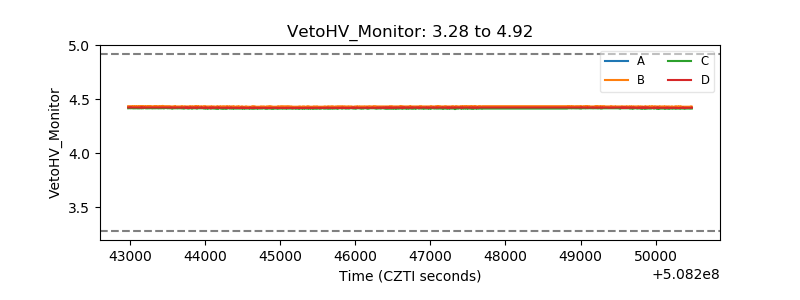 |
| Veto LLD | 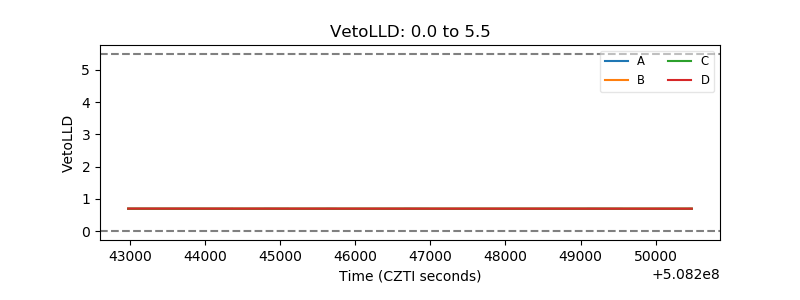 |
| Alpha Counter | 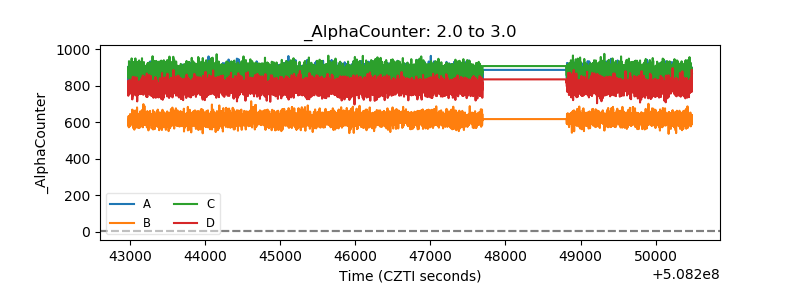 |
| _CPM_Rate | 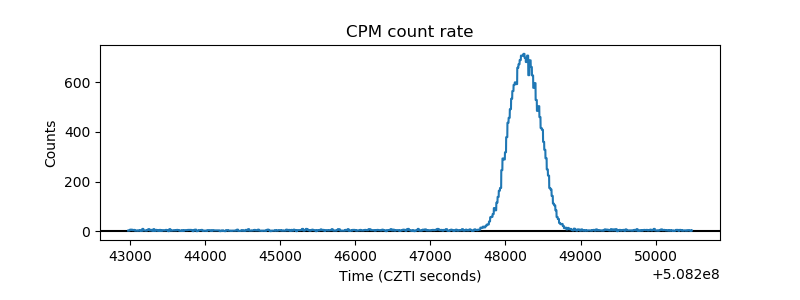 |
| CZT Counter | 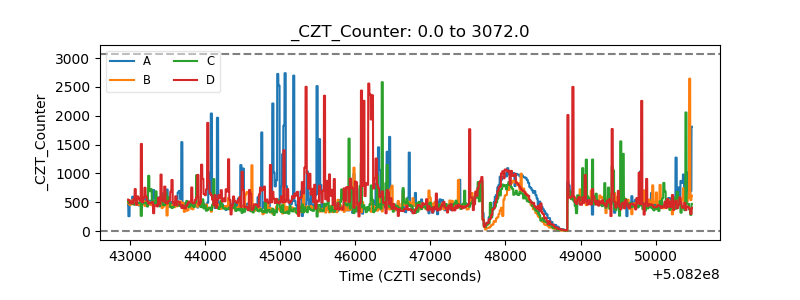 |
| +2.5 Volts monitor |  |
| +5 Volts monitor |  |
| _ROLL_ROT | 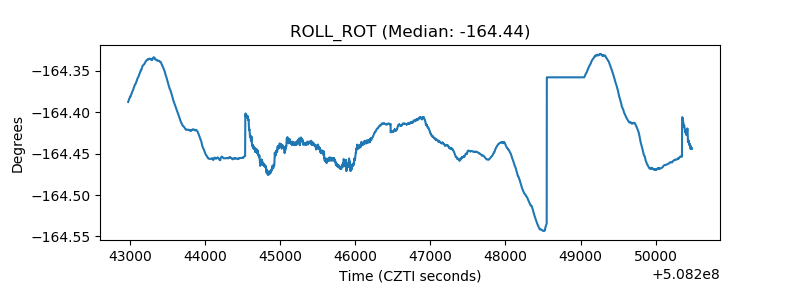 |
| _Roll_DEC | 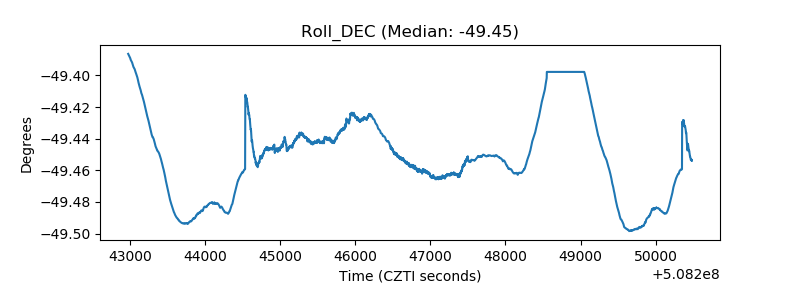 |
| _Roll_RA | 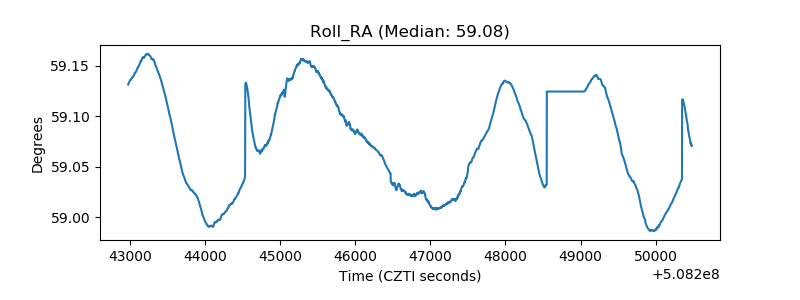 |
| Veto Counter | 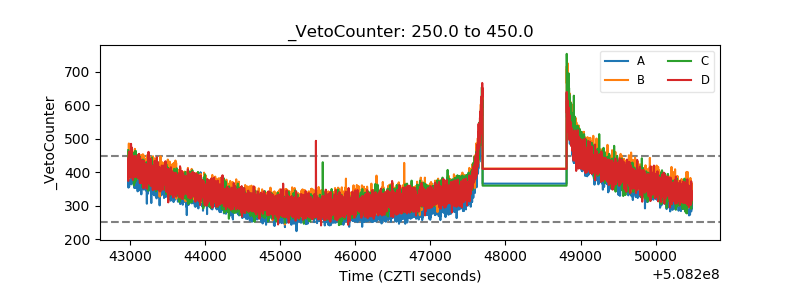 |