| Param | Original file | Final file |
|---|---|---|
| Filename | modeM0/AS1A14_083T03_9000006548_56086cztM0_level2.fits | modeM0/AS1A14_083T03_9000006548_56086cztM0_level2_quad_clean.evt |
| Size (bytes) | 637,591,680 | 76,173,120 |
| Size | 608.1 MB | 72.6 MB |
| Events in quadrant A | 10,370,802 | 294,106 |
| Events in quadrant B | 2,916,755 | 633,291 |
| Events in quadrant C | 4,309,429 | 524,687 |
| Events in quadrant D | 5,533,050 | 430,822 |
| Mode M0 | |||
|---|---|---|---|
| Quadrant | BADHDUFLAG | Total packets | Discarded packets |
| A | 0 | 34968 | 1 |
| B | 0 | 13119 | 1 |
| C | 0 | 17288 | 1 |
| D | 0 | 20750 | 5 |
| Mode SS | |||
|---|---|---|---|
| Quadrant | BADHDUFLAG | Total packets | Discarded packets |
| A | 0 | 122 | 0 |
| B | 0 | 122 | 0 |
| C | 0 | 122 | 0 |
| D | 0 | 122 | 0 |
| Mode M9 | |||
|---|---|---|---|
| Quadrant | BADHDUFLAG | Total packets | Discarded packets |
| A | 0 | 11 | 0 |
| B | 0 | 11 | 0 |
| C | 0 | 11 | 0 |
| D | 0 | 11 | 0 |
| Quadrant | Total seconds | Saturated seconds | Saturation percentage |
|---|---|---|---|
| A | 6068 | 3194 | 52.636783% |
| B | 6068 | 94 | 1.549110% |
| C | 6069 | 528 | 8.699951% |
| D | 6068 | 1151 | 18.968359% |
Noise dominated data is calculated using 1-second bins in cleaned event files. If a bin has >2000 counts, and if more than 50% of those come from <1% of pixels, then it is considered to be noise-dominated and hence unusable.
| Quadrant | # 1 sec bins | Bins with >0 counts | Bins with >2000 counts | High rate bins dominated by noise | Noise dominated (total time) | Noise dominated (detector-on time) | Marked lightcurve |
|---|---|---|---|---|---|---|---|
| A | 7193 | 6069 | 3168 | 3168 | 44.04% | 52.20% | 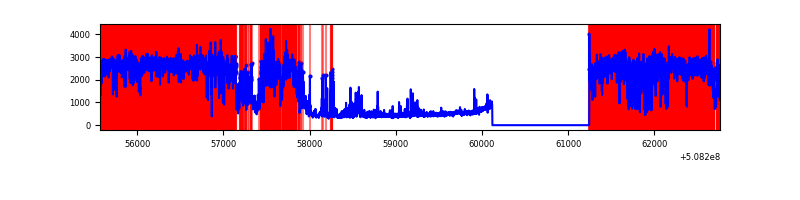 |
| B | 7193 | 6069 | 28 | 28 | 0.39% | 0.46% | 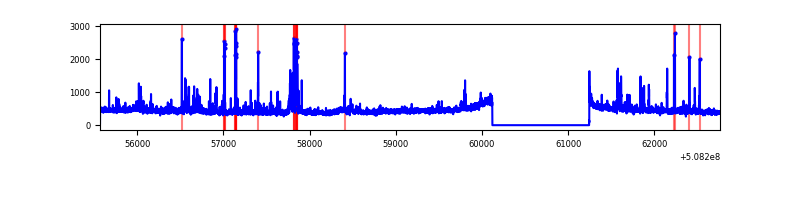 |
| C | 7194 | 6070 | 465 | 465 | 6.46% | 7.66% | 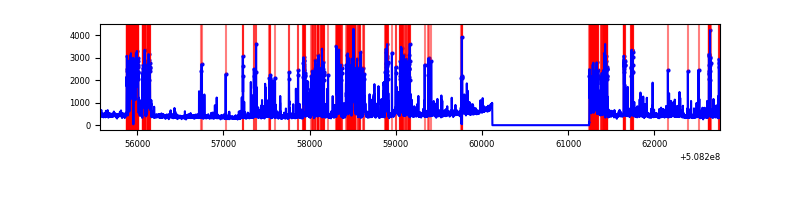 |
| D | 7193 | 6069 | 927 | 927 | 12.89% | 15.27% | 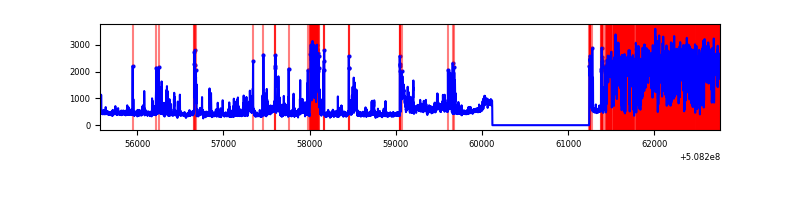 |
Top three noisy pixels from each quadrant. If the there are fewer than three noisy pixels in the level2.evt file, extra rows are filled as -1
| Pixel properties | Quadrant properties | ||||||
|---|---|---|---|---|---|---|---|
| Quadrant | DetID | PixID | Counts | Sigma | Mean | Median | Sigma |
| A | 12 | 115 | 6410214 | 53573.79 | 473 | 461 | 119.6 |
| A | 15 | 32 | 1747586 | 14602.76 | 473 | 461 | 119.6 |
| A | 3 | 14 | 143543 | 1195.9 | 473 | 461 | 119.6 |
| B | 5 | 172 | 88150 | 639.88 | 641 | 617 | 136.8 |
| B | 0 | 231 | 75803 | 549.63 | 641 | 617 | 136.8 |
| B | 10 | 247 | 71562 | 518.62 | 641 | 617 | 136.8 |
| C | 6 | 223 | 839556 | 5079.41 | 598 | 593 | 165.2 |
| C | 12 | 252 | 543502 | 3286.98 | 598 | 593 | 165.2 |
| C | 12 | 254 | 369180 | 2231.57 | 598 | 593 | 165.2 |
| D | 2 | 62 | 2362681 | 15042.93 | 551 | 524 | 157.0 |
| D | 6 | 42 | 320497 | 2037.69 | 551 | 524 | 157.0 |
| D | 8 | 245 | 269862 | 1715.23 | 551 | 524 | 157.0 |
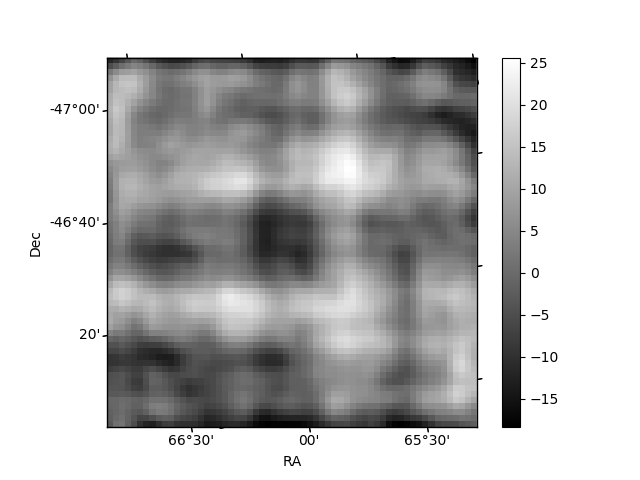
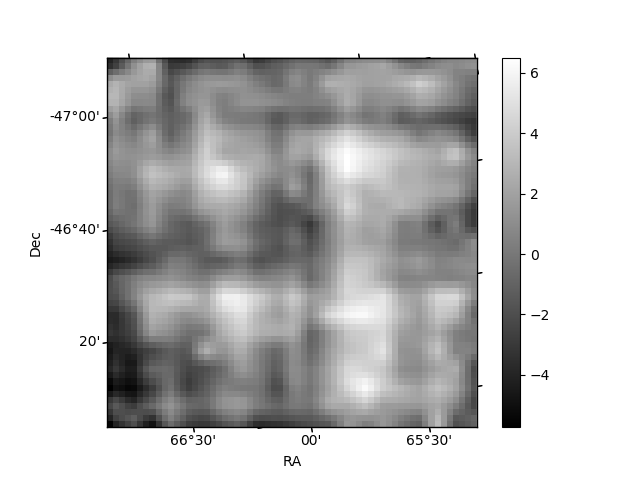
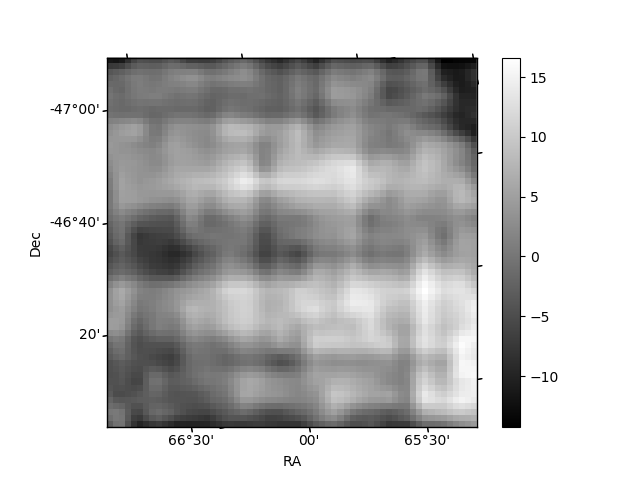
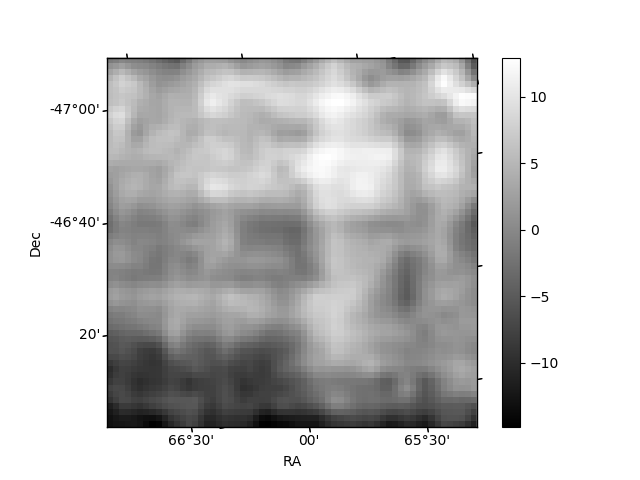
Histogram calculated using DETX and DETY for each event in the final _common_clean file
| Quadrant A | 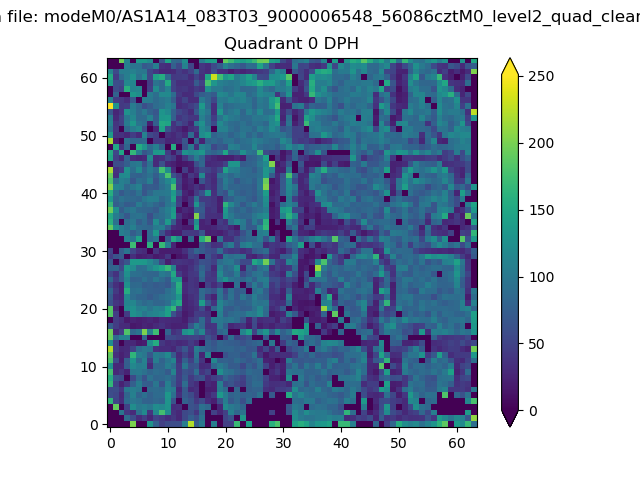 |
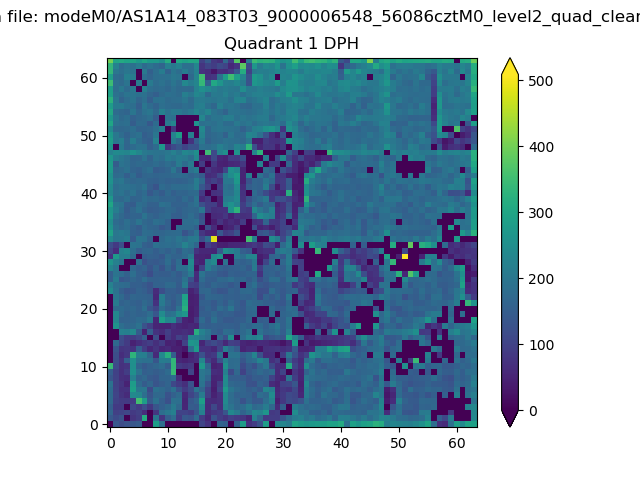 |
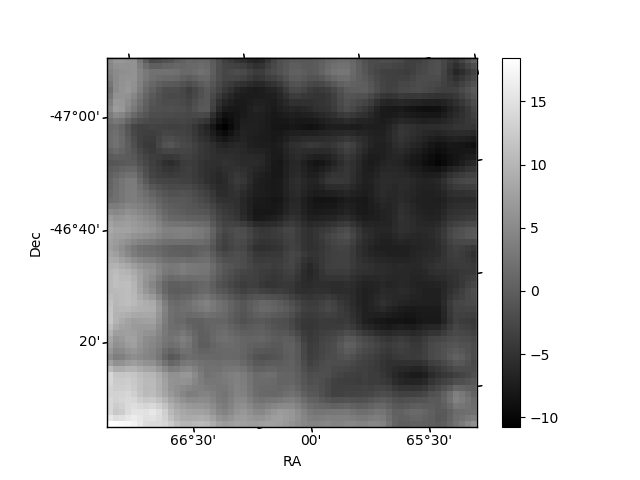
Quadrant B |
|---|---|---|---|
| Quadrant D | 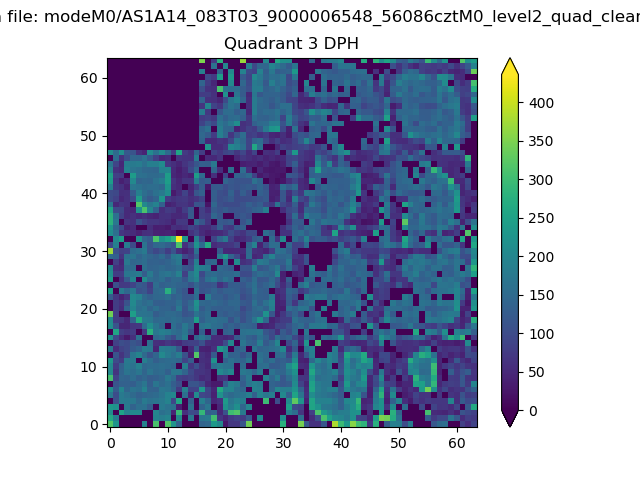 |
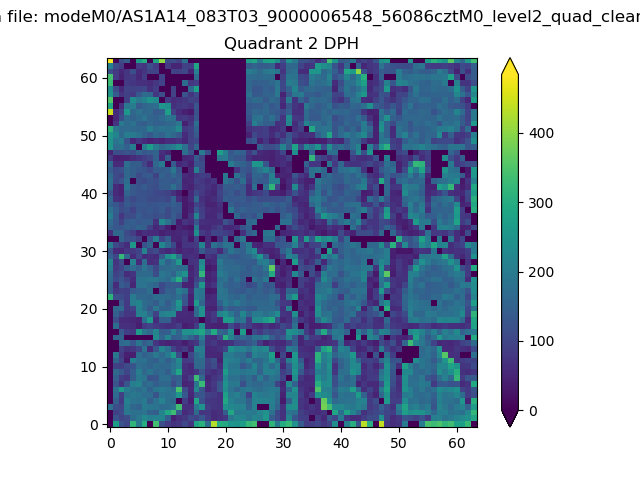 |
Quadrant C |
| Plot type | Count rate plots | Images |
|---|---|---|
| Comparison with Poisson distribution Blue bars denote a histogram of data divided into 1 sec bins. Red curve is a Poisson curve with rate = median count rate of data. |
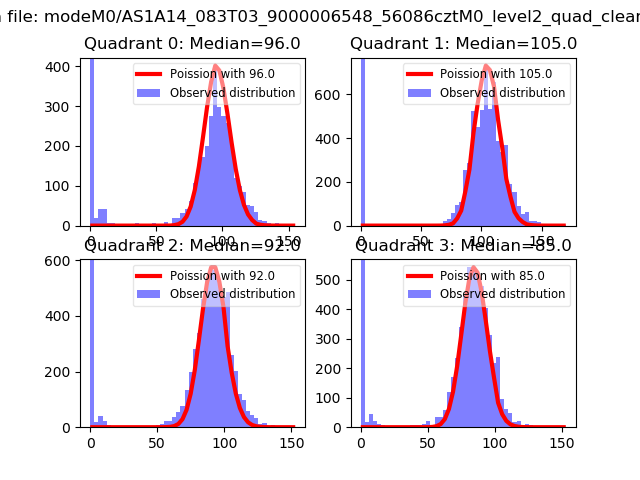 |
 |
| Quadrant-wise count rates Data is divided into 100 sec bins |
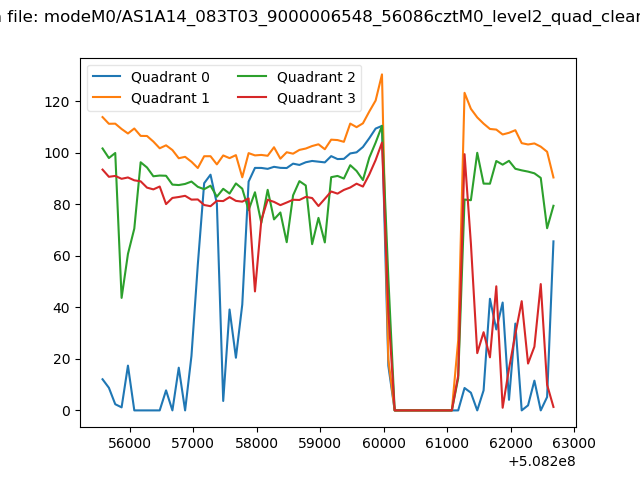 |
|
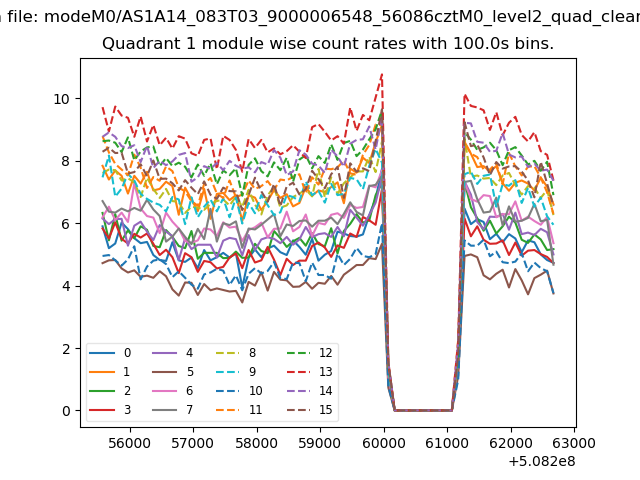
| Module-wise count rates for Quadrant A Data is divided into 100 sec bins |
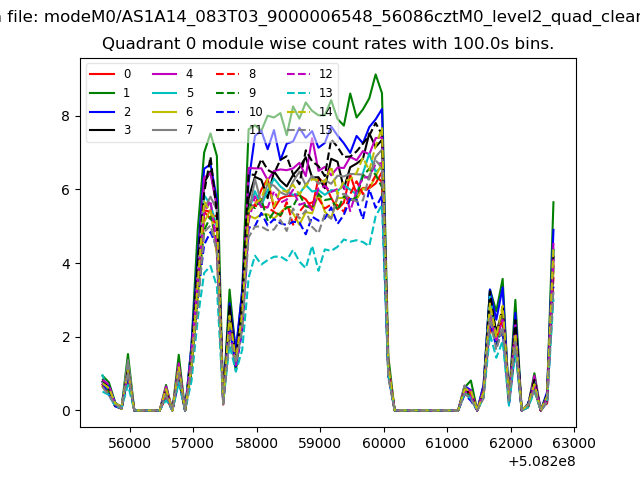 |
 |
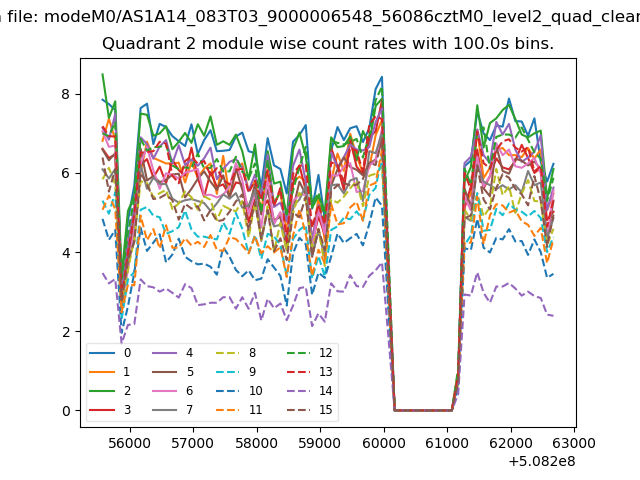
| Module-wise count rates for Quadrant B Data is divided into 100 sec bins |
 |
 |
| Module-wise count rates for Quadrant C Data is divided into 100 sec bins |
 |
 |
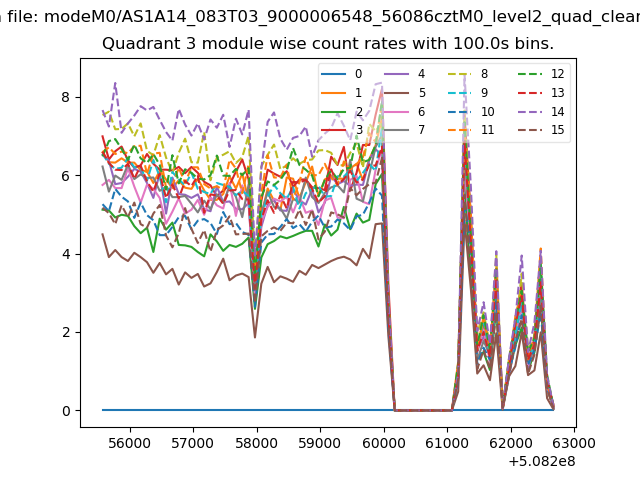
| Module-wise count rates for Quadrant D Data is divided into 100 sec bins |
 |
 |
| Parameter | Plot |
|---|---|
| CZT HV Monitor | 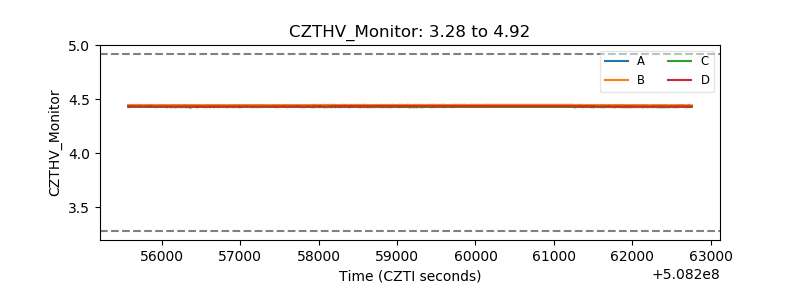 |
| D_VDD | 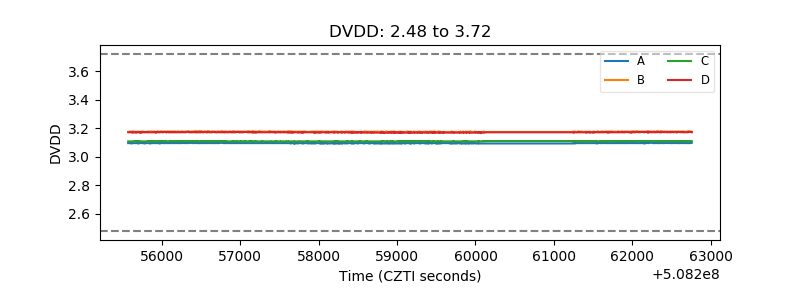 |
| Temperature 1 | 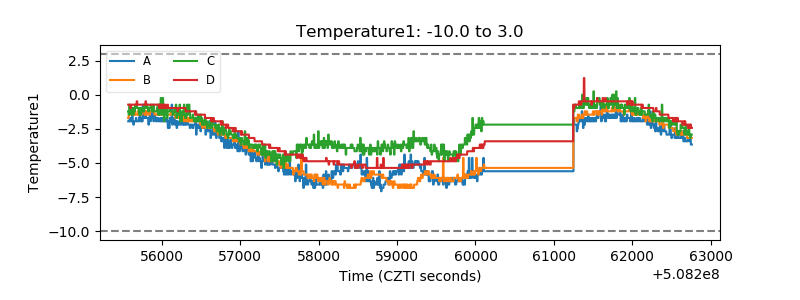 |
| Veto HV Monitor | 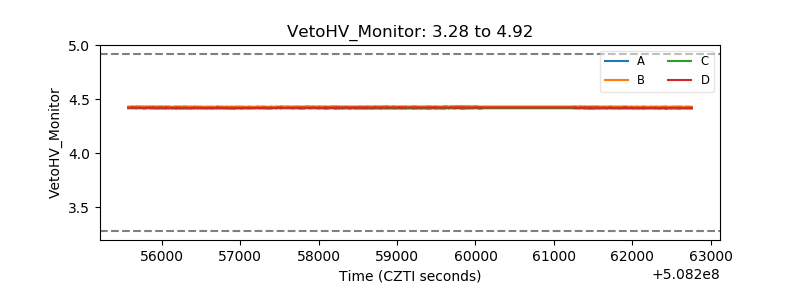 |
| Veto LLD | 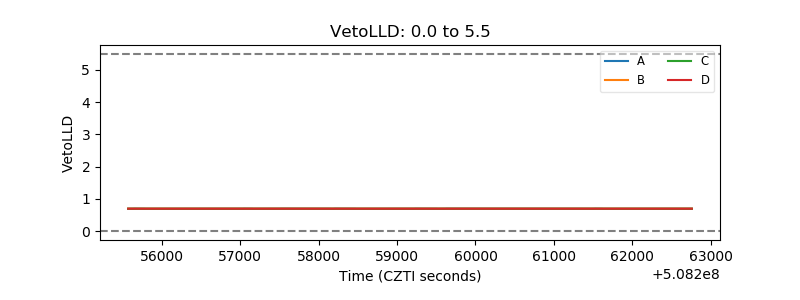 |
| Alpha Counter | 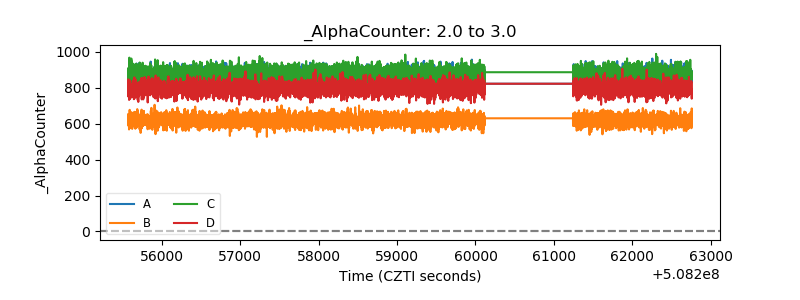 |
| _CPM_Rate | 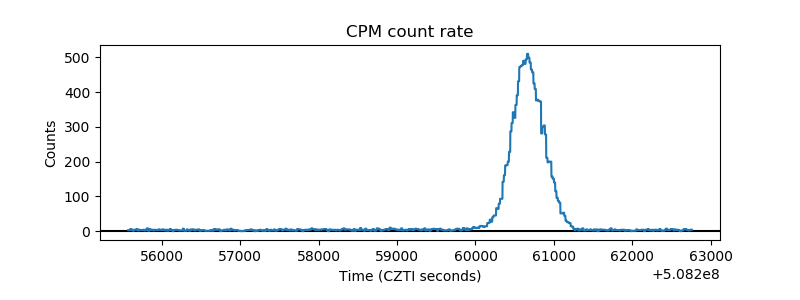 |
| CZT Counter | 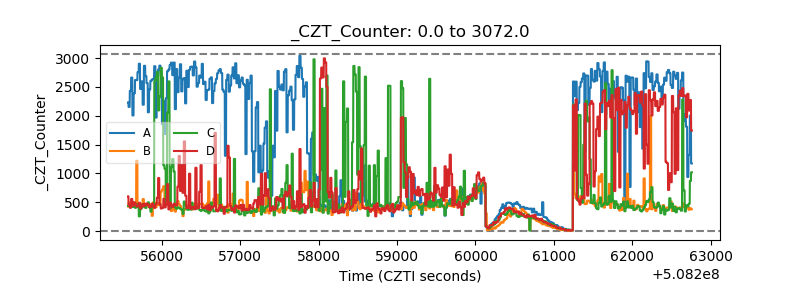 |
| +2.5 Volts monitor |  |
| +5 Volts monitor |  |
| _ROLL_ROT | 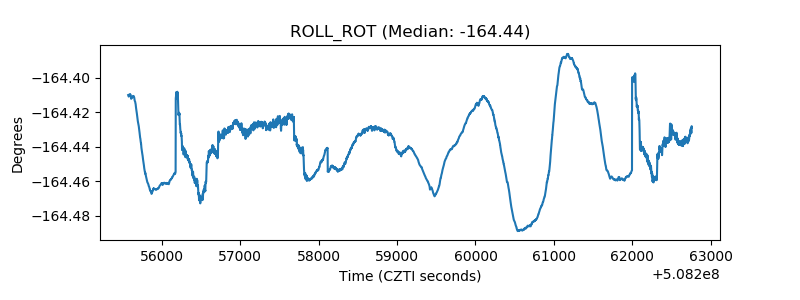 |
| _Roll_DEC | 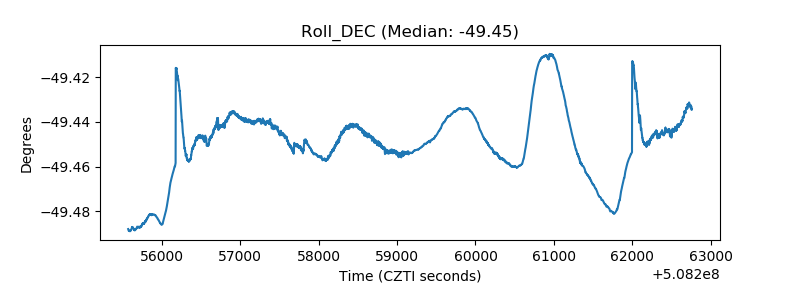 |
| _Roll_RA | 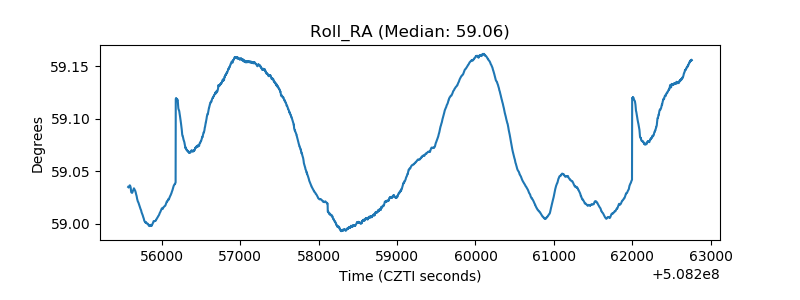 |
| Veto Counter | 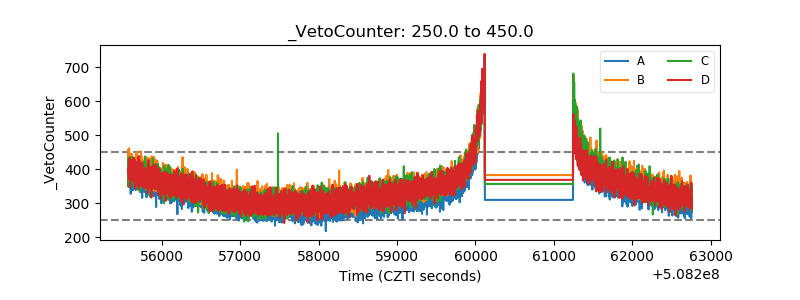 |