| Param | Original file | Final file |
|---|---|---|
| Filename | modeM0/AS1A14_083T03_9000006548_56089cztM0_level2.fits | modeM0/AS1A14_083T03_9000006548_56089cztM0_level2_quad_clean.evt |
| Size (bytes) | 615,170,880 | 100,532,160 |
| Size | 586.7 MB | 95.9 MB |
| Events in quadrant A | 5,350,600 | 651,489 |
| Events in quadrant B | 3,967,932 | 721,975 |
| Events in quadrant C | 6,247,340 | 586,603 |
| Events in quadrant D | 6,633,185 | 569,553 |
| Mode M0 | |||
|---|---|---|---|
| Quadrant | BADHDUFLAG | Total packets | Discarded packets |
| A | 0 | 21166 | 1 |
| B | 0 | 16894 | 1 |
| C | 0 | 23743 | 1 |
| D | 0 | 24943 | 1 |
| Mode SS | |||
|---|---|---|---|
| Quadrant | BADHDUFLAG | Total packets | Discarded packets |
| A | 0 | 150 | 0 |
| B | 0 | 150 | 0 |
| C | 0 | 150 | 0 |
| D | 0 | 150 | 0 |
| Mode M9 | |||
|---|---|---|---|
| Quadrant | BADHDUFLAG | Total packets | Discarded packets |
| A | 0 | 1 | 0 |
| B | 0 | 1 | 0 |
| C | 0 | 1 | 0 |
| D | 0 | 1 | 0 |
| Quadrant | Total seconds | Saturated seconds | Saturation percentage |
|---|---|---|---|
| A | 7383 | 483 | 6.542056% |
| B | 7384 | 197 | 2.667931% |
| C | 7384 | 839 | 11.362405% |
| D | 7384 | 623 | 8.437161% |
Noise dominated data is calculated using 1-second bins in cleaned event files. If a bin has >2000 counts, and if more than 50% of those come from <1% of pixels, then it is considered to be noise-dominated and hence unusable.
| Quadrant | # 1 sec bins | Bins with >0 counts | Bins with >2000 counts | High rate bins dominated by noise | Noise dominated (total time) | Noise dominated (detector-on time) | Marked lightcurve |
|---|---|---|---|---|---|---|---|
| A | 7493 | 7385 | 344 | 344 | 4.59% | 4.66% | 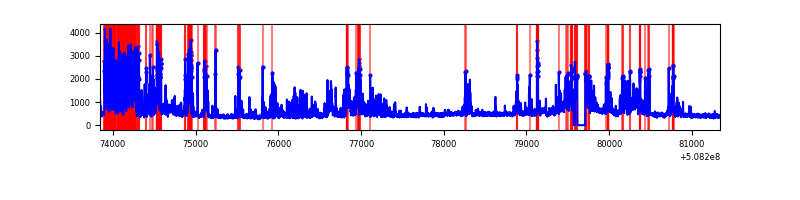 |
| B | 7494 | 7386 | 66 | 66 | 0.88% | 0.89% | 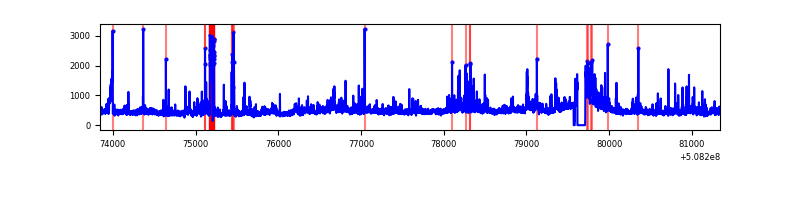 |
| C | 7494 | 7386 | 653 | 653 | 8.71% | 8.84% | 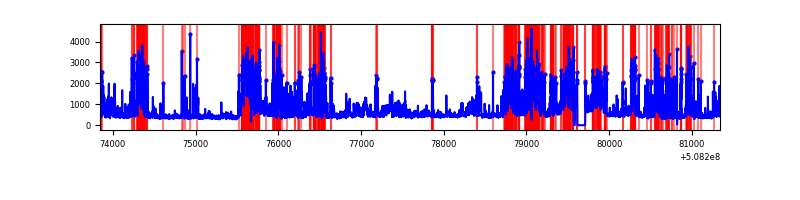 |
| D | 7494 | 7386 | 595 | 595 | 7.94% | 8.06% | 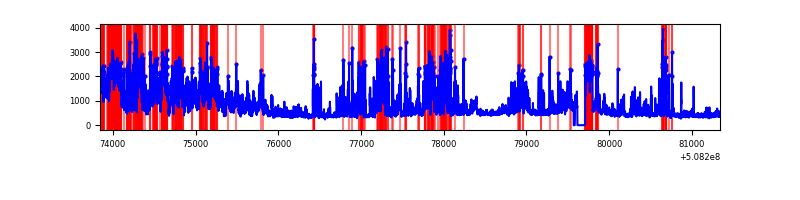 |
Top three noisy pixels from each quadrant. If the there are fewer than three noisy pixels in the level2.evt file, extra rows are filled as -1
| Pixel properties | Quadrant properties | ||||||
|---|---|---|---|---|---|---|---|
| Quadrant | DetID | PixID | Counts | Sigma | Mean | Median | Sigma |
| A | 15 | 32 | 1331404 | 7125.87 | 749 | 732 | 186.7 |
| A | 0 | 8 | 406606 | 2173.49 | 749 | 732 | 186.7 |
| A | 8 | 9 | 348567 | 1862.69 | 749 | 732 | 186.7 |
| B | 9 | 254 | 177606 | 1092.14 | 761 | 734 | 161.9 |
| B | 10 | 247 | 166424 | 1023.1 | 761 | 734 | 161.9 |
| B | 5 | 172 | 158993 | 977.21 | 761 | 734 | 161.9 |
| C | 12 | 254 | 1286092 | 6600.26 | 707 | 700 | 194.7 |
| C | 12 | 249 | 1140474 | 5852.54 | 707 | 700 | 194.7 |
| C | 9 | 38 | 362102 | 1855.74 | 707 | 700 | 194.7 |
| D | 2 | 62 | 1698081 | 8415.76 | 713 | 682 | 201.7 |
| D | 2 | 31 | 635675 | 3148.31 | 713 | 682 | 201.7 |
| D | 2 | 120 | 439962 | 2177.96 | 713 | 682 | 201.7 |
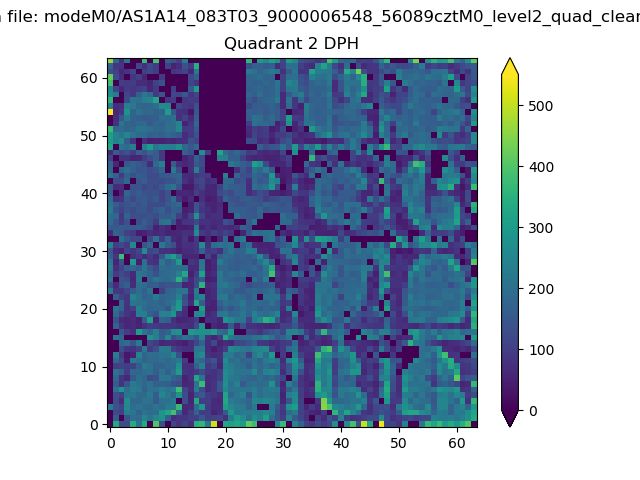
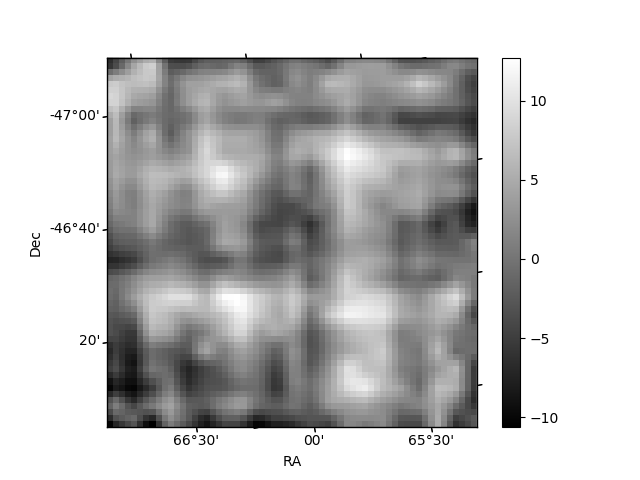
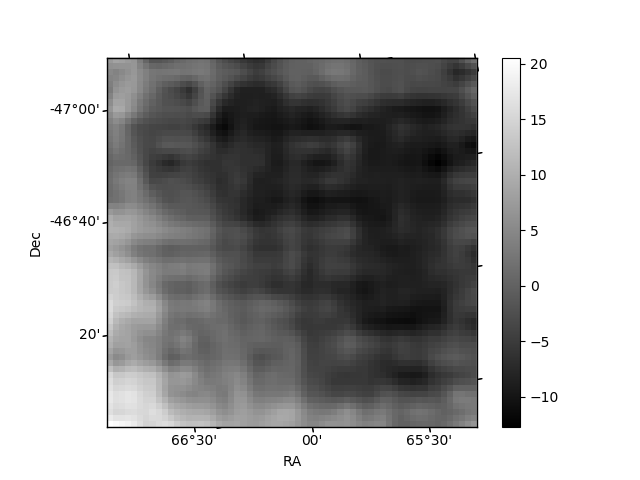
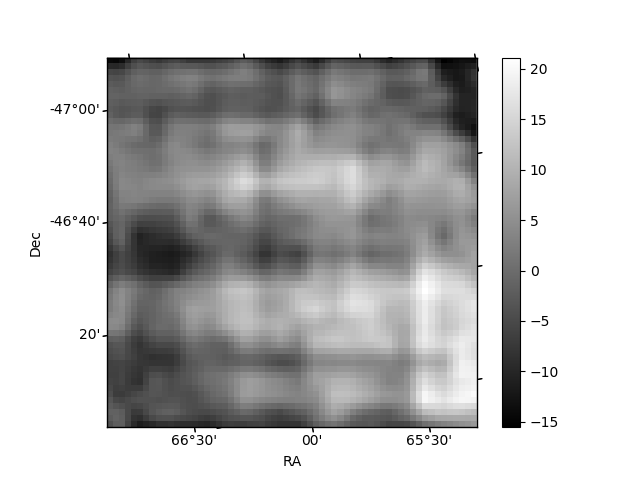
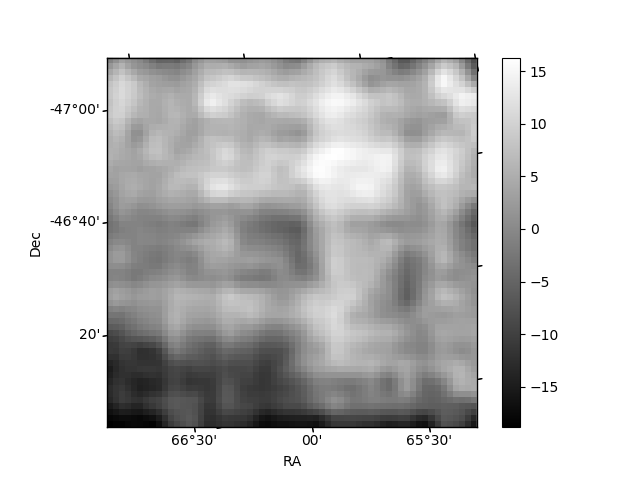
Histogram calculated using DETX and DETY for each event in the final _common_clean file
| Quadrant A | 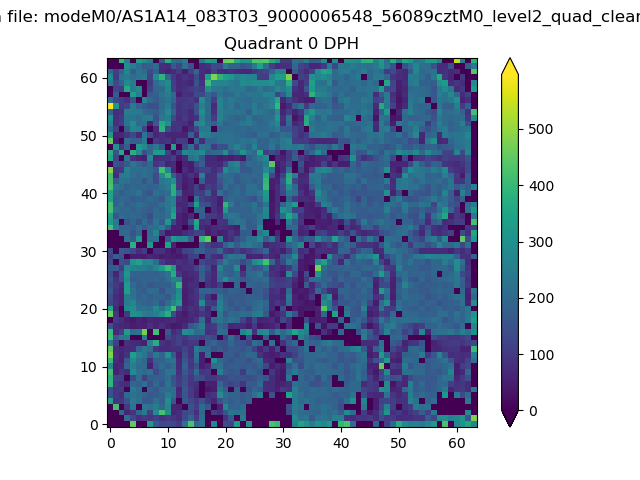 |
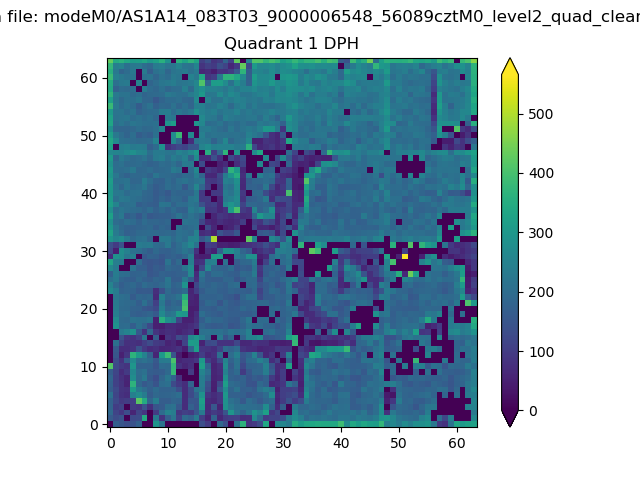 |
Quadrant B |
|---|---|---|---|
| Quadrant D | 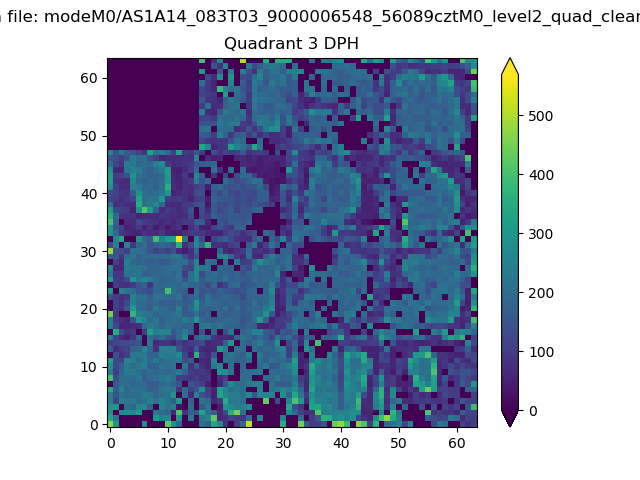 |
 |
Quadrant C |
| Plot type | Count rate plots | Images |
|---|---|---|
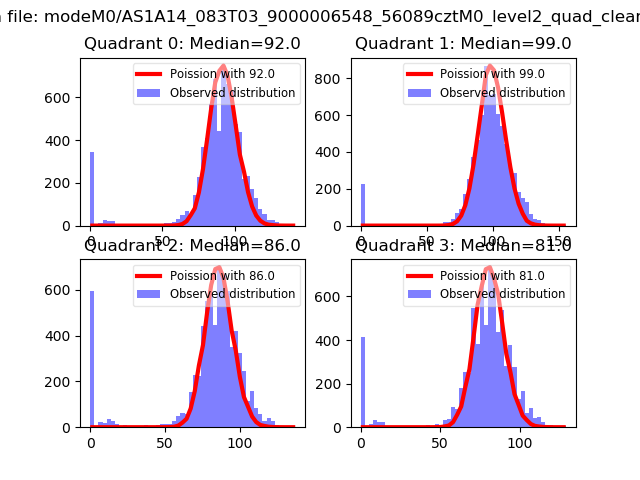
| Comparison with Poisson distribution Blue bars denote a histogram of data divided into 1 sec bins. Red curve is a Poisson curve with rate = median count rate of data. |
 |
 |
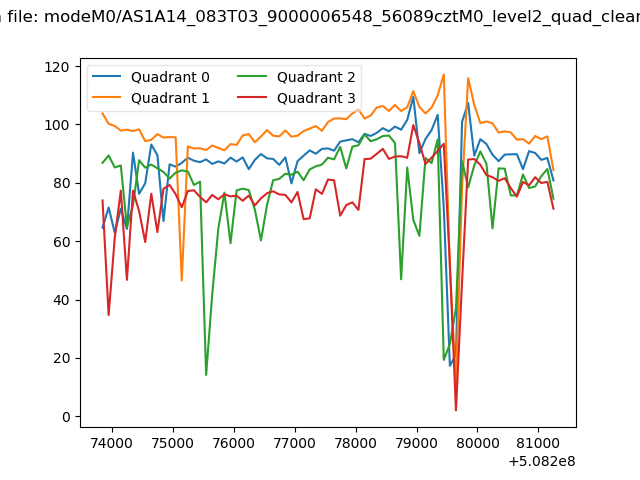
| Quadrant-wise count rates Data is divided into 100 sec bins |
 |
|
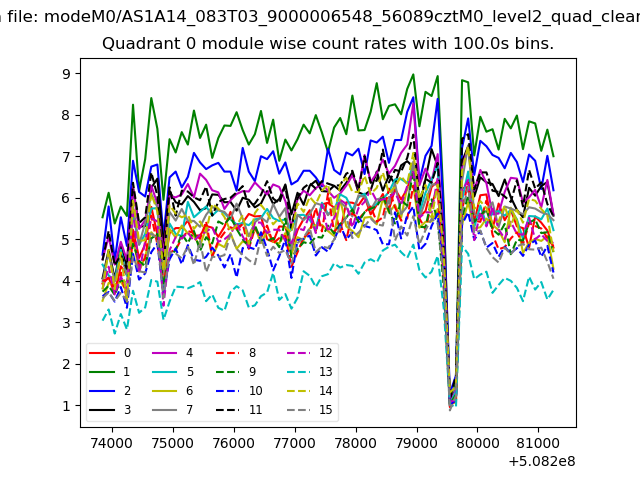
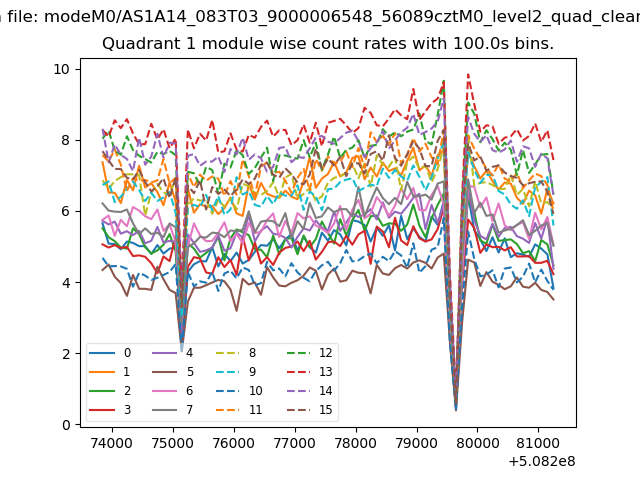
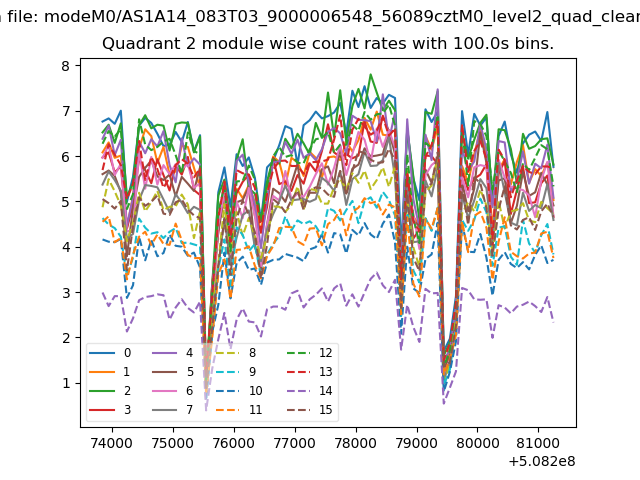
| Module-wise count rates for Quadrant A Data is divided into 100 sec bins |
 |
 |
| Module-wise count rates for Quadrant B Data is divided into 100 sec bins |
 |
 |
| Module-wise count rates for Quadrant C Data is divided into 100 sec bins |
 |
 |
| Module-wise count rates for Quadrant D Data is divided into 100 sec bins |
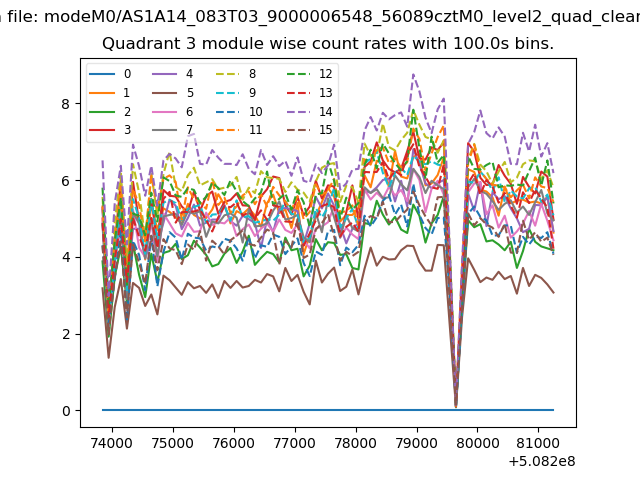 |
 |
| Parameter | Plot |
|---|---|
| CZT HV Monitor | 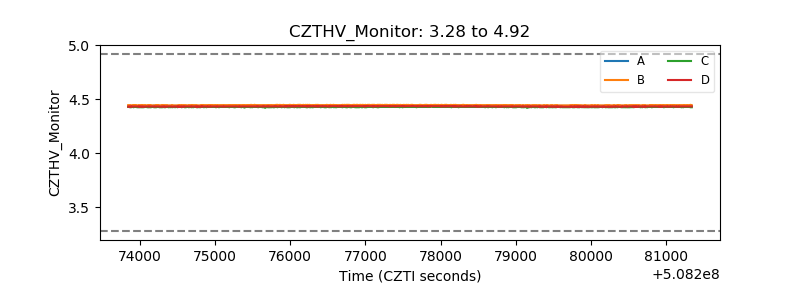 |
| D_VDD | 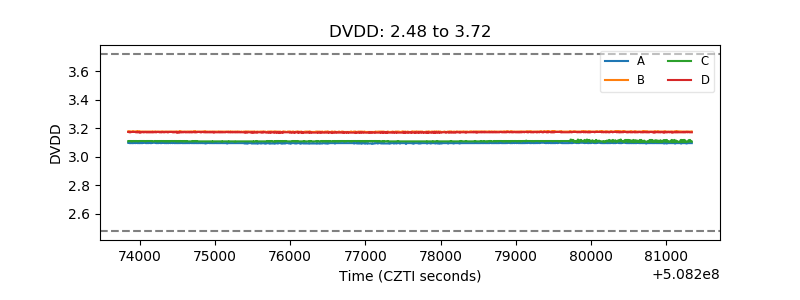 |
| Temperature 1 | 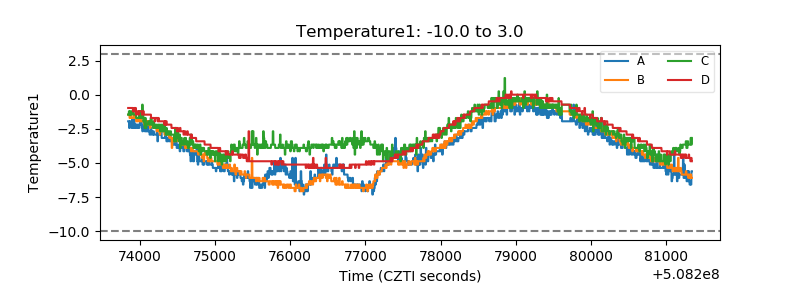 |
| Veto HV Monitor |  |
| Veto LLD | 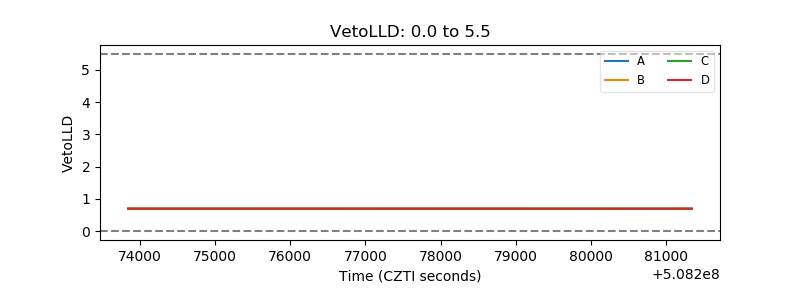 |
| Alpha Counter | 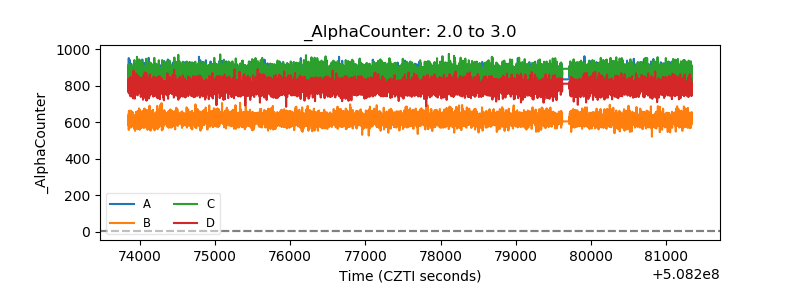 |
| _CPM_Rate | 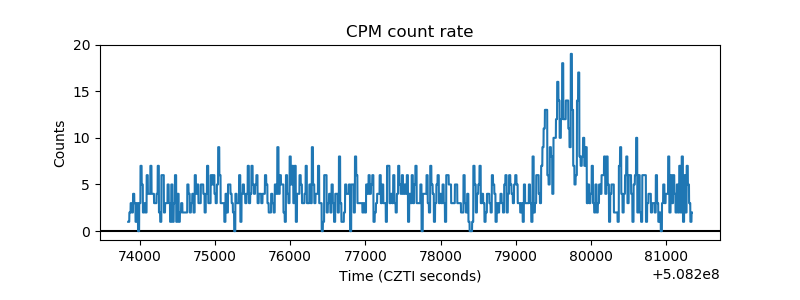 |
| CZT Counter | 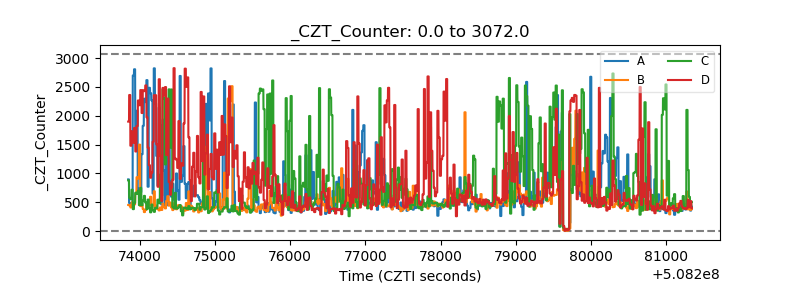 |
| +2.5 Volts monitor |  |
| +5 Volts monitor |  |
| _ROLL_ROT | 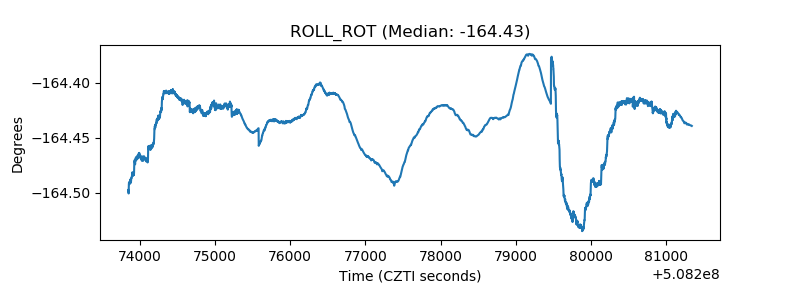 |
| _Roll_DEC | 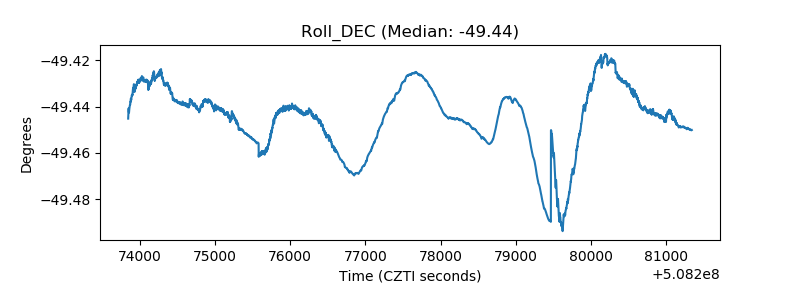 |
| _Roll_RA | 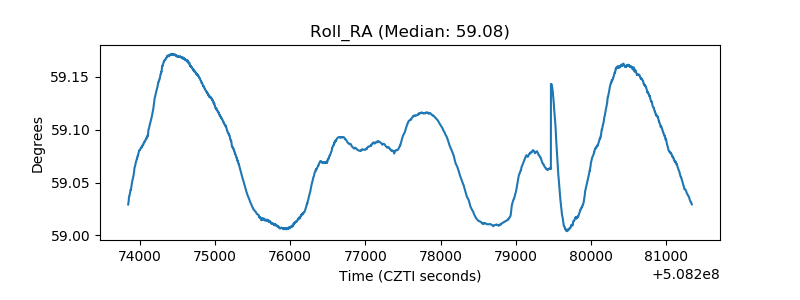 |
| Veto Counter | 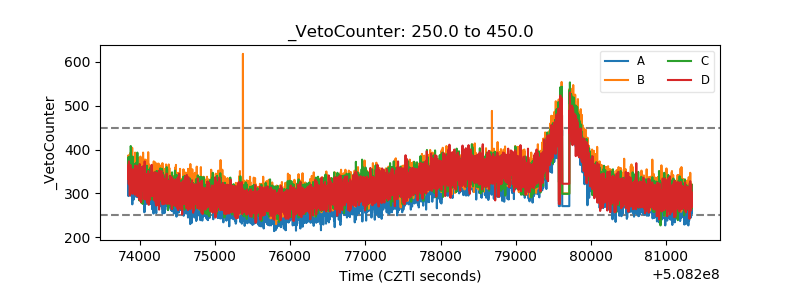 |