| Param | Original file | Final file |
|---|---|---|
| Filename | modeM0/AS1A14_083T03_9000006548_56091cztM0_level2.fits | modeM0/AS1A14_083T03_9000006548_56091cztM0_level2_quad_clean.evt |
| Size (bytes) | 697,599,360 | 111,827,520 |
| Size | 665.3 MB | 106.6 MB |
| Events in quadrant A | 6,073,483 | 712,382 |
| Events in quadrant B | 4,424,371 | 829,168 |
| Events in quadrant C | 5,947,496 | 682,139 |
| Events in quadrant D | 8,727,377 | 579,384 |
| Mode M0 | |||
|---|---|---|---|
| Quadrant | BADHDUFLAG | Total packets | Discarded packets |
| A | 0 | 24303 | 0 |
| B | 0 | 18846 | 0 |
| C | 0 | 23566 | 0 |
| D | 0 | 31929 | 0 |
| Mode SS | |||
|---|---|---|---|
| Quadrant | BADHDUFLAG | Total packets | Discarded packets |
| A | 0 | 168 | 0 |
| B | 0 | 168 | 0 |
| C | 0 | 168 | 0 |
| D | 0 | 168 | 0 |
| Quadrant | Total seconds | Saturated seconds | Saturation percentage |
|---|---|---|---|
| A | 8385 | 737 | 8.789505% |
| B | 8385 | 47 | 0.560525% |
| C | 8385 | 643 | 7.668456% |
| D | 8385 | 1475 | 17.590936% |
Noise dominated data is calculated using 1-second bins in cleaned event files. If a bin has >2000 counts, and if more than 50% of those come from <1% of pixels, then it is considered to be noise-dominated and hence unusable.
| Quadrant | # 1 sec bins | Bins with >0 counts | Bins with >2000 counts | High rate bins dominated by noise | Noise dominated (total time) | Noise dominated (detector-on time) | Marked lightcurve |
|---|---|---|---|---|---|---|---|
| A | 8385 | 8385 | 616 | 616 | 7.35% | 7.35% | 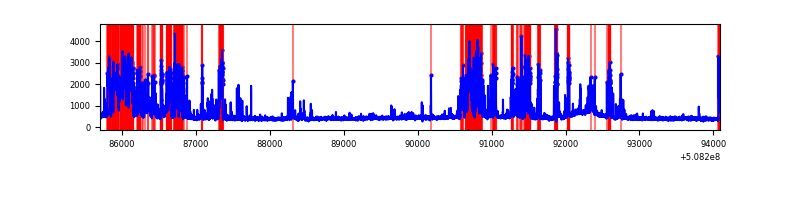 |
| B | 8385 | 8385 | 13 | 13 | 0.16% | 0.16% | 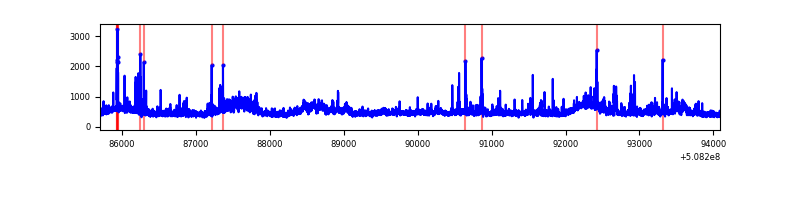 |
| C | 8385 | 8384 | 438 | 438 | 5.22% | 5.22% | 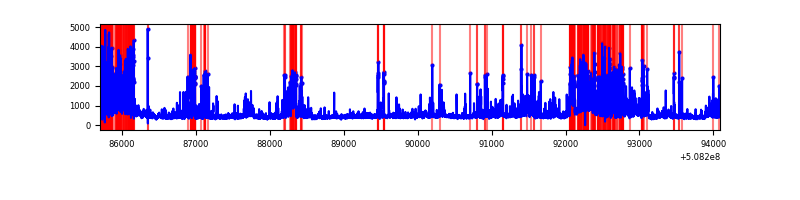 |
| D | 8385 | 8385 | 1390 | 1390 | 16.58% | 16.58% | 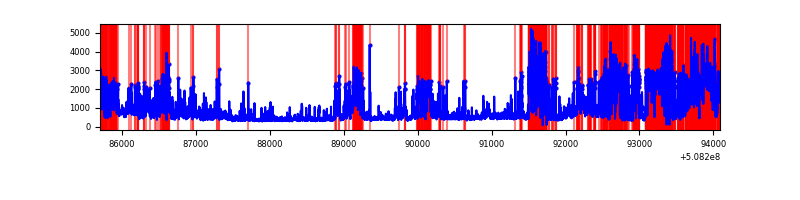 |
Top three noisy pixels from each quadrant. If the there are fewer than three noisy pixels in the level2.evt file, extra rows are filled as -1
| Pixel properties | Quadrant properties | ||||||
|---|---|---|---|---|---|---|---|
| Quadrant | DetID | PixID | Counts | Sigma | Mean | Median | Sigma |
| A | 8 | 9 | 1045469 | 4927.86 | 850 | 829 | 212.0 |
| A | 15 | 32 | 793590 | 3739.68 | 850 | 829 | 212.0 |
| A | 0 | 8 | 467005 | 2199.08 | 850 | 829 | 212.0 |
| B | 9 | 254 | 482635 | 2577.8 | 880 | 852 | 186.9 |
| B | 4 | 21 | 119975 | 637.37 | 880 | 852 | 186.9 |
| B | 7 | 252 | 72244 | 381.99 | 880 | 852 | 186.9 |
| C | 12 | 254 | 823692 | 3633.75 | 825 | 818 | 226.5 |
| C | 15 | 147 | 799491 | 3526.88 | 825 | 818 | 226.5 |
| C | 8 | 7 | 306480 | 1349.78 | 825 | 818 | 226.5 |
| D | 8 | 129 | 1942975 | 8811.54 | 781 | 746 | 220.4 |
| D | 2 | 120 | 1345444 | 6100.65 | 781 | 746 | 220.4 |
| D | 2 | 62 | 1072180 | 4860.9 | 781 | 746 | 220.4 |
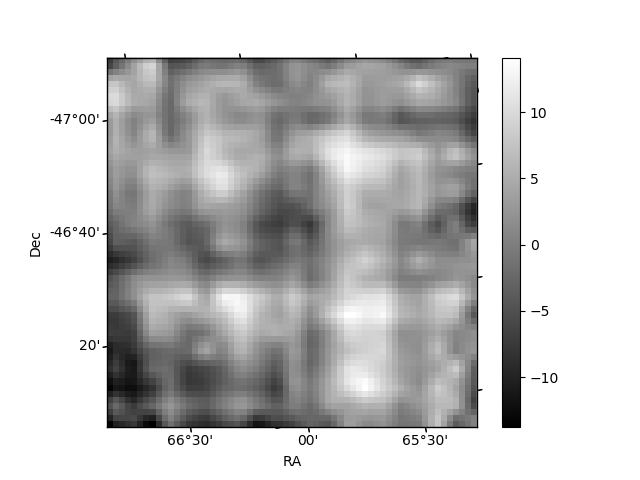
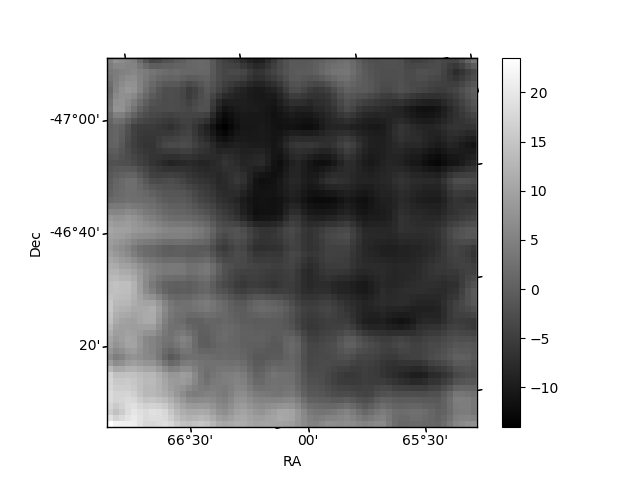
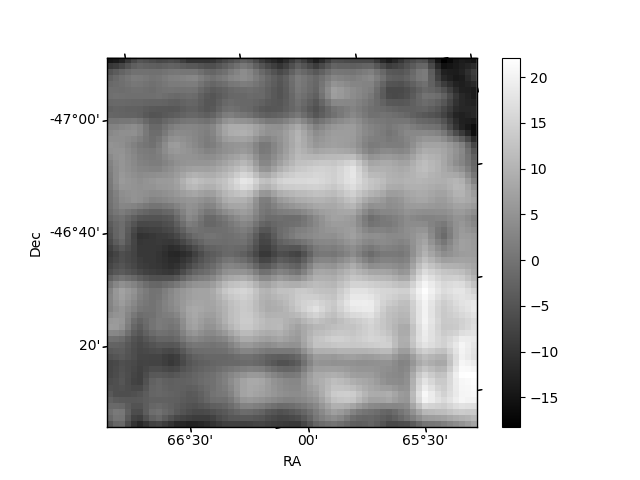
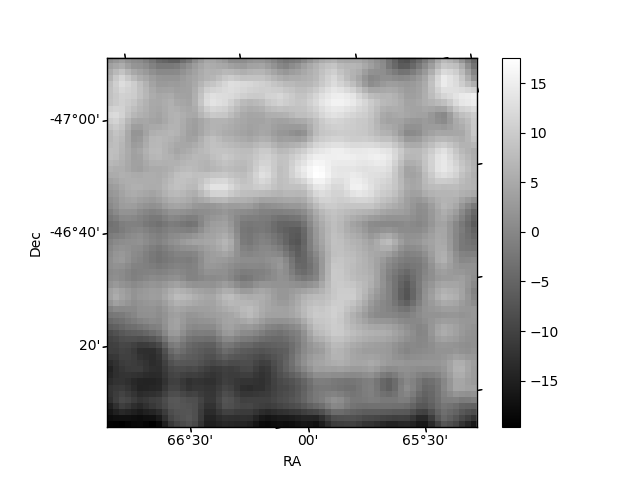
Histogram calculated using DETX and DETY for each event in the final _common_clean file
| Quadrant A | 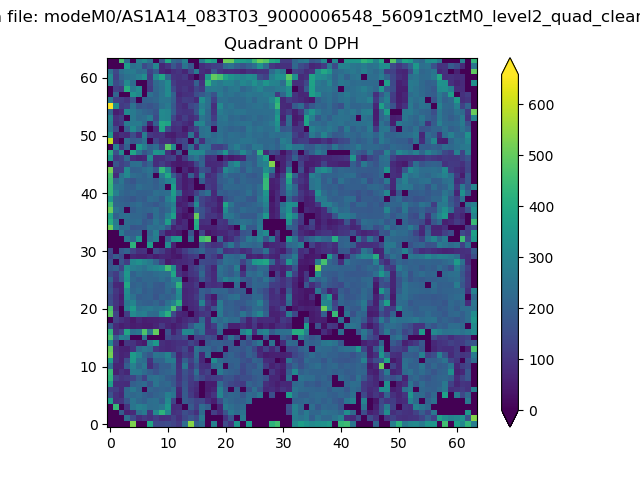 |
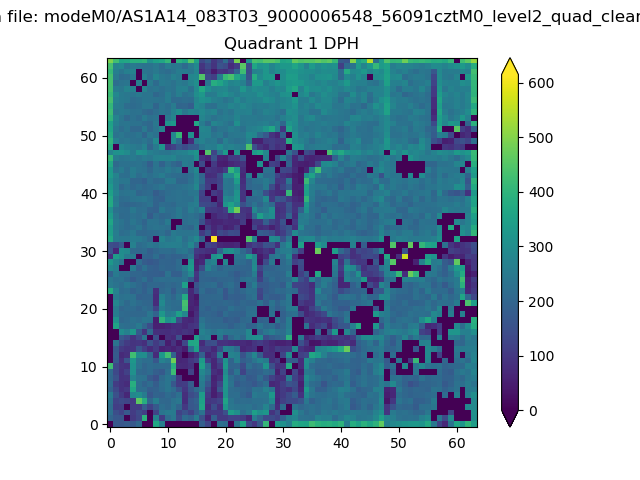 |
Quadrant B |
|---|---|---|---|
| Quadrant D | 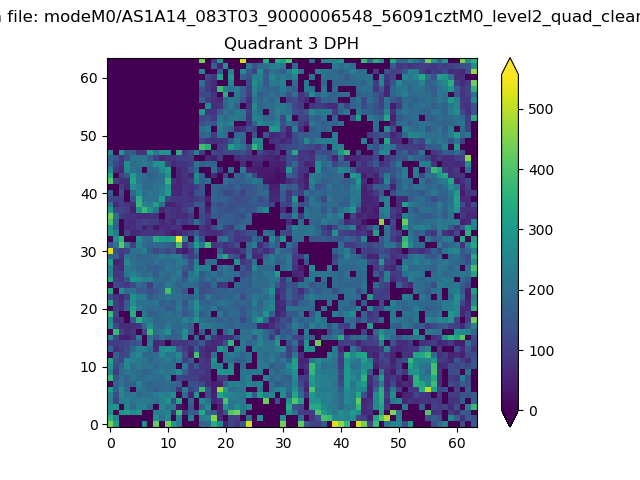 |
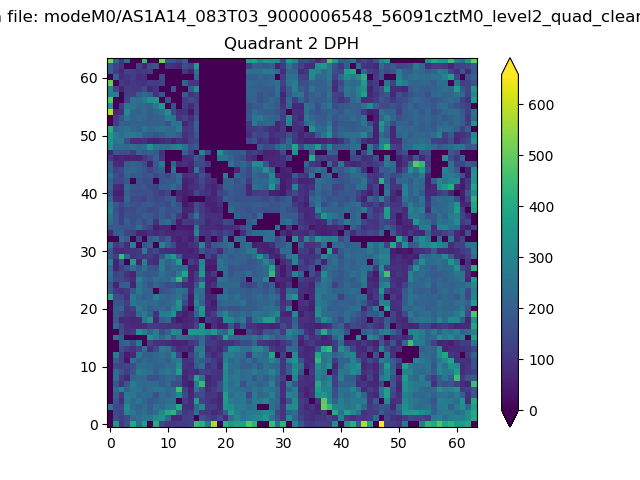 |
Quadrant C |
| Plot type | Count rate plots | Images |
|---|---|---|
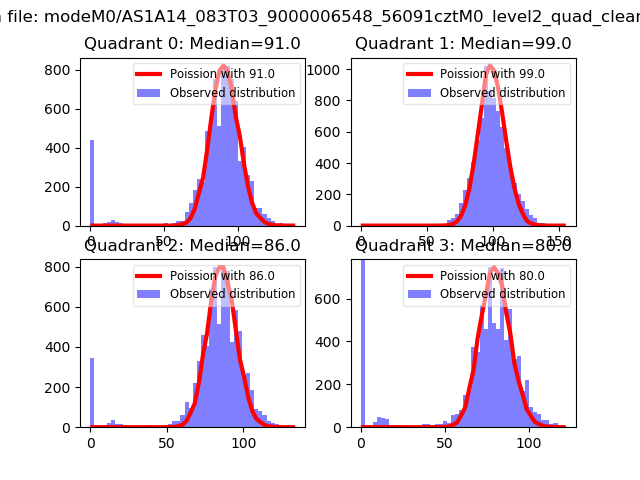
| Comparison with Poisson distribution Blue bars denote a histogram of data divided into 1 sec bins. Red curve is a Poisson curve with rate = median count rate of data. |
 |
 |
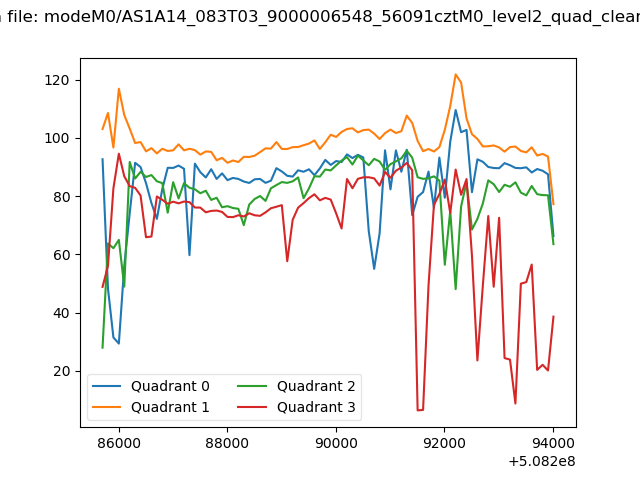
| Quadrant-wise count rates Data is divided into 100 sec bins |
 |
|
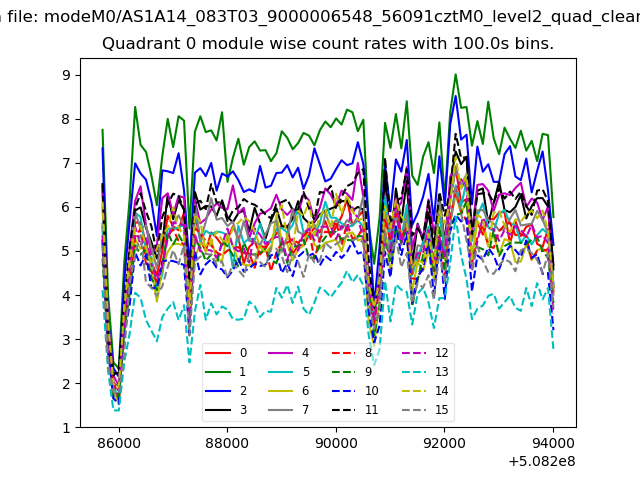
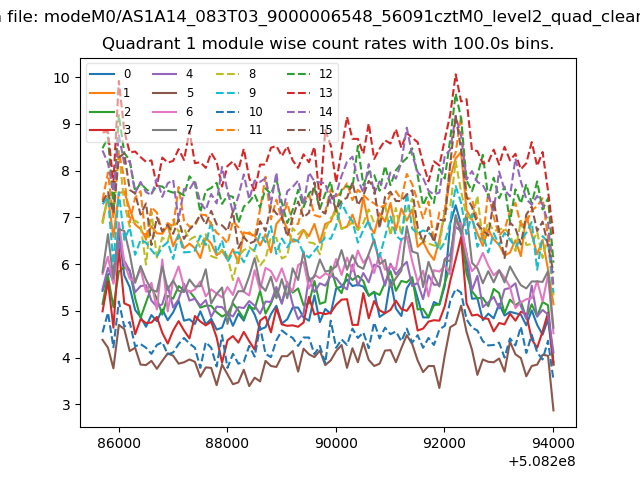
| Module-wise count rates for Quadrant A Data is divided into 100 sec bins |
 |
 |
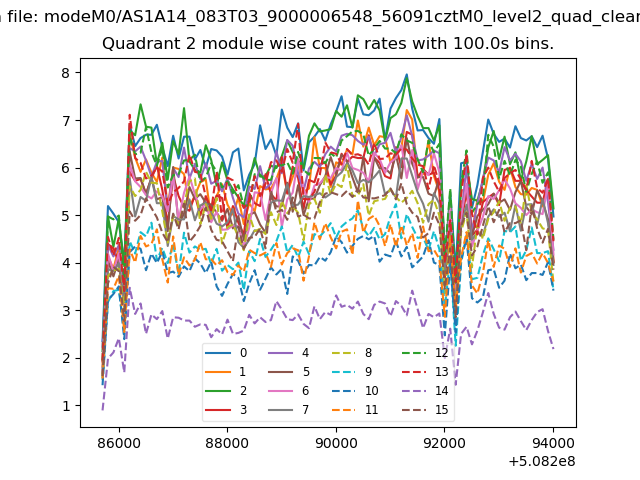
| Module-wise count rates for Quadrant B Data is divided into 100 sec bins |
 |
 |
| Module-wise count rates for Quadrant C Data is divided into 100 sec bins |
 |
 |
| Module-wise count rates for Quadrant D Data is divided into 100 sec bins |
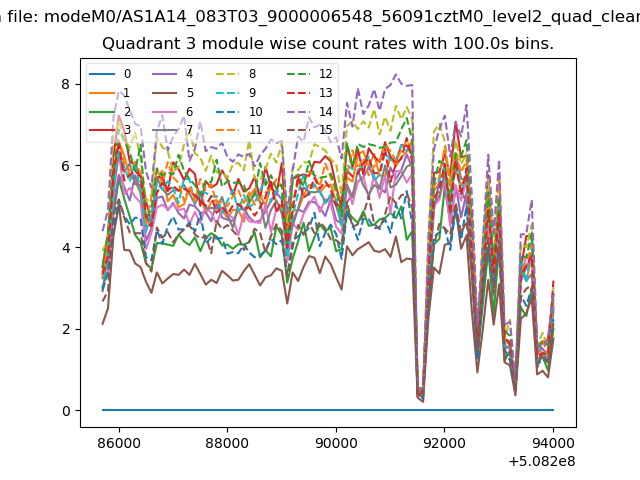 |
 |
| Parameter | Plot |
|---|---|
| CZT HV Monitor | 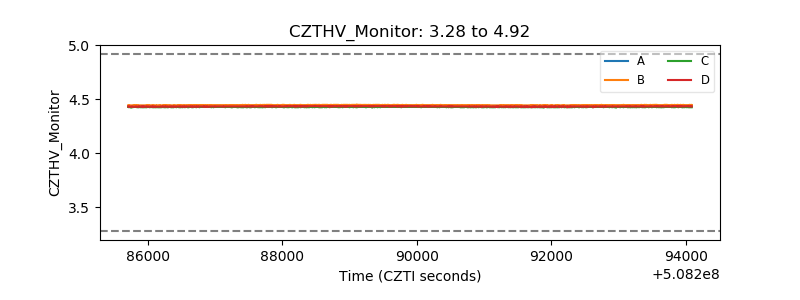 |
| D_VDD | 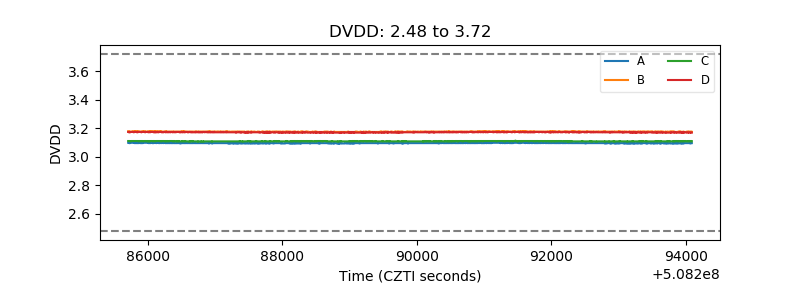 |
| Temperature 1 | 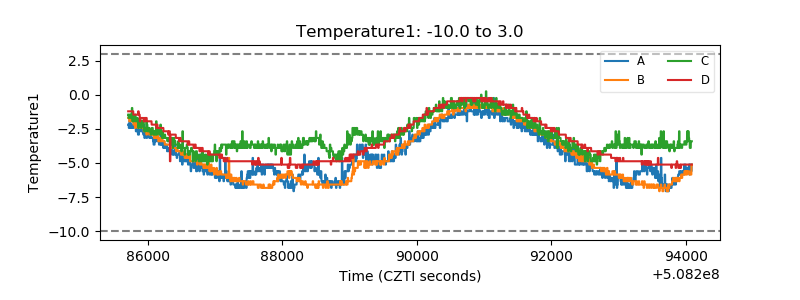 |
| Veto HV Monitor | 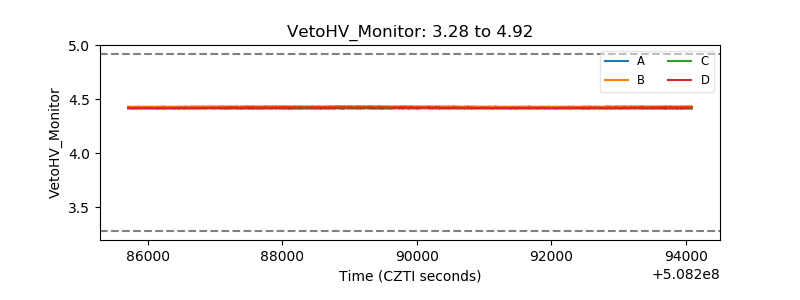 |
| Veto LLD | 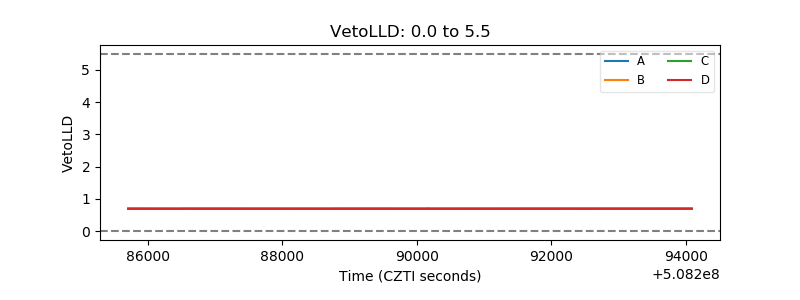 |
| Alpha Counter | 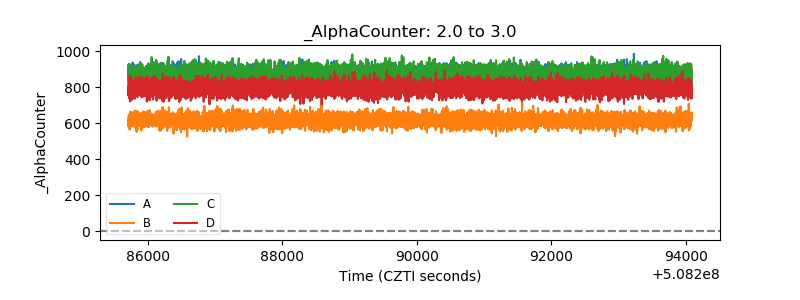 |
| _CPM_Rate | 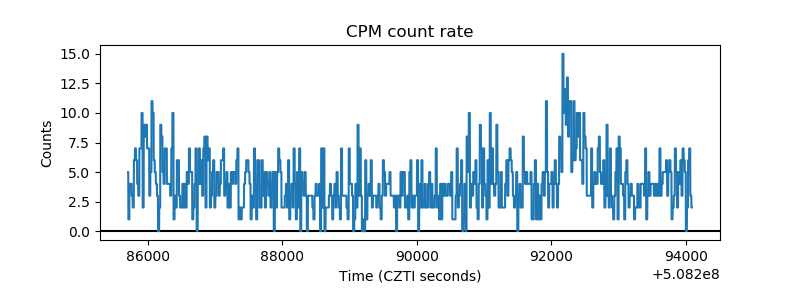 |
| CZT Counter | 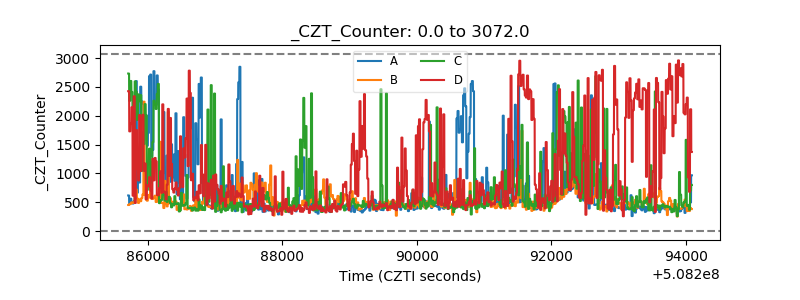 |
| +2.5 Volts monitor | 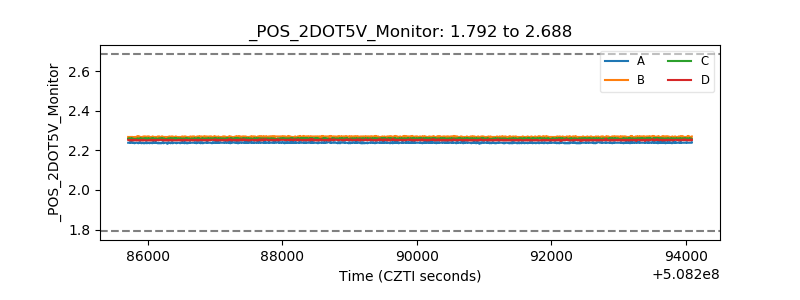 |
| +5 Volts monitor | 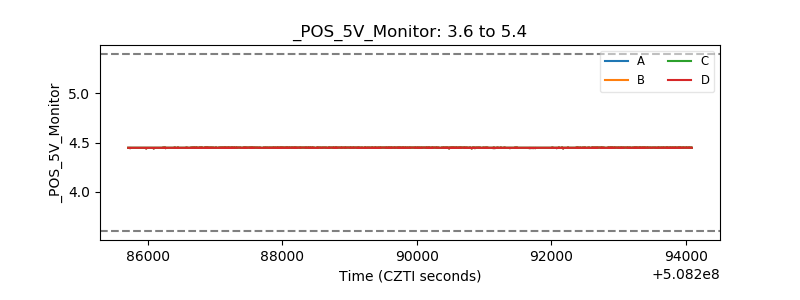 |
| _ROLL_ROT | 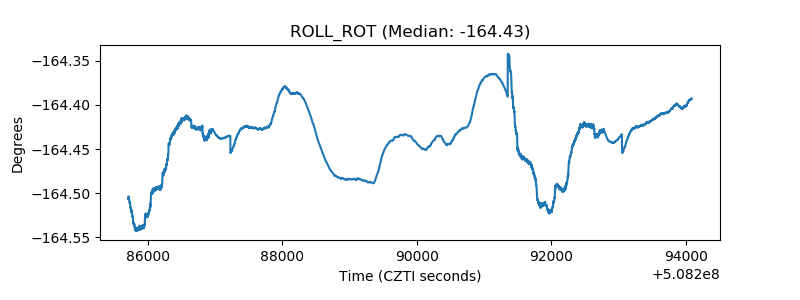 |
| _Roll_DEC | 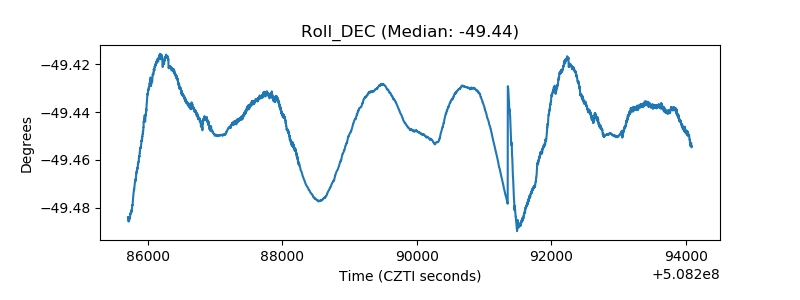 |
| _Roll_RA | 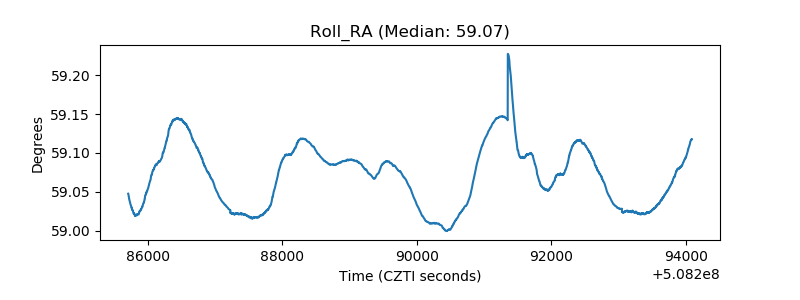 |
| Veto Counter | 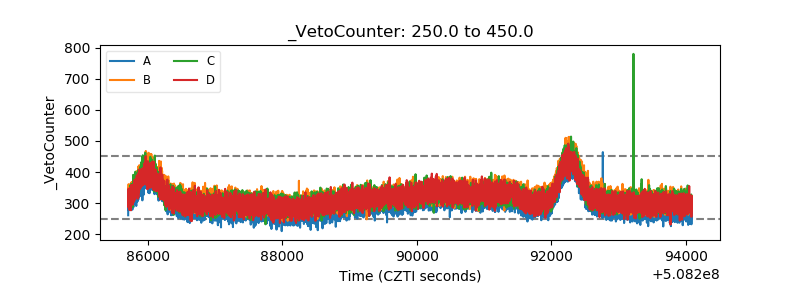 |