| Param | Original file | Final file |
|---|---|---|
| Filename | modeM0/AS1A14_083T03_9000006548_56094cztM0_level2.fits | modeM0/AS1A14_083T03_9000006548_56094cztM0_level2_quad_clean.evt |
| Size (bytes) | 1,447,801,920 | 254,433,600 |
| Size | 1.3 GB | 242.6 MB |
| Events in quadrant A | 11,572,393 | 1,675,434 |
| Events in quadrant B | 9,972,261 | 1,838,585 |
| Events in quadrant C | 12,808,626 | 1,548,313 |
| Events in quadrant D | 17,755,958 | 1,319,033 |
| Mode M0 | |||
|---|---|---|---|
| Quadrant | BADHDUFLAG | Total packets | Discarded packets |
| A | 0 | 48425 | 3 |
| B | 0 | 42568 | 3 |
| C | 0 | 51532 | 3 |
| D | 0 | 66466 | 3 |
| Mode SS | |||
|---|---|---|---|
| Quadrant | BADHDUFLAG | Total packets | Discarded packets |
| A | 0 | 388 | 0 |
| B | 0 | 388 | 0 |
| C | 0 | 388 | 0 |
| D | 0 | 388 | 0 |
| Mode M9 | |||
|---|---|---|---|
| Quadrant | BADHDUFLAG | Total packets | Discarded packets |
| A | 0 | 14 | 0 |
| B | 0 | 14 | 0 |
| C | 0 | 14 | 0 |
| D | 0 | 14 | 0 |
| Quadrant | Total seconds | Saturated seconds | Saturation percentage |
|---|---|---|---|
| A | 19183 | 845 | 4.404942% |
| B | 19184 | 377 | 1.965179% |
| C | 19184 | 1252 | 6.526272% |
| D | 19184 | 2706 | 14.105505% |
Noise dominated data is calculated using 1-second bins in cleaned event files. If a bin has >2000 counts, and if more than 50% of those come from <1% of pixels, then it is considered to be noise-dominated and hence unusable.
| Quadrant | # 1 sec bins | Bins with >0 counts | Bins with >2000 counts | High rate bins dominated by noise | Noise dominated (total time) | Noise dominated (detector-on time) | Marked lightcurve |
|---|---|---|---|---|---|---|---|
| A | 20458 | 19186 | 469 | 469 | 2.29% | 2.44% | 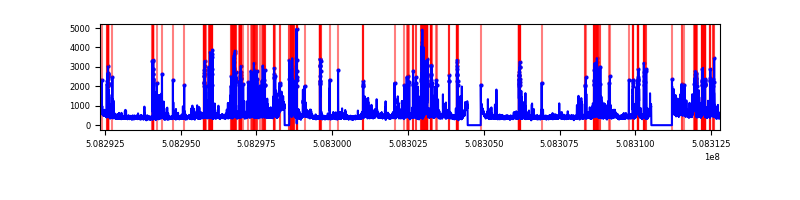 |
| B | 20459 | 19187 | 33 | 33 | 0.16% | 0.17% | 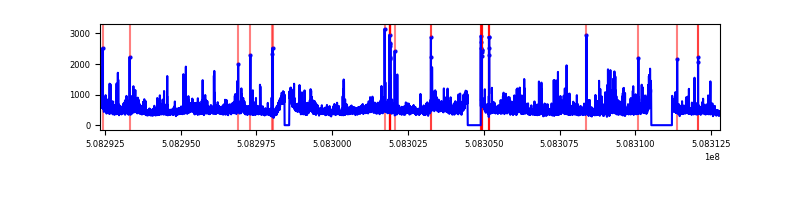 |
| C | 20459 | 19187 | 800 | 800 | 3.91% | 4.17% | 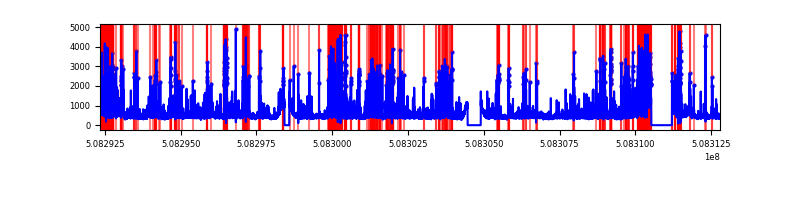 |
| D | 20459 | 19187 | 2534 | 2534 | 12.39% | 13.21% | 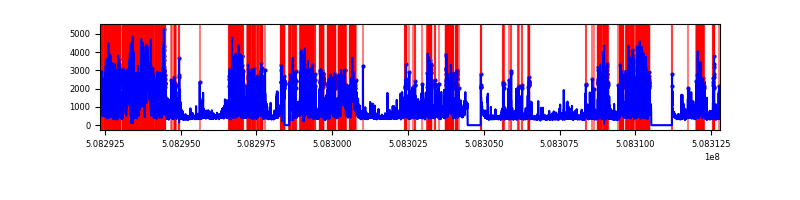 |
Top three noisy pixels from each quadrant. If the there are fewer than three noisy pixels in the level2.evt file, extra rows are filled as -1
| Pixel properties | Quadrant properties | ||||||
|---|---|---|---|---|---|---|---|
| Quadrant | DetID | PixID | Counts | Sigma | Mean | Median | Sigma |
| A | 15 | 32 | 2082157 | 4179.79 | 2008 | 1956 | 497.7 |
| A | 12 | 115 | 780674 | 1564.69 | 2008 | 1956 | 497.7 |
| A | 0 | 8 | 415773 | 831.49 | 2008 | 1956 | 497.7 |
| B | 4 | 21 | 1058624 | 2471.45 | 2012 | 1938 | 427.6 |
| B | 9 | 254 | 288621 | 670.51 | 2012 | 1938 | 427.6 |
| B | 10 | 247 | 163033 | 376.78 | 2012 | 1938 | 427.6 |
| C | 12 | 254 | 2913148 | 5548.67 | 1935 | 1915 | 524.7 |
| C | 12 | 252 | 685247 | 1302.4 | 1935 | 1915 | 524.7 |
| C | 9 | 38 | 547495 | 1039.85 | 1935 | 1915 | 524.7 |
| D | 8 | 129 | 5700343 | 10965.46 | 1859 | 1776 | 519.7 |
| D | 2 | 120 | 2592569 | 4985.33 | 1859 | 1776 | 519.7 |
| D | 6 | 42 | 556907 | 1068.21 | 1859 | 1776 | 519.7 |
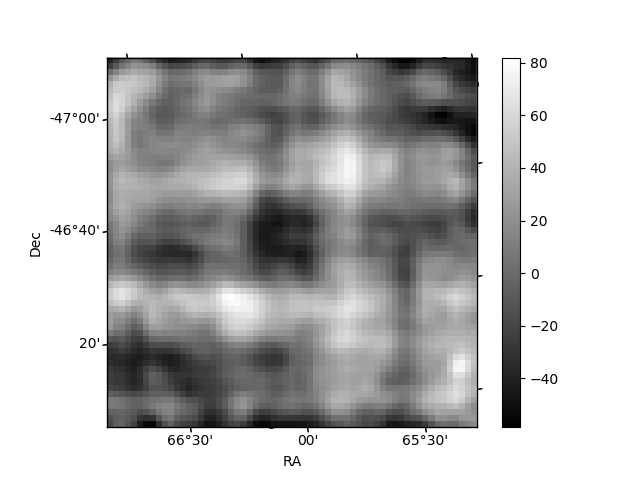
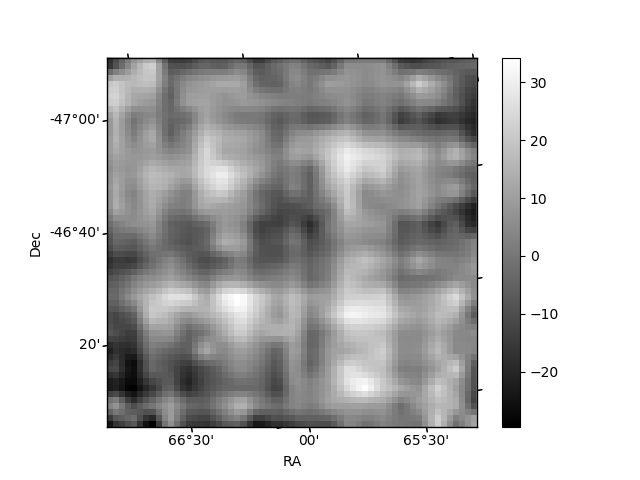
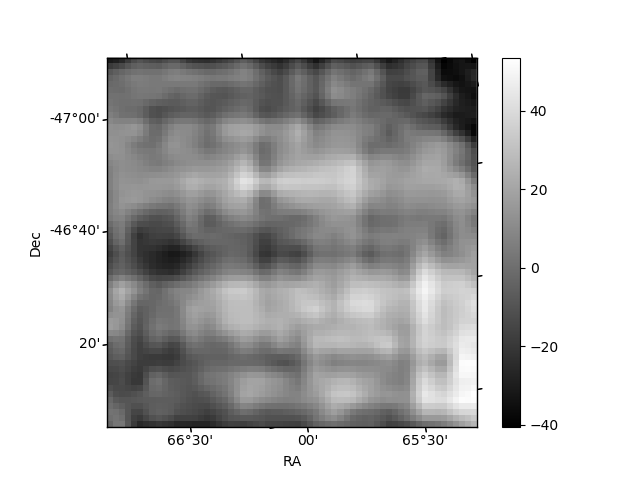
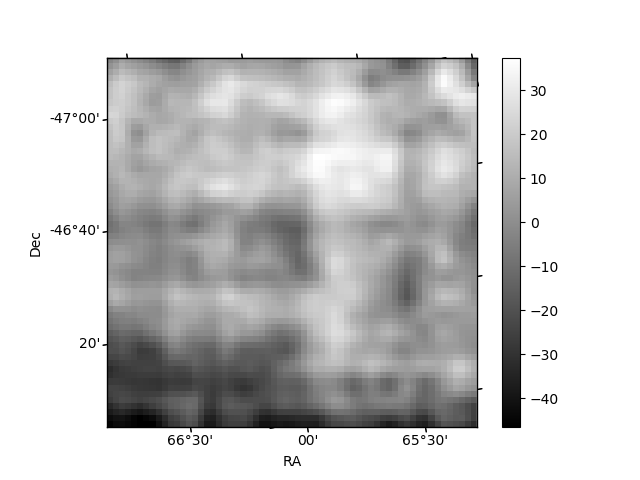
Histogram calculated using DETX and DETY for each event in the final _common_clean file
| Quadrant A | 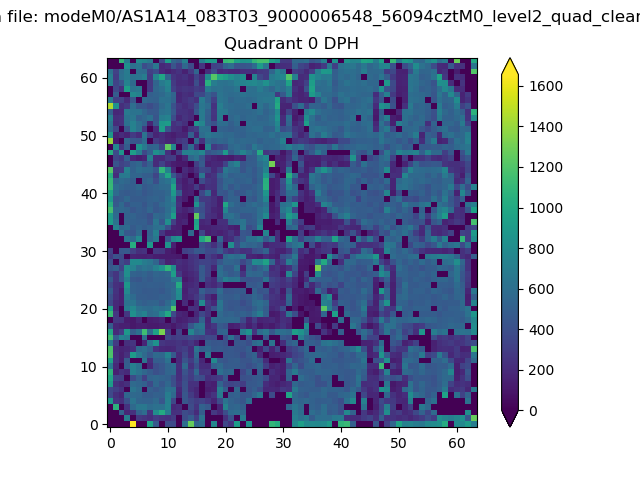 |
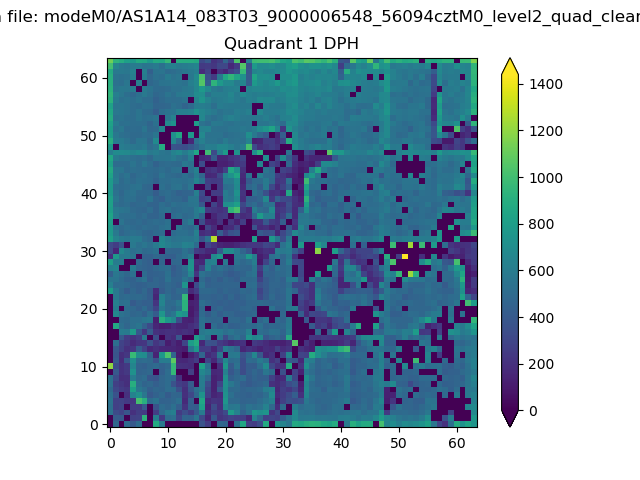 |
Quadrant B |
|---|---|---|---|
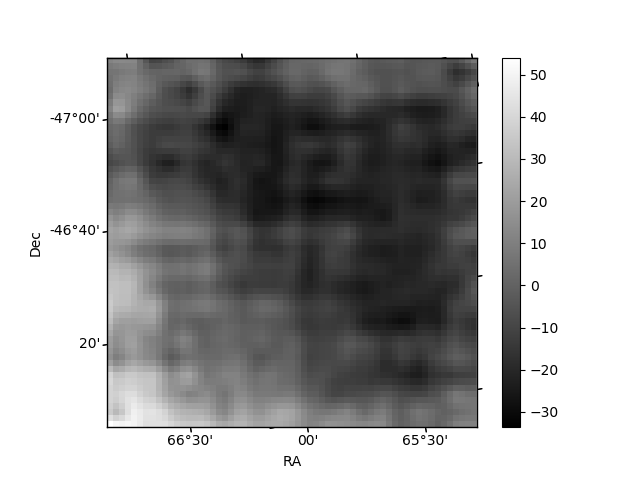
| Quadrant D | 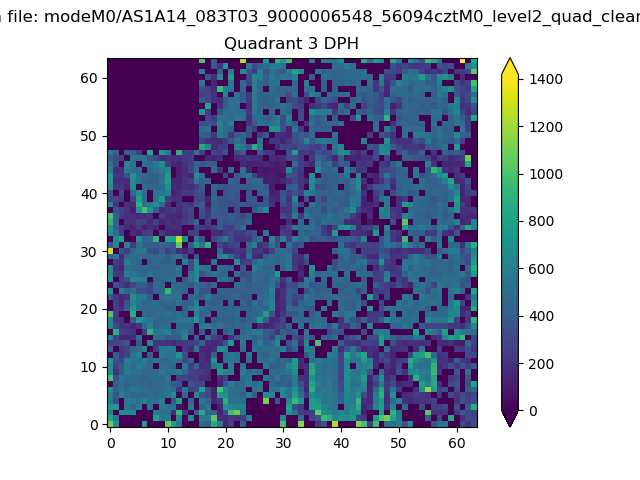 |
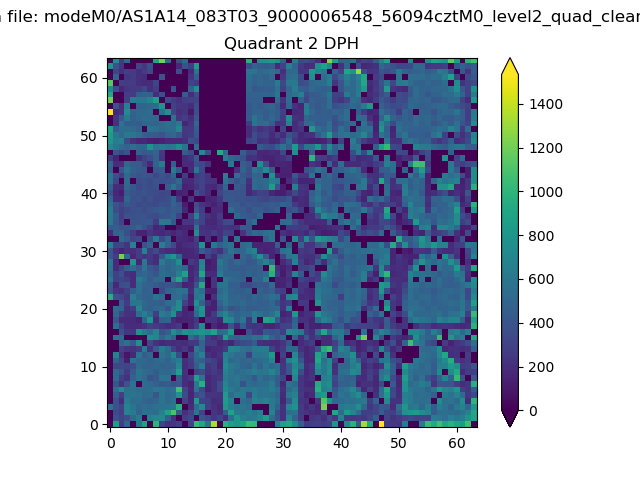 |
Quadrant C |
| Plot type | Count rate plots | Images |
|---|---|---|
| Comparison with Poisson distribution Blue bars denote a histogram of data divided into 1 sec bins. Red curve is a Poisson curve with rate = median count rate of data. |
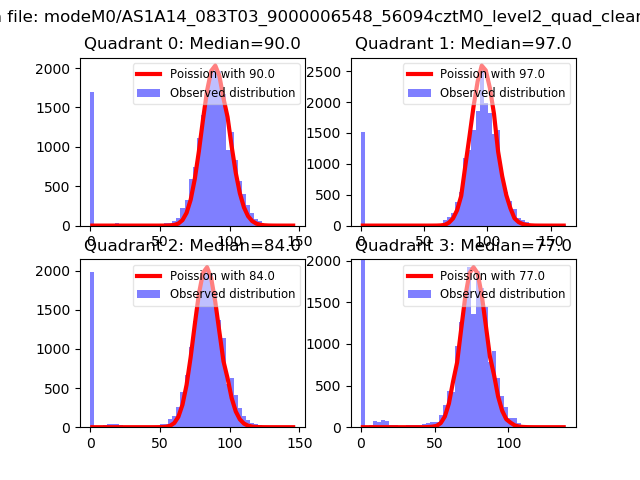 |
 |
| Quadrant-wise count rates Data is divided into 100 sec bins |
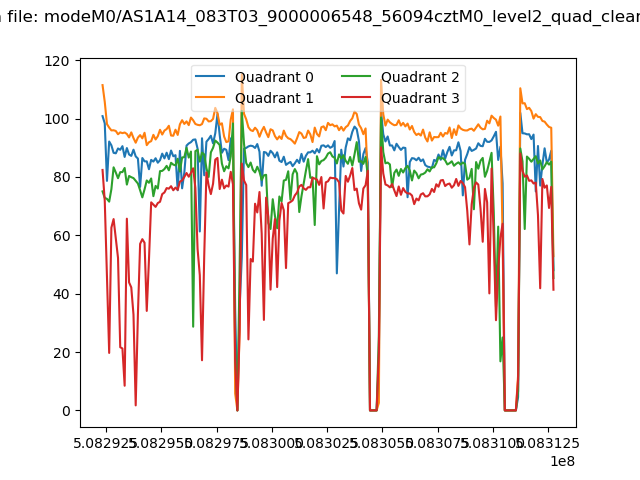 |
|
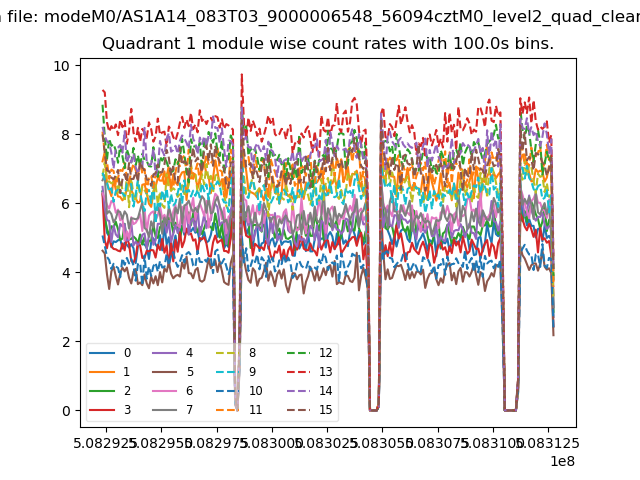
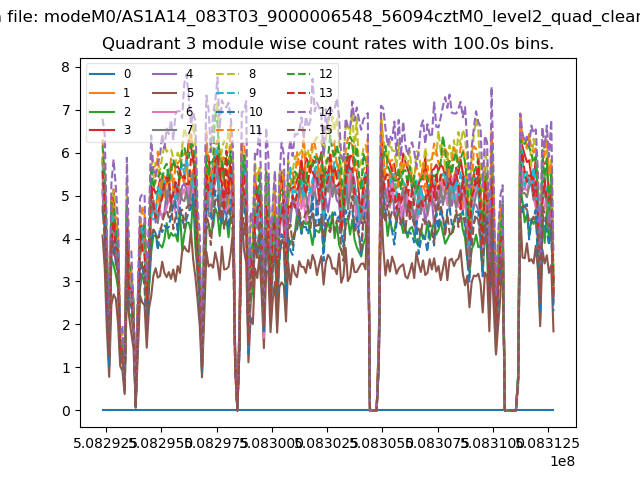
| Module-wise count rates for Quadrant A Data is divided into 100 sec bins |
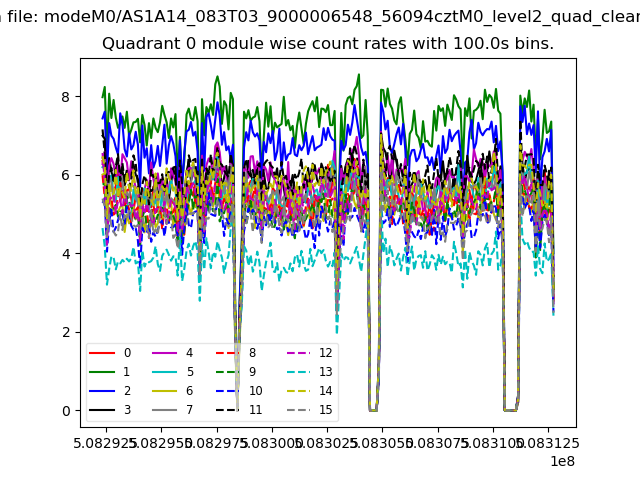 |
 |
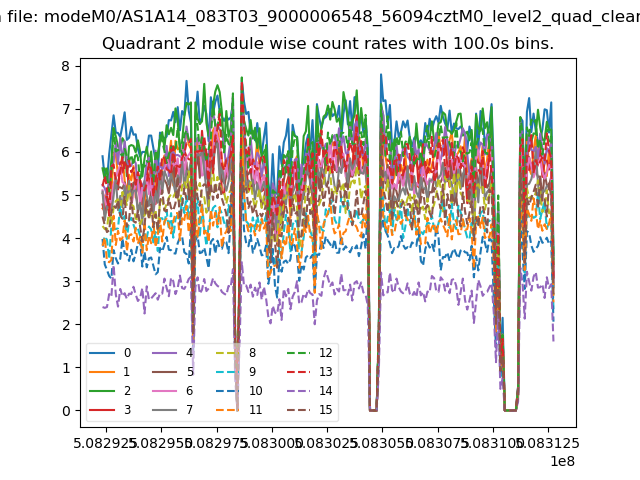
| Module-wise count rates for Quadrant B Data is divided into 100 sec bins |
 |
 |
| Module-wise count rates for Quadrant C Data is divided into 100 sec bins |
 |
 |
| Module-wise count rates for Quadrant D Data is divided into 100 sec bins |
 |
 |
| Parameter | Plot |
|---|---|
| CZT HV Monitor | 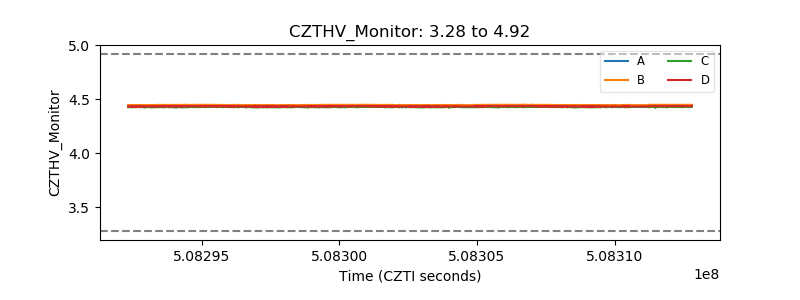 |
| D_VDD | 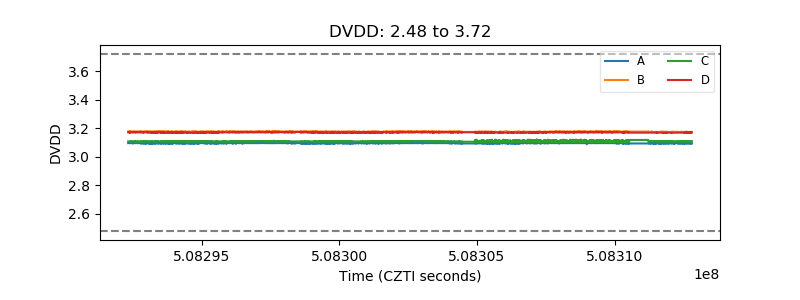 |
| Temperature 1 | 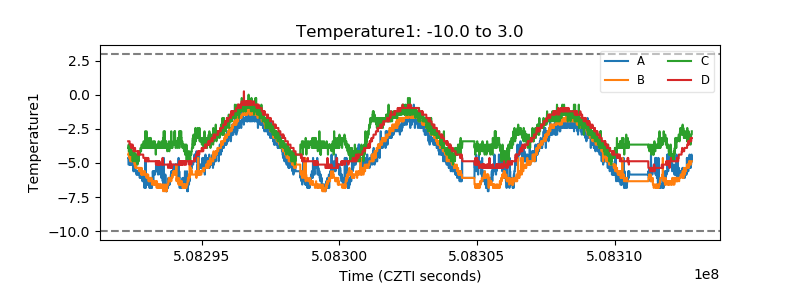 |
| Veto HV Monitor | 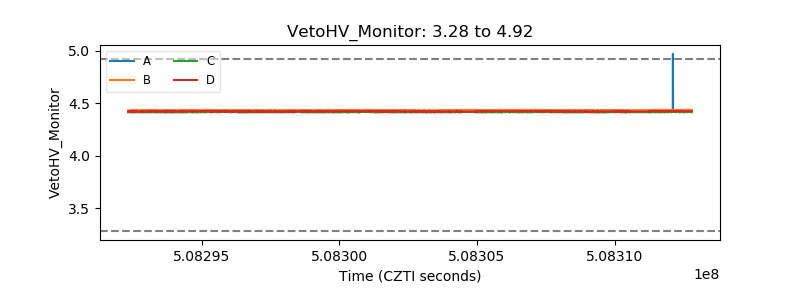 |
| Veto LLD | 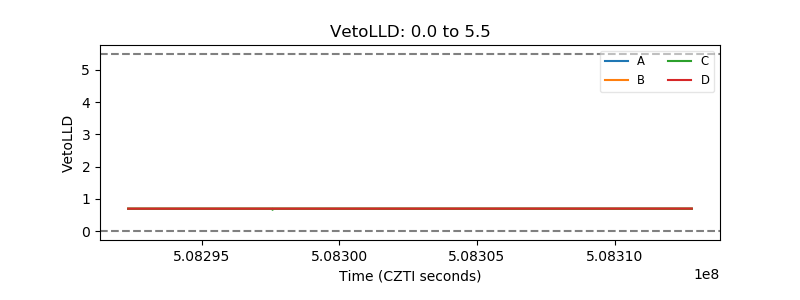 |
| Alpha Counter | 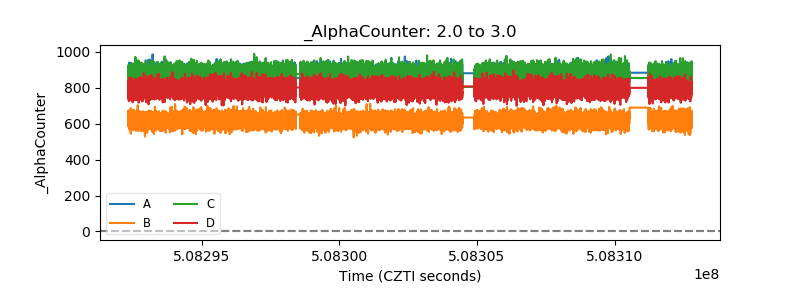 |
| _CPM_Rate | 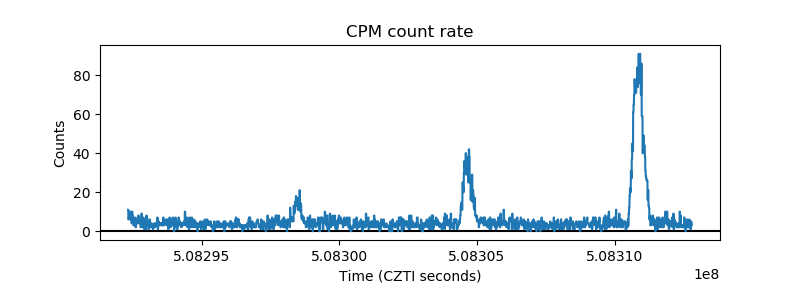 |
| CZT Counter | 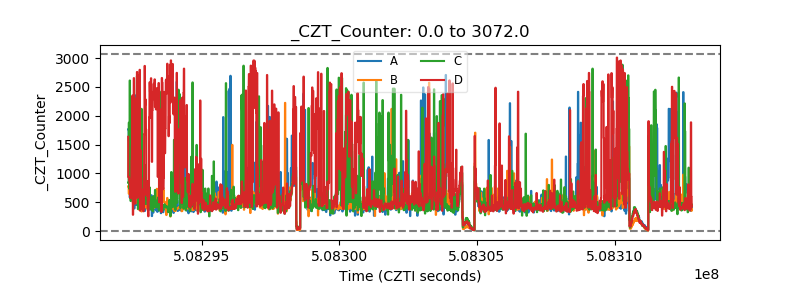 |
| +2.5 Volts monitor | 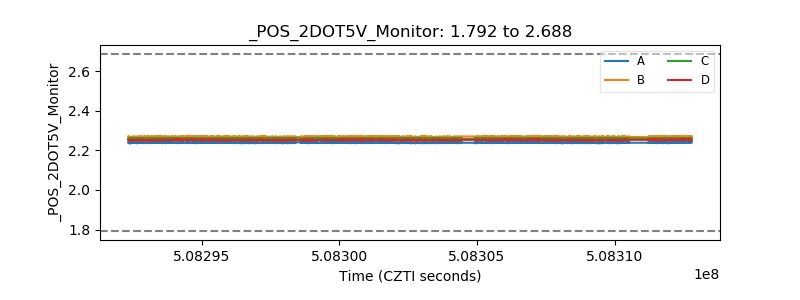 |
| +5 Volts monitor | 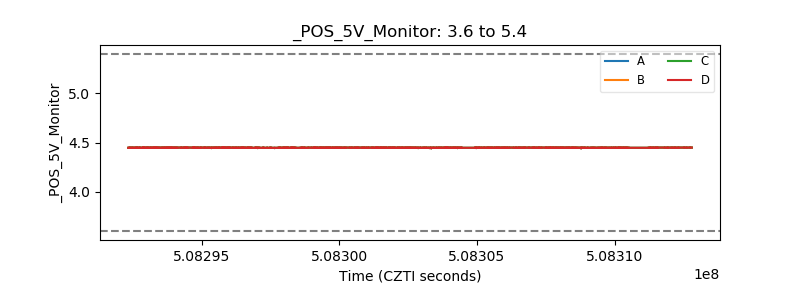 |
| _ROLL_ROT | 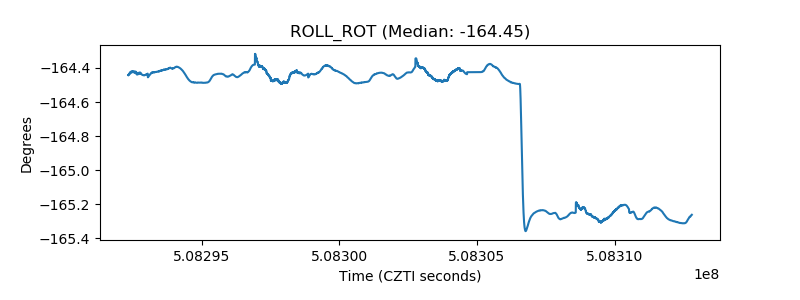 |
| _Roll_DEC | 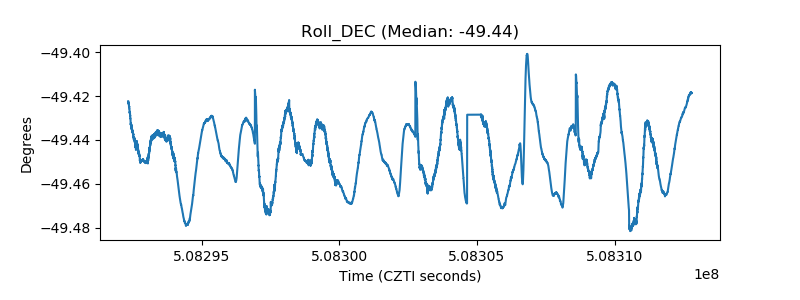 |
| _Roll_RA | 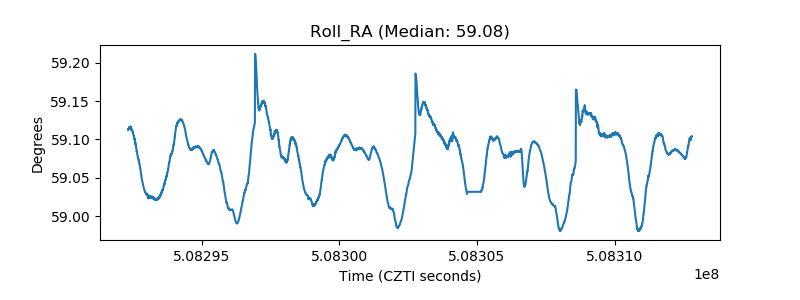 |
| Veto Counter | 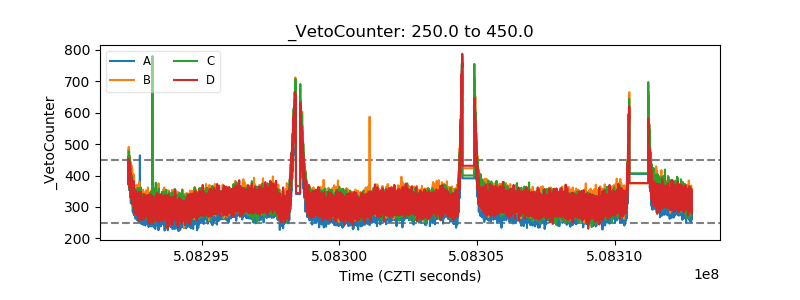 |