| Param | Original file | Final file |
|---|---|---|
| Filename | modeM0/AS1A14_083T03_9000006548_56095cztM0_level2.fits | modeM0/AS1A14_083T03_9000006548_56095cztM0_level2_quad_clean.evt |
| Size (bytes) | 652,343,040 | 97,490,880 |
| Size | 622.1 MB | 93.0 MB |
| Events in quadrant A | 8,783,582 | 534,518 |
| Events in quadrant B | 3,486,471 | 736,107 |
| Events in quadrant C | 4,555,987 | 623,764 |
| Events in quadrant D | 6,743,480 | 539,891 |
| Mode M0 | |||
|---|---|---|---|
| Quadrant | BADHDUFLAG | Total packets | Discarded packets |
| A | 0 | 31227 | 2 |
| B | 0 | 15707 | 2 |
| C | 0 | 19085 | 2 |
| D | 0 | 25368 | 2 |
| Mode SS | |||
|---|---|---|---|
| Quadrant | BADHDUFLAG | Total packets | Discarded packets |
| A | 0 | 150 | 0 |
| B | 0 | 150 | 0 |
| C | 0 | 150 | 0 |
| D | 0 | 150 | 0 |
| Mode M9 | |||
|---|---|---|---|
| Quadrant | BADHDUFLAG | Total packets | Discarded packets |
| A | 0 | 16 | 0 |
| B | 0 | 16 | 0 |
| C | 0 | 16 | 0 |
| D | 0 | 16 | 0 |
| Quadrant | Total seconds | Saturated seconds | Saturation percentage |
|---|---|---|---|
| A | 7443 | 1847 | 24.815263% |
| B | 7443 | 168 | 2.257154% |
| C | 7443 | 544 | 7.308881% |
| D | 7443 | 1126 | 15.128308% |
Noise dominated data is calculated using 1-second bins in cleaned event files. If a bin has >2000 counts, and if more than 50% of those come from <1% of pixels, then it is considered to be noise-dominated and hence unusable.
| Quadrant | # 1 sec bins | Bins with >0 counts | Bins with >2000 counts | High rate bins dominated by noise | Noise dominated (total time) | Noise dominated (detector-on time) | Marked lightcurve |
|---|---|---|---|---|---|---|---|
| A | 8943 | 7445 | 1502 | 1502 | 16.80% | 20.17% | 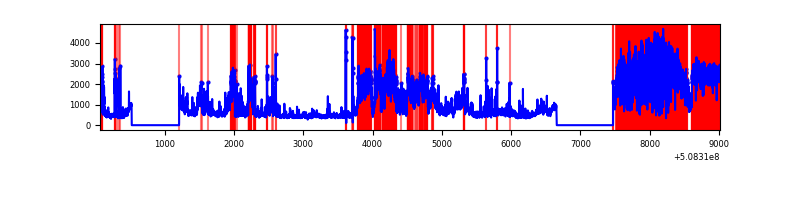 |
| B | 8943 | 7445 | 6 | 6 | 0.07% | 0.08% | 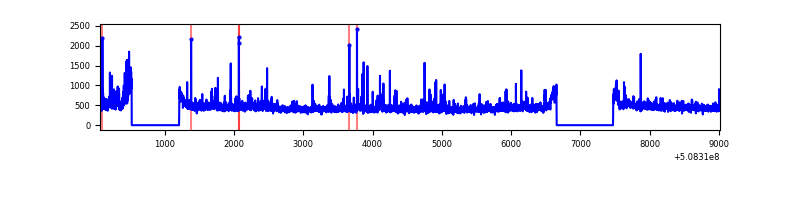 |
| C | 8943 | 7445 | 309 | 309 | 3.46% | 4.15% | 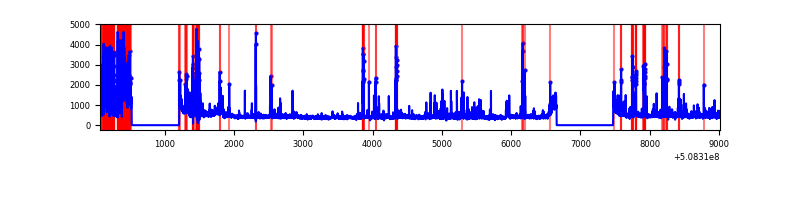 |
| D | 8943 | 7445 | 984 | 984 | 11.00% | 13.22% | 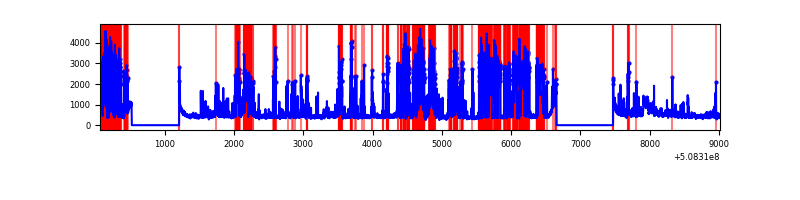 |
Top three noisy pixels from each quadrant. If the there are fewer than three noisy pixels in the level2.evt file, extra rows are filled as -1
| Pixel properties | Quadrant properties | ||||||
|---|---|---|---|---|---|---|---|
| Quadrant | DetID | PixID | Counts | Sigma | Mean | Median | Sigma |
| A | 12 | 115 | 4821672 | 26671.36 | 725 | 704 | 180.8 |
| A | 3 | 14 | 551507 | 3047.24 | 725 | 704 | 180.8 |
| A | 15 | 32 | 347332 | 1917.67 | 725 | 704 | 180.8 |
| B | 4 | 21 | 140082 | 817.37 | 796 | 763 | 170.4 |
| B | 5 | 172 | 50238 | 290.27 | 796 | 763 | 170.4 |
| B | 10 | 247 | 49447 | 285.62 | 796 | 763 | 170.4 |
| C | 12 | 254 | 1075581 | 5168.21 | 763 | 755 | 208.0 |
| C | 12 | 252 | 213078 | 1020.94 | 763 | 755 | 208.0 |
| C | 9 | 38 | 194763 | 932.87 | 763 | 755 | 208.0 |
| D | 8 | 129 | 2954671 | 14216.8 | 737 | 702 | 207.8 |
| D | 8 | 240 | 257372 | 1235.29 | 737 | 702 | 207.8 |
| D | 2 | 31 | 211157 | 1012.87 | 737 | 702 | 207.8 |
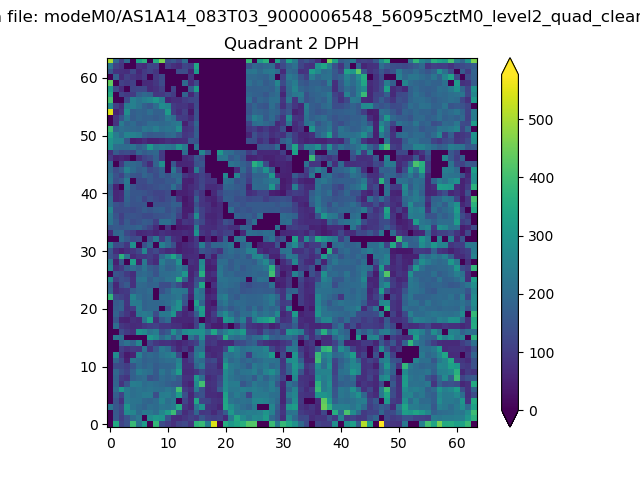
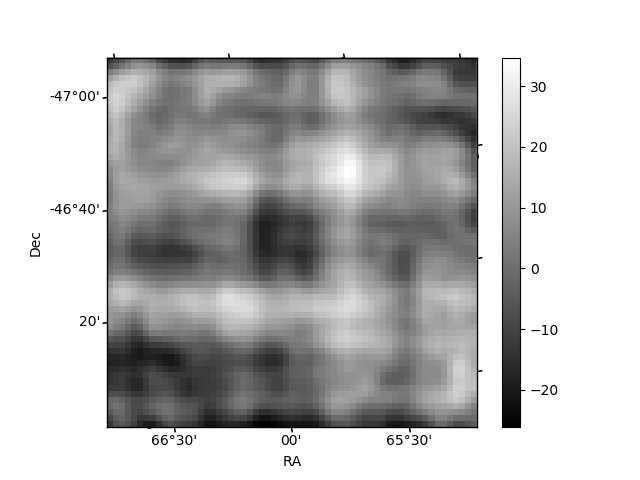
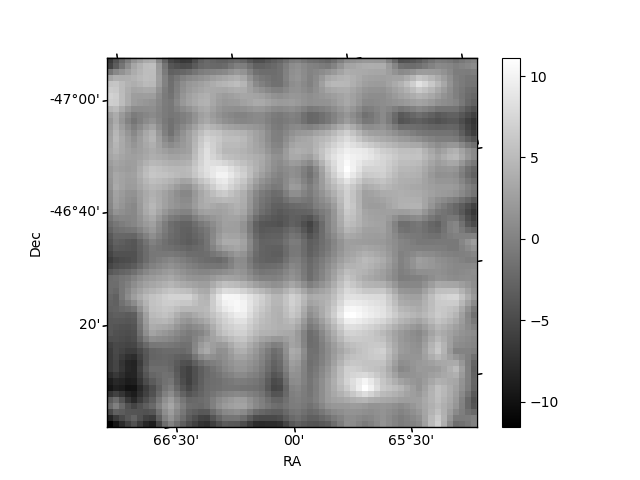
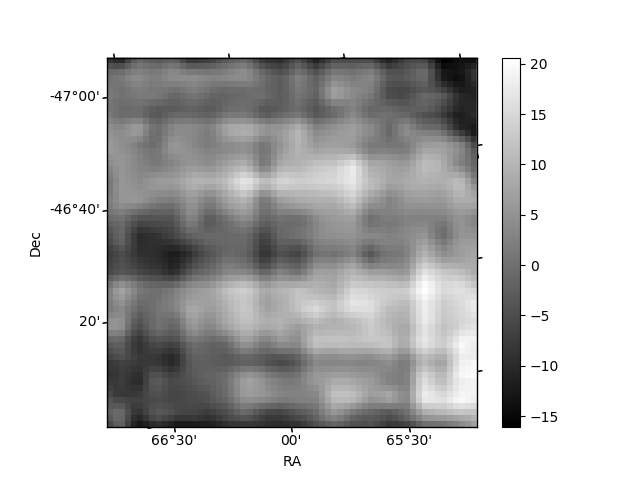
Histogram calculated using DETX and DETY for each event in the final _common_clean file
| Quadrant A | 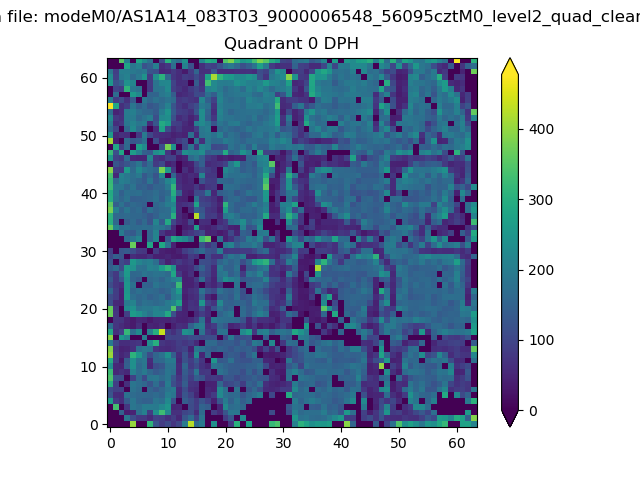 |
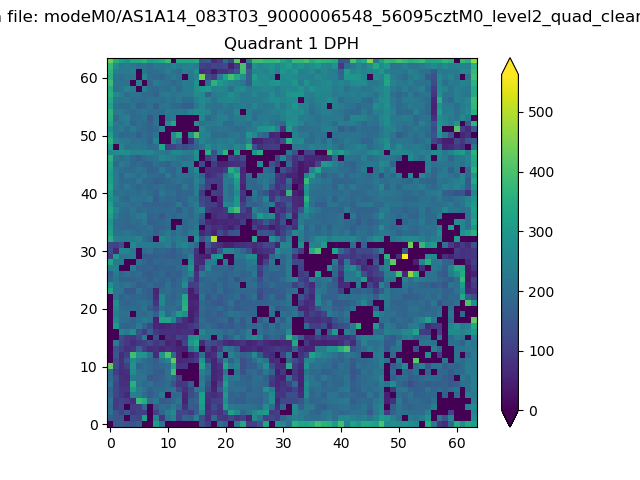 |
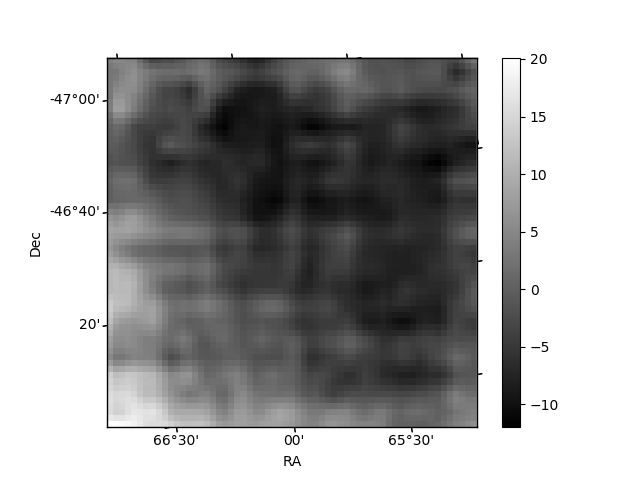
Quadrant B |
|---|---|---|---|
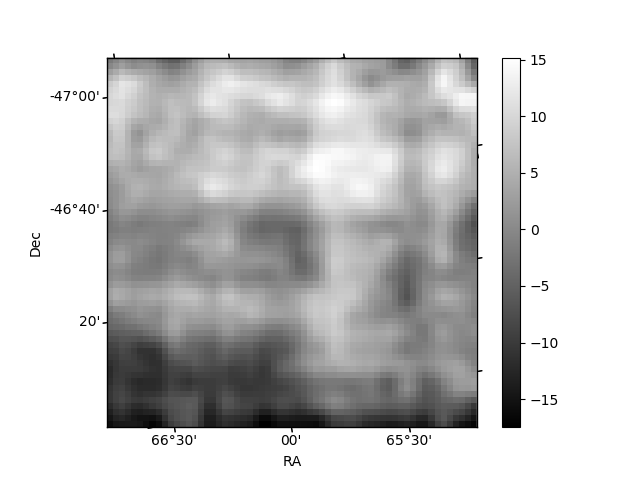
| Quadrant D | 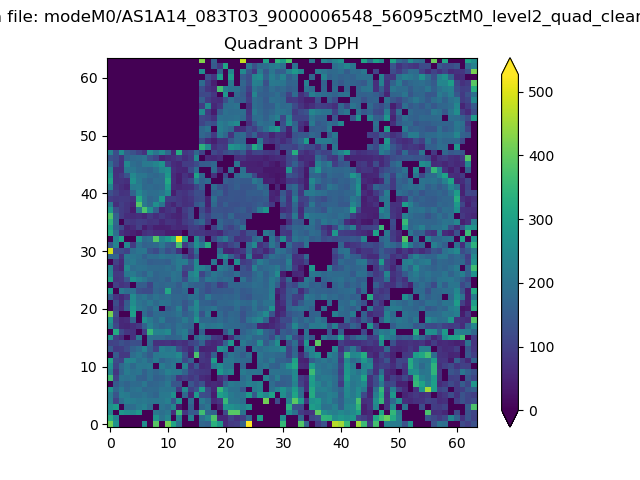 |
 |
Quadrant C |
| Plot type | Count rate plots | Images |
|---|---|---|
| Comparison with Poisson distribution Blue bars denote a histogram of data divided into 1 sec bins. Red curve is a Poisson curve with rate = median count rate of data. |
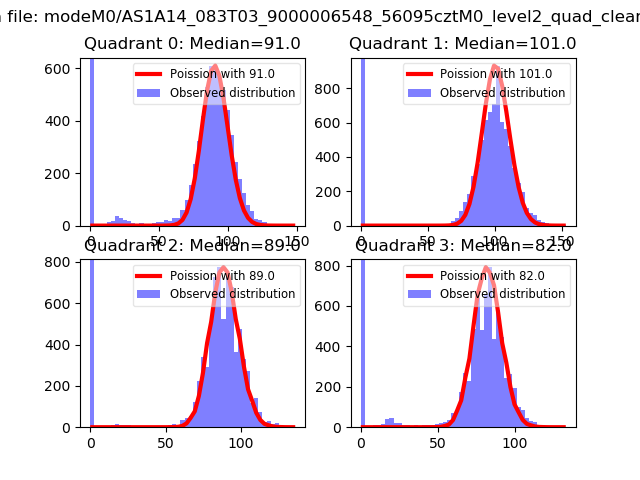 |
 |
| Quadrant-wise count rates Data is divided into 100 sec bins |
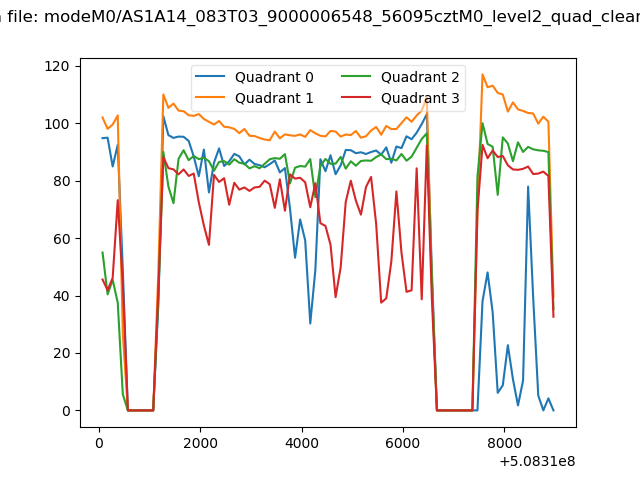 |
|
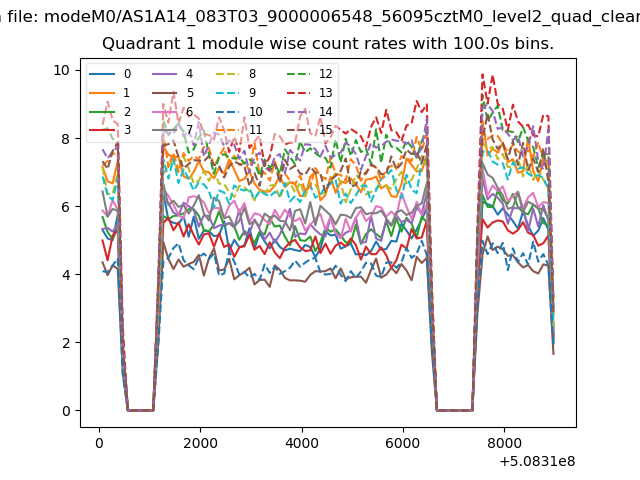
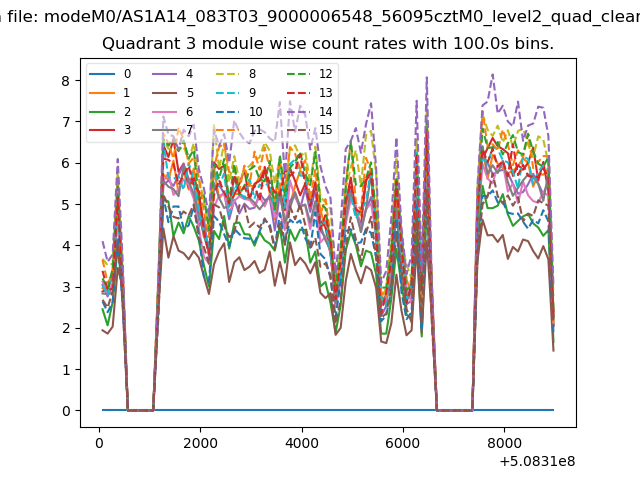
| Module-wise count rates for Quadrant A Data is divided into 100 sec bins |
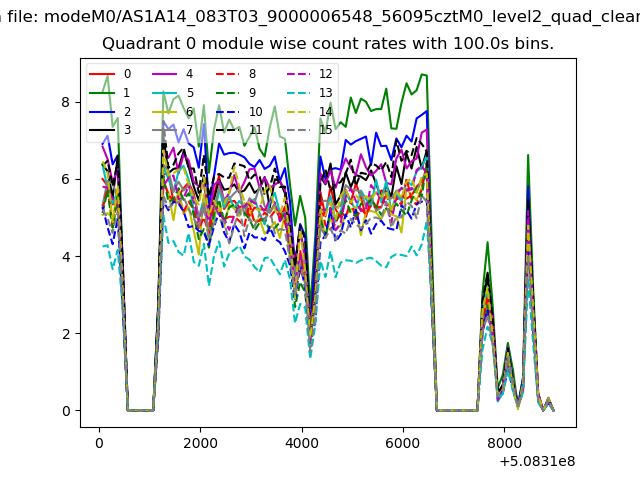 |
 |
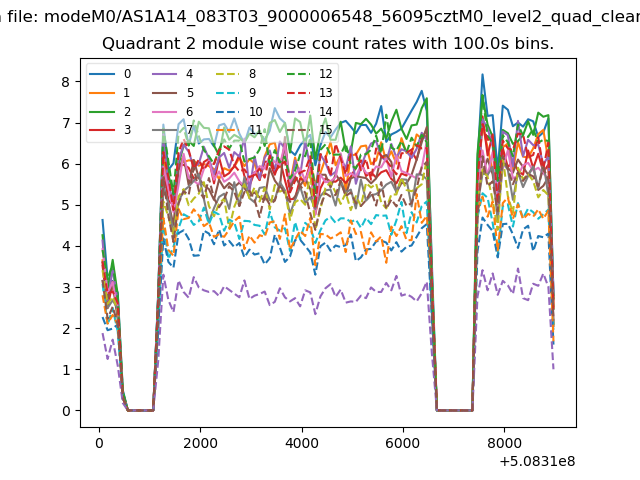
| Module-wise count rates for Quadrant B Data is divided into 100 sec bins |
 |
 |
| Module-wise count rates for Quadrant C Data is divided into 100 sec bins |
 |
 |
| Module-wise count rates for Quadrant D Data is divided into 100 sec bins |
 |
 |
| Parameter | Plot |
|---|---|
| CZT HV Monitor | 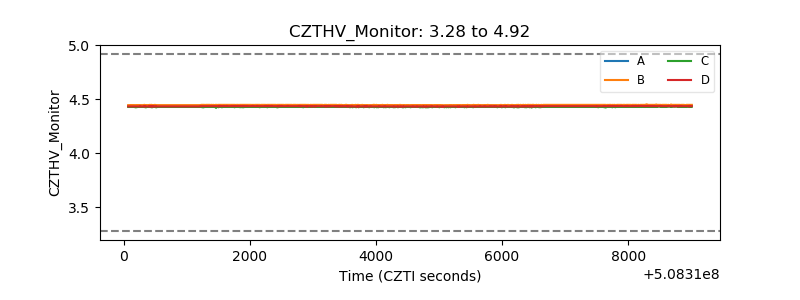 |
| D_VDD | 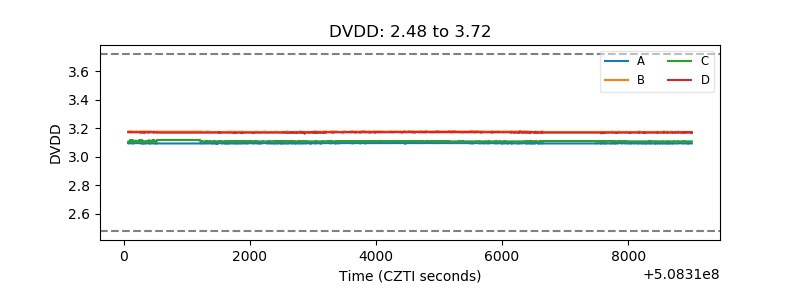 |
| Temperature 1 | 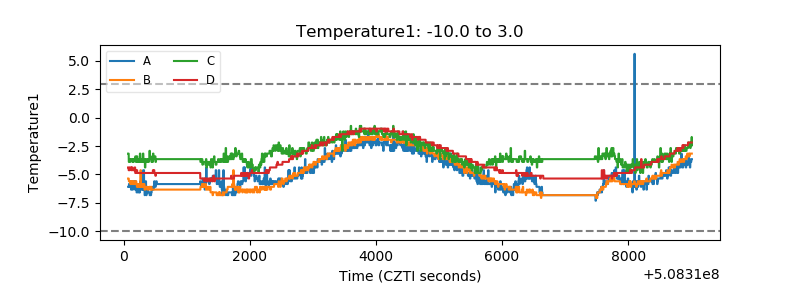 |
| Veto HV Monitor | 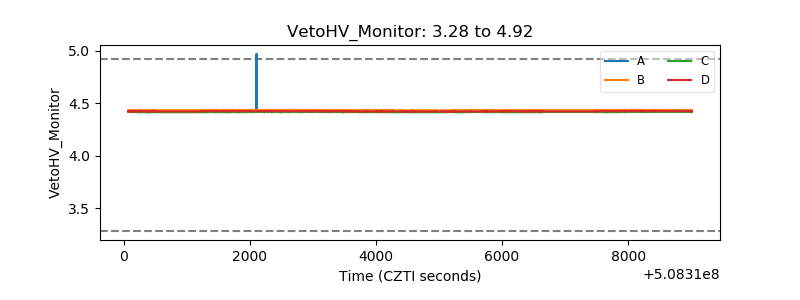 |
| Veto LLD | 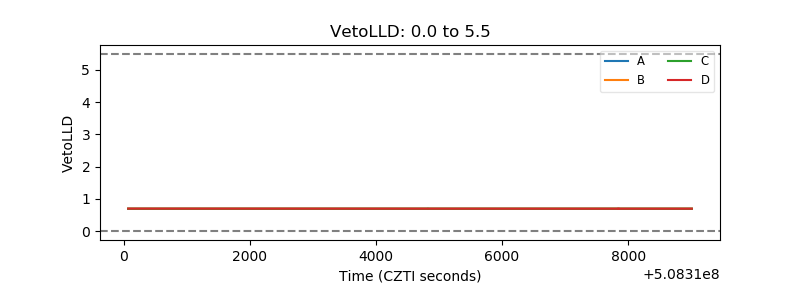 |
| Alpha Counter | 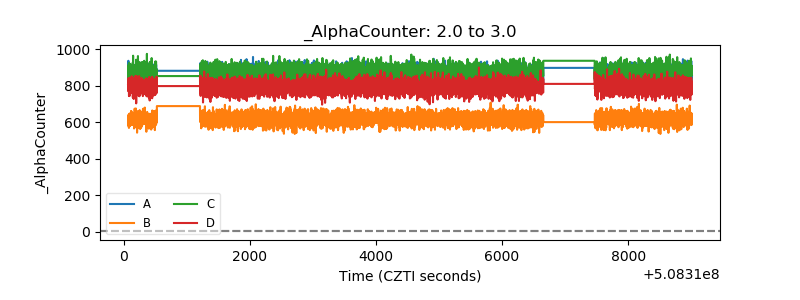 |
| _CPM_Rate | 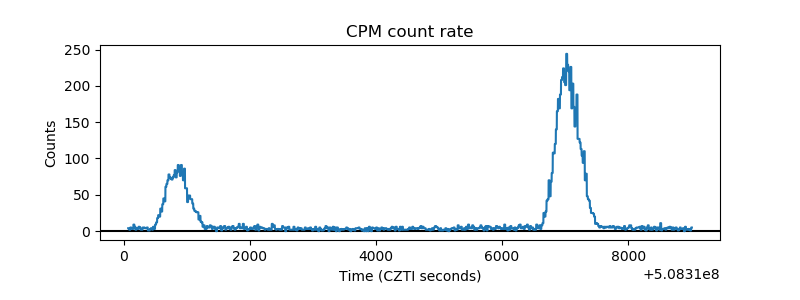 |
| CZT Counter | 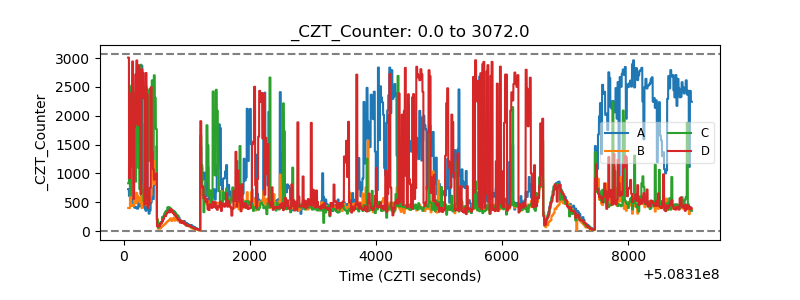 |
| +2.5 Volts monitor | 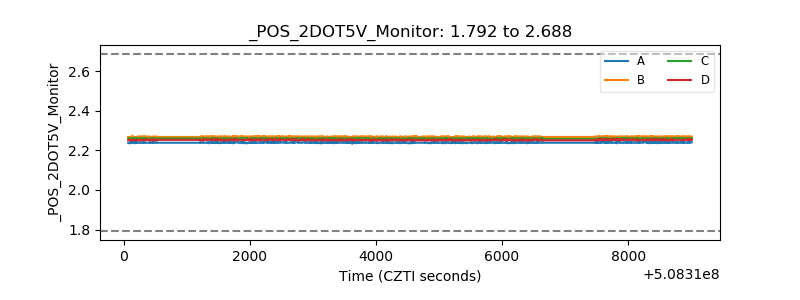 |
| +5 Volts monitor |  |
| _ROLL_ROT | 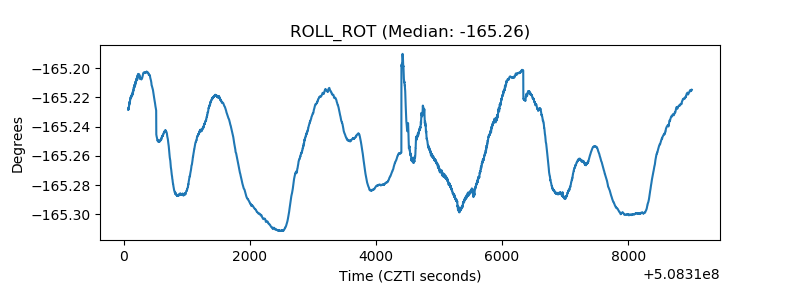 |
| _Roll_DEC | 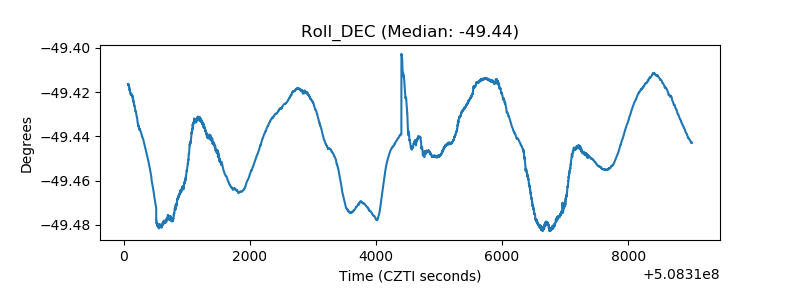 |
| _Roll_RA | 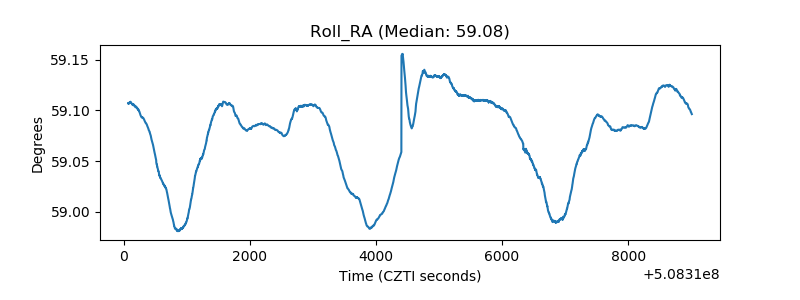 |
| Veto Counter | 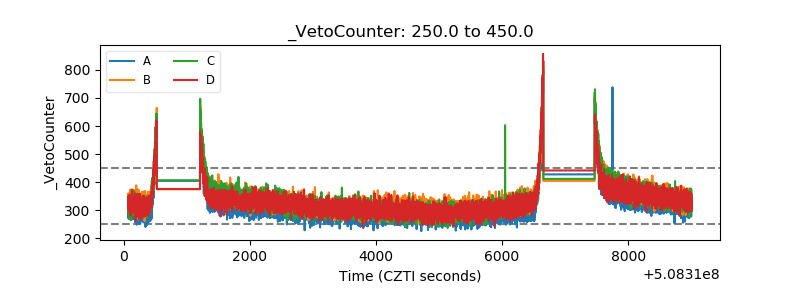 |