| Param | Original file | Final file |
|---|---|---|
| Filename | modeM0/AS1A14_083T03_9000006548_56097cztM0_level2.fits | modeM0/AS1A14_083T03_9000006548_56097cztM0_level2_quad_clean.evt |
| Size (bytes) | 662,362,560 | 87,163,200 |
| Size | 631.7 MB | 83.1 MB |
| Events in quadrant A | 11,199,274 | 372,044 |
| Events in quadrant B | 3,108,646 | 683,158 |
| Events in quadrant C | 3,778,717 | 602,870 |
| Events in quadrant D | 5,910,656 | 513,279 |
| Mode M0 | |||
|---|---|---|---|
| Quadrant | BADHDUFLAG | Total packets | Discarded packets |
| A | 0 | 37869 | 2 |
| B | 0 | 13991 | 2 |
| C | 0 | 16262 | 2 |
| D | 0 | 22192 | 2 |
| Mode SS | |||
|---|---|---|---|
| Quadrant | BADHDUFLAG | Total packets | Discarded packets |
| A | 0 | 136 | 0 |
| B | 0 | 136 | 0 |
| C | 0 | 136 | 0 |
| D | 0 | 136 | 0 |
| Mode M9 | |||
|---|---|---|---|
| Quadrant | BADHDUFLAG | Total packets | Discarded packets |
| A | 0 | 11 | 0 |
| B | 0 | 12 | 0 |
| C | 0 | 12 | 0 |
| D | 0 | 12 | 0 |
| Quadrant | Total seconds | Saturated seconds | Saturation percentage |
|---|---|---|---|
| A | 6710 | 3034 | 45.216095% |
| B | 6710 | 122 | 1.818182% |
| C | 6710 | 235 | 3.502235% |
| D | 6710 | 877 | 13.070045% |
Noise dominated data is calculated using 1-second bins in cleaned event files. If a bin has >2000 counts, and if more than 50% of those come from <1% of pixels, then it is considered to be noise-dominated and hence unusable.
| Quadrant | # 1 sec bins | Bins with >0 counts | Bins with >2000 counts | High rate bins dominated by noise | Noise dominated (total time) | Noise dominated (detector-on time) | Marked lightcurve |
|---|---|---|---|---|---|---|---|
| A | 7690 | 6711 | 2673 | 2673 | 34.76% | 39.83% | 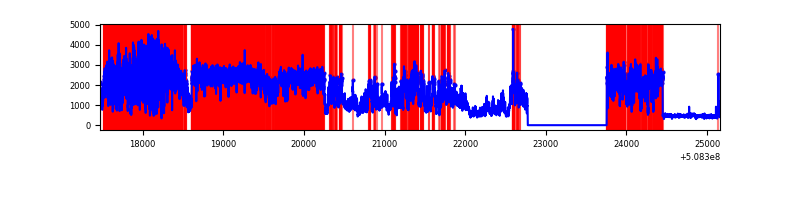 |
| B | 7690 | 6711 | 7 | 7 | 0.09% | 0.10% | 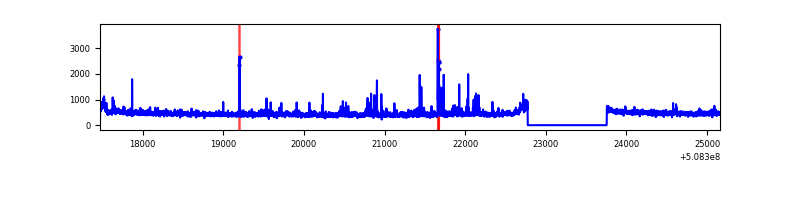 |
| C | 7690 | 6711 | 126 | 126 | 1.64% | 1.88% | 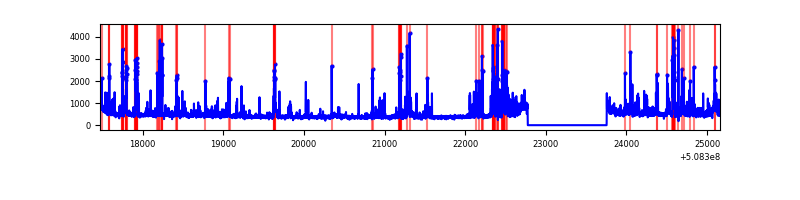 |
| D | 7690 | 6711 | 846 | 846 | 11.00% | 12.61% | 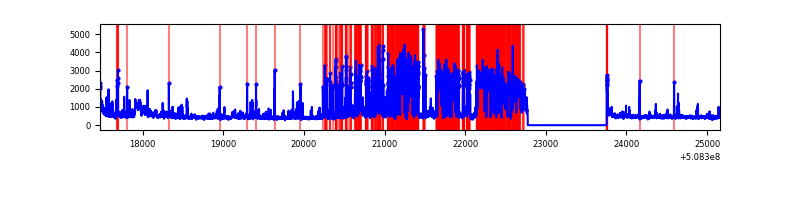 |
Top three noisy pixels from each quadrant. If the there are fewer than three noisy pixels in the level2.evt file, extra rows are filled as -1
| Pixel properties | Quadrant properties | ||||||
|---|---|---|---|---|---|---|---|
| Quadrant | DetID | PixID | Counts | Sigma | Mean | Median | Sigma |
| A | 12 | 115 | 8375476 | 55514.92 | 605 | 590 | 150.9 |
| A | 15 | 32 | 170925 | 1129.11 | 605 | 590 | 150.9 |
| A | 7 | 64 | 76962 | 506.25 | 605 | 590 | 150.9 |
| B | 4 | 21 | 108857 | 700.85 | 719 | 692 | 154.3 |
| B | 5 | 172 | 35805 | 227.51 | 719 | 692 | 154.3 |
| B | 10 | 247 | 25390 | 160.03 | 719 | 692 | 154.3 |
| C | 12 | 254 | 750564 | 3877.06 | 702 | 695 | 193.4 |
| C | 12 | 252 | 113547 | 583.48 | 702 | 695 | 193.4 |
| C | 6 | 223 | 73683 | 377.37 | 702 | 695 | 193.4 |
| D | 8 | 129 | 2390797 | 12519.55 | 678 | 648 | 190.9 |
| D | 8 | 240 | 305647 | 1597.58 | 678 | 648 | 190.9 |
| D | 2 | 62 | 146749 | 765.27 | 678 | 648 | 190.9 |
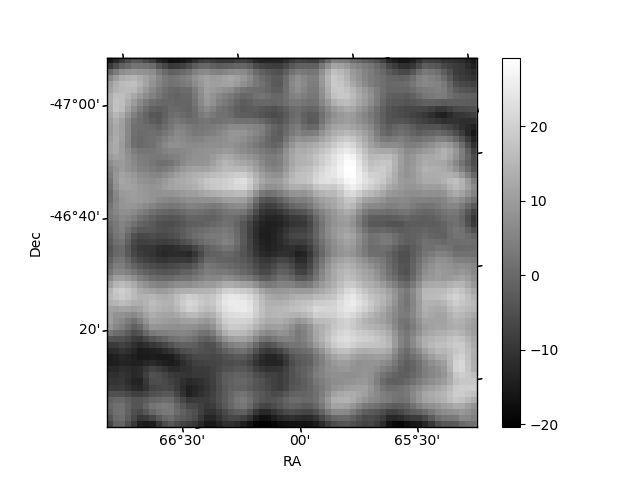
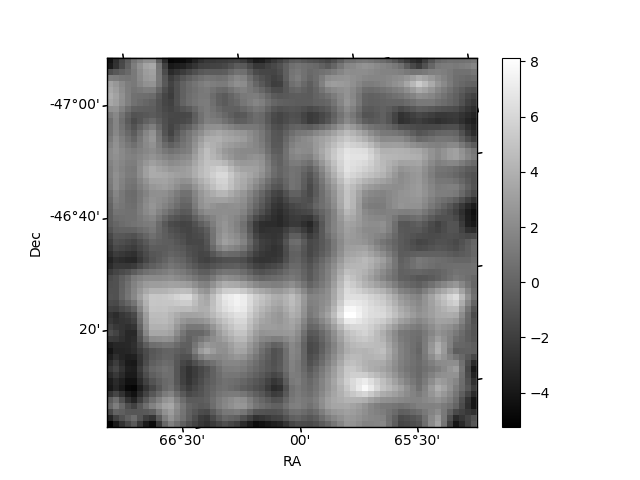
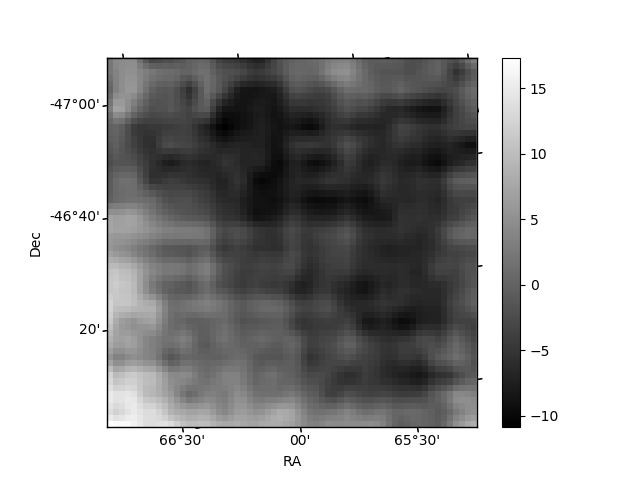
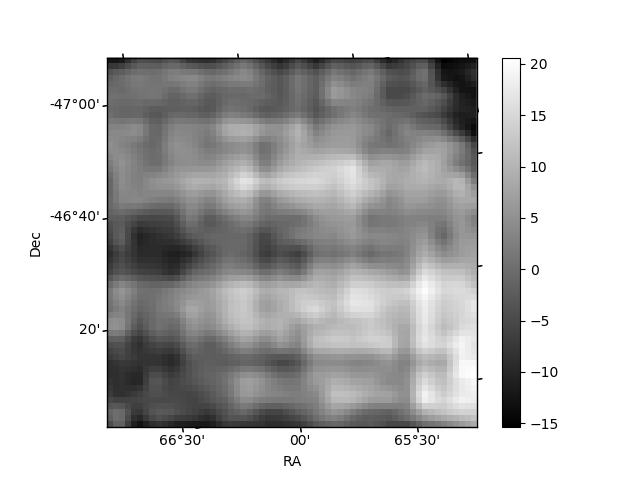
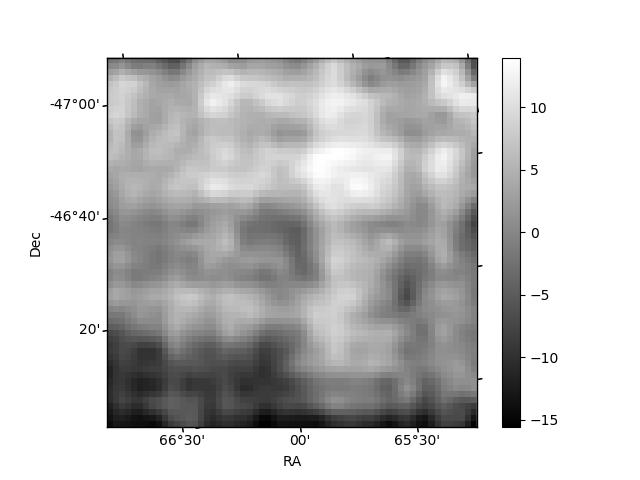
Histogram calculated using DETX and DETY for each event in the final _common_clean file
| Quadrant A | 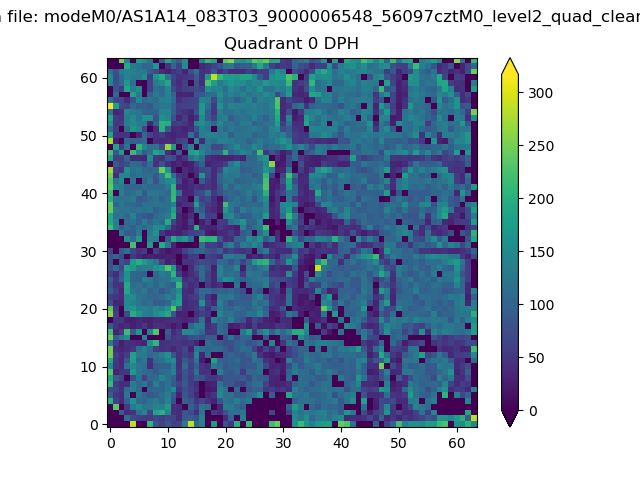 |
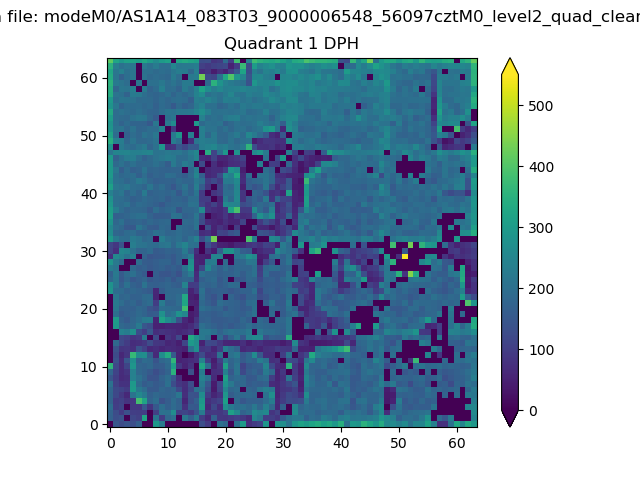 |
Quadrant B |
|---|---|---|---|
| Quadrant D | 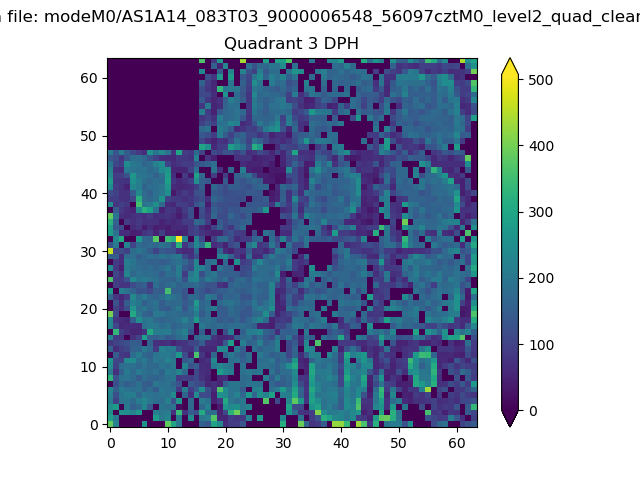 |
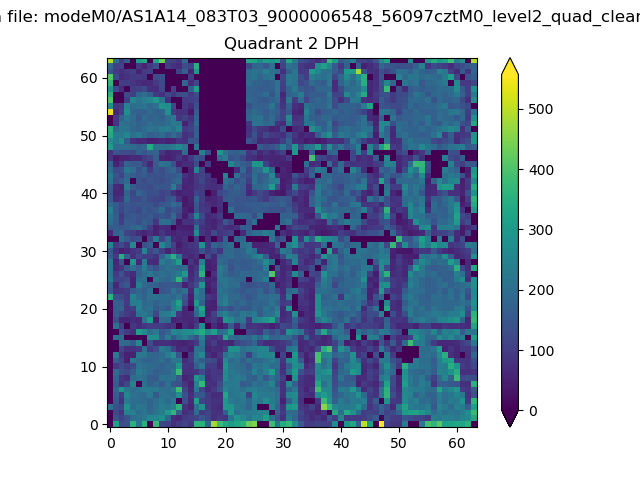 |
Quadrant C |
| Plot type | Count rate plots | Images |
|---|---|---|
| Comparison with Poisson distribution Blue bars denote a histogram of data divided into 1 sec bins. Red curve is a Poisson curve with rate = median count rate of data. |
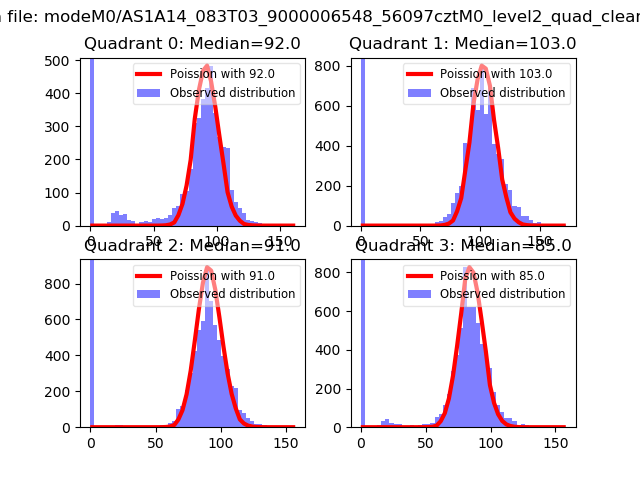 |
 |
| Quadrant-wise count rates Data is divided into 100 sec bins |
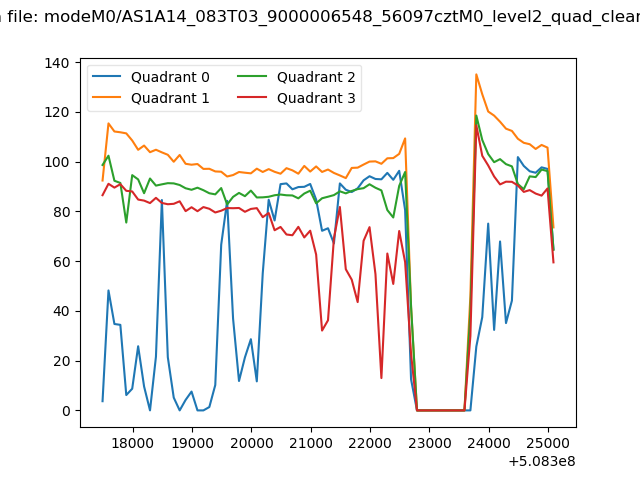 |
|
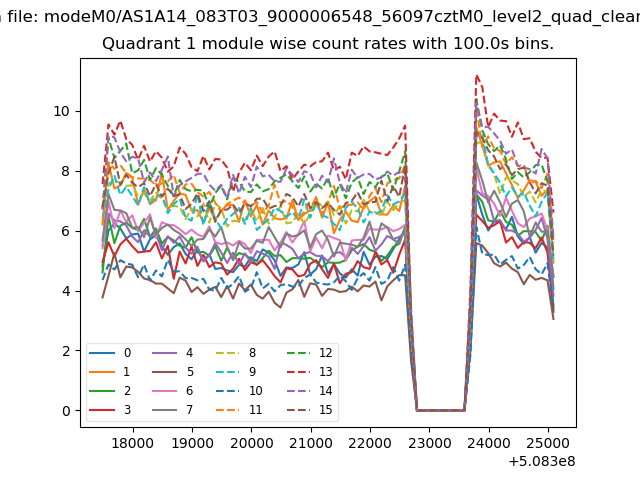
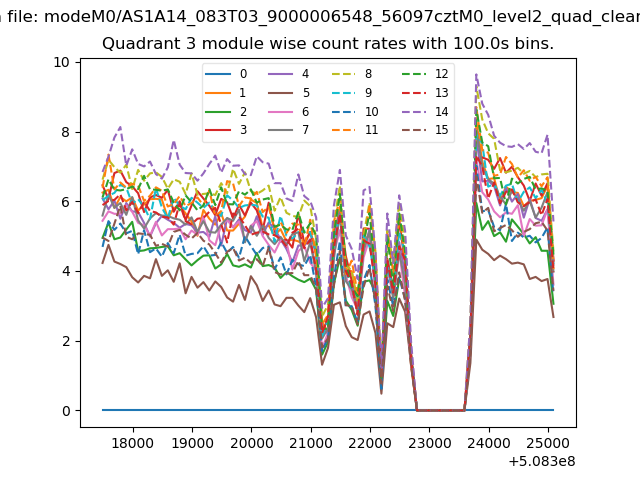
| Module-wise count rates for Quadrant A Data is divided into 100 sec bins |
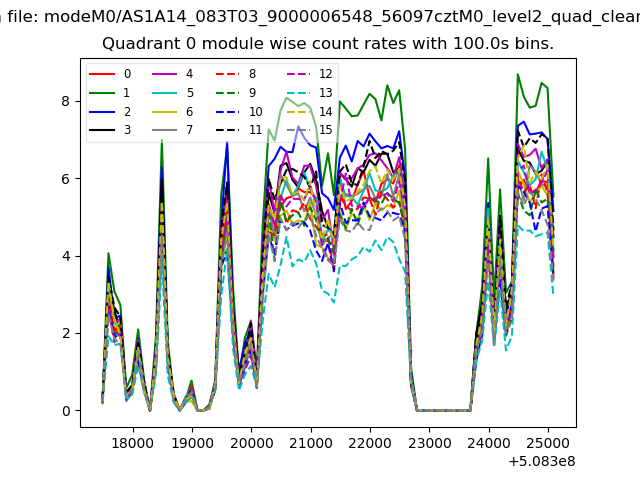 |
 |
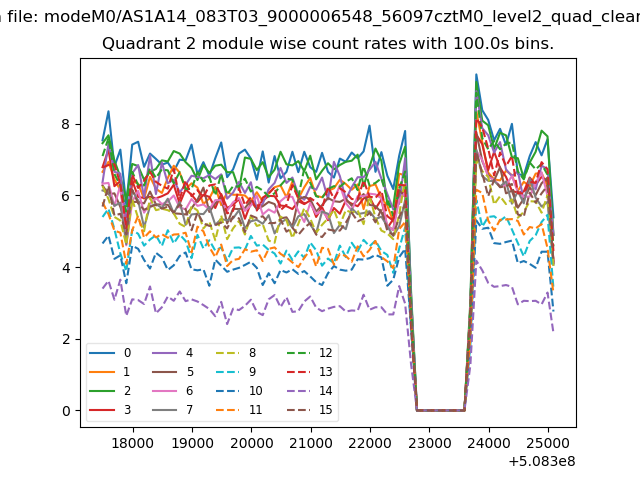
| Module-wise count rates for Quadrant B Data is divided into 100 sec bins |
 |
 |
| Module-wise count rates for Quadrant C Data is divided into 100 sec bins |
 |
 |
| Module-wise count rates for Quadrant D Data is divided into 100 sec bins |
 |
 |
| Parameter | Plot |
|---|---|
| CZT HV Monitor | 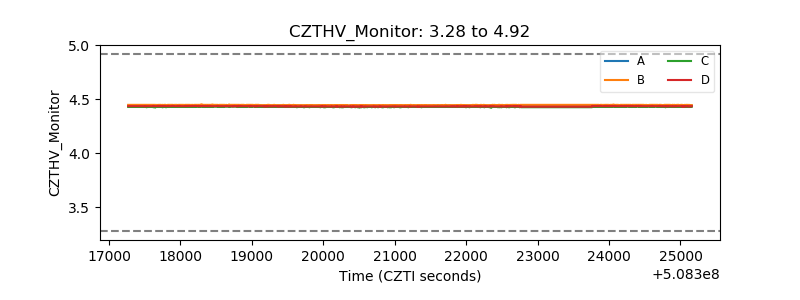 |
| D_VDD | 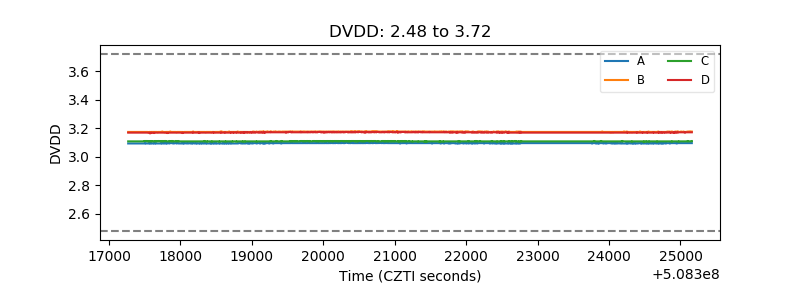 |
| Temperature 1 | 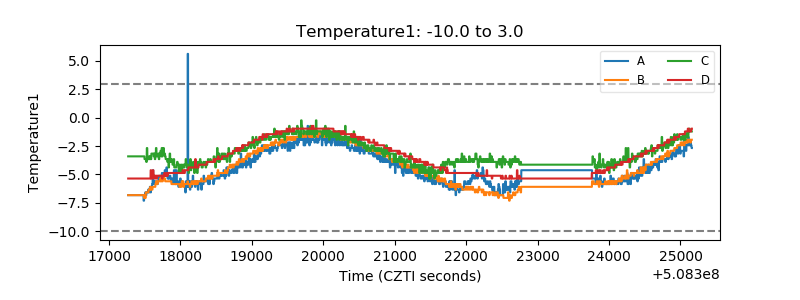 |
| Veto HV Monitor | 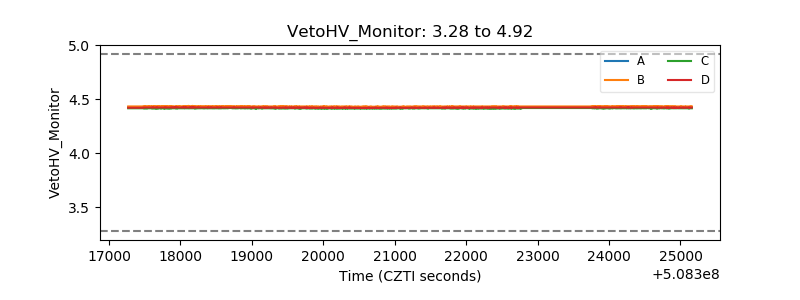 |
| Veto LLD | 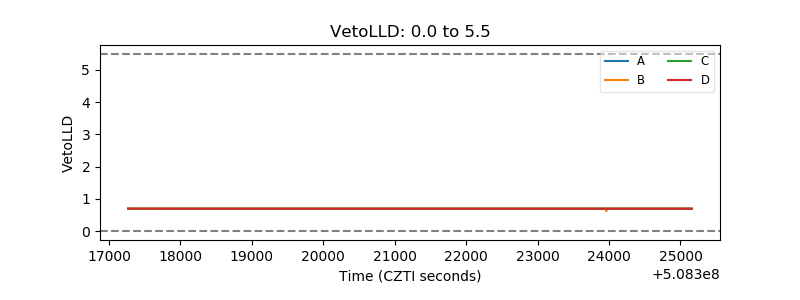 |
| Alpha Counter | 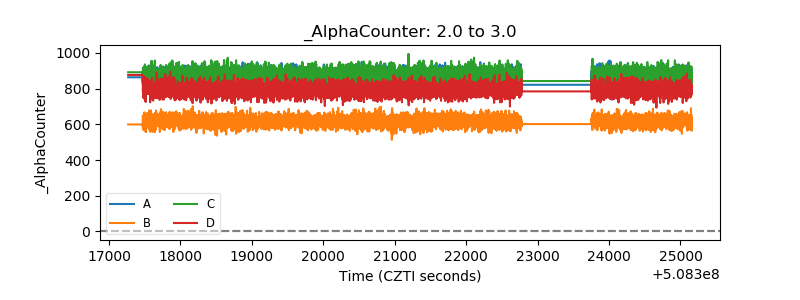 |
| _CPM_Rate | 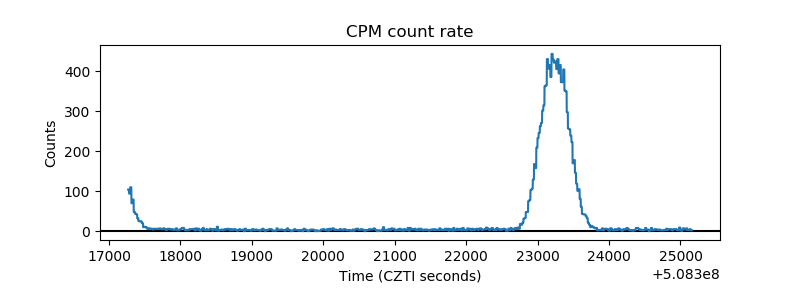 |
| CZT Counter | 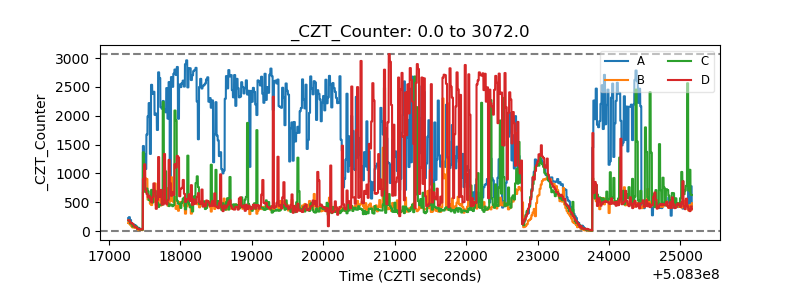 |
| +2.5 Volts monitor |  |
| +5 Volts monitor |  |
| _ROLL_ROT | 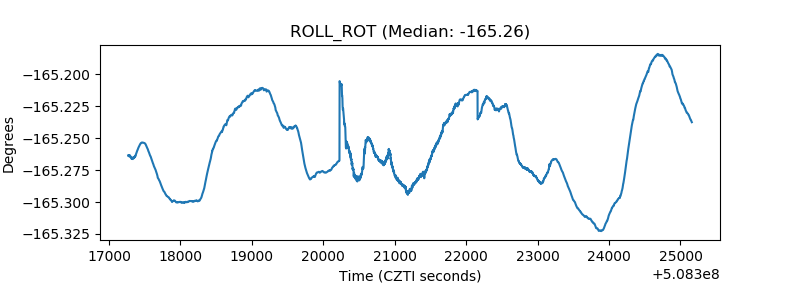 |
| _Roll_DEC | 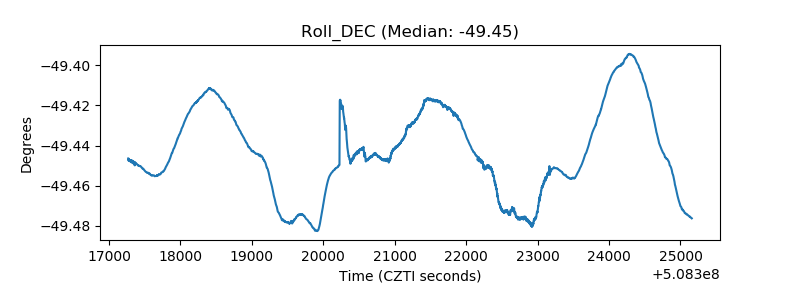 |
| _Roll_RA | 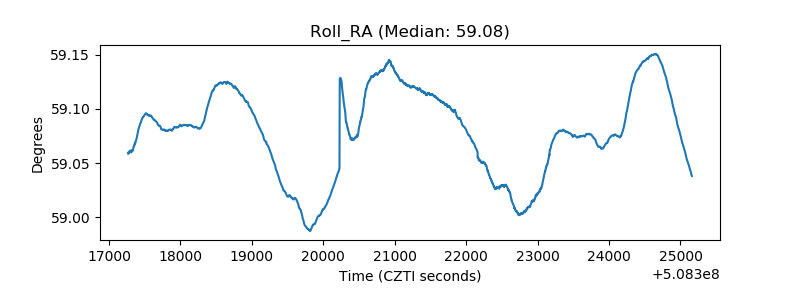 |
| Veto Counter | 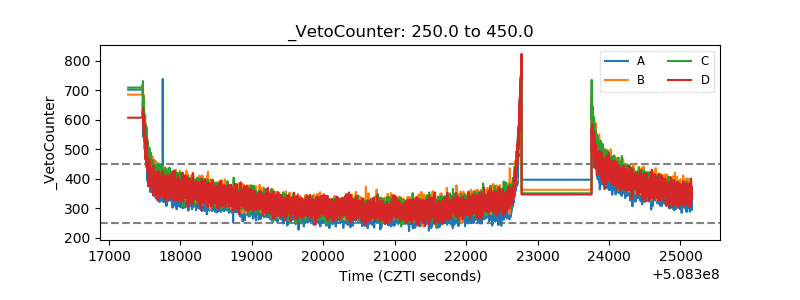 |