| Param | Original file | Final file |
|---|---|---|
| Filename | modeM0/AS1A14_083T03_9000006548_56098cztM0_level2.fits | modeM0/AS1A14_083T03_9000006548_56098cztM0_level2_quad_clean.evt |
| Size (bytes) | 474,719,040 | 95,160,960 |
| Size | 452.7 MB | 90.8 MB |
| Events in quadrant A | 4,433,694 | 591,040 |
| Events in quadrant B | 3,177,826 | 696,909 |
| Events in quadrant C | 5,216,012 | 569,681 |
| Events in quadrant D | 4,236,037 | 566,967 |
| Mode M0 | |||
|---|---|---|---|
| Quadrant | BADHDUFLAG | Total packets | Discarded packets |
| A | 0 | 17897 | 2 |
| B | 0 | 13941 | 2 |
| C | 0 | 20091 | 2 |
| D | 0 | 17209 | 2 |
| Mode SS | |||
|---|---|---|---|
| Quadrant | BADHDUFLAG | Total packets | Discarded packets |
| A | 0 | 134 | 0 |
| B | 0 | 134 | 0 |
| C | 0 | 134 | 0 |
| D | 0 | 134 | 0 |
| Mode M9 | |||
|---|---|---|---|
| Quadrant | BADHDUFLAG | Total packets | Discarded packets |
| A | 0 | 13 | 0 |
| B | 0 | 14 | 0 |
| C | 0 | 14 | 0 |
| D | 0 | 14 | 0 |
| Quadrant | Total seconds | Saturated seconds | Saturation percentage |
|---|---|---|---|
| A | 6547 | 589 | 8.996487% |
| B | 6547 | 84 | 1.283030% |
| C | 6547 | 655 | 10.004582% |
| D | 6547 | 224 | 3.421414% |
Noise dominated data is calculated using 1-second bins in cleaned event files. If a bin has >2000 counts, and if more than 50% of those come from <1% of pixels, then it is considered to be noise-dominated and hence unusable.
| Quadrant | # 1 sec bins | Bins with >0 counts | Bins with >2000 counts | High rate bins dominated by noise | Noise dominated (total time) | Noise dominated (detector-on time) | Marked lightcurve |
|---|---|---|---|---|---|---|---|
| A | 7622 | 6548 | 397 | 397 | 5.21% | 6.06% | 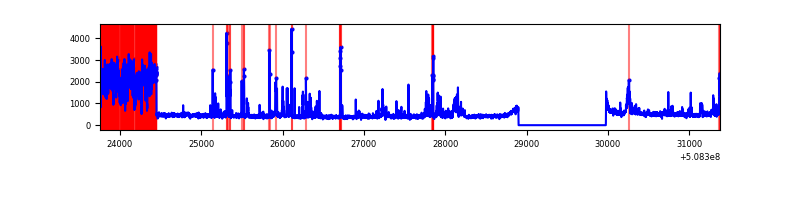 |
| B | 7622 | 6548 | 15 | 15 | 0.20% | 0.23% | 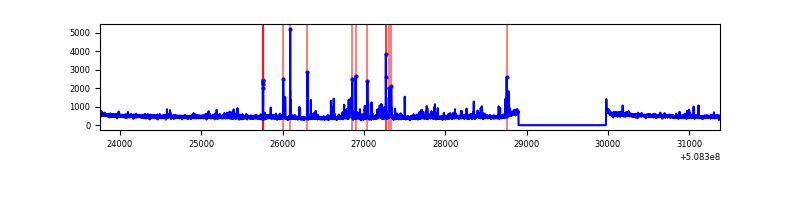 |
| C | 7622 | 6548 | 404 | 404 | 5.30% | 6.17% | 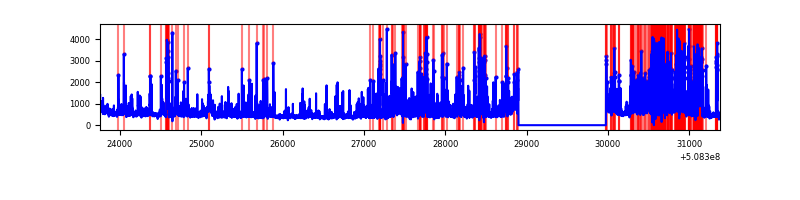 |
| D | 7622 | 6548 | 145 | 145 | 1.90% | 2.21% | 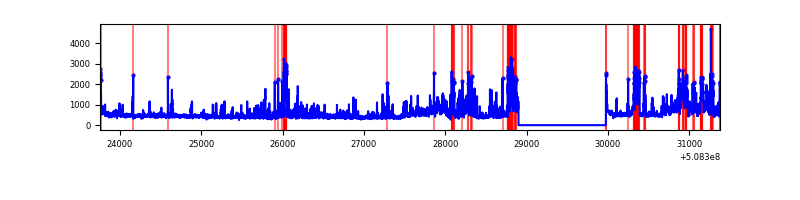 |
Top three noisy pixels from each quadrant. If the there are fewer than three noisy pixels in the level2.evt file, extra rows are filled as -1
| Pixel properties | Quadrant properties | ||||||
|---|---|---|---|---|---|---|---|
| Quadrant | DetID | PixID | Counts | Sigma | Mean | Median | Sigma |
| A | 12 | 115 | 1279768 | 7387.79 | 701 | 684 | 173.1 |
| A | 15 | 32 | 280352 | 1615.32 | 701 | 684 | 173.1 |
| A | 0 | 8 | 40902 | 232.29 | 701 | 684 | 173.1 |
| B | 4 | 21 | 176067 | 1144.29 | 712 | 685 | 153.3 |
| B | 10 | 247 | 31593 | 201.66 | 712 | 685 | 153.3 |
| B | 7 | 252 | 28308 | 180.23 | 712 | 685 | 153.3 |
| C | 12 | 254 | 2091870 | 11444.93 | 664 | 658 | 182.7 |
| C | 12 | 252 | 314586 | 1718.09 | 664 | 658 | 182.7 |
| C | 9 | 38 | 128337 | 698.77 | 664 | 658 | 182.7 |
| D | 2 | 120 | 508342 | 2610.11 | 688 | 657 | 194.5 |
| D | 5 | 222 | 326580 | 1675.64 | 688 | 657 | 194.5 |
| D | 8 | 129 | 231443 | 1186.52 | 688 | 657 | 194.5 |
Histogram calculated using DETX and DETY for each event in the final _common_clean file
| Quadrant A |  |
 |
Quadrant B |
|---|---|---|---|
| Quadrant D |  |
 |
Quadrant C |
| Plot type | Count rate plots | Images |
|---|---|---|
| Comparison with Poisson distribution Blue bars denote a histogram of data divided into 1 sec bins. Red curve is a Poisson curve with rate = median count rate of data. |
 |
 |
| Quadrant-wise count rates Data is divided into 100 sec bins |
 |
|
| Module-wise count rates for Quadrant A Data is divided into 100 sec bins |
 |
 |
| Module-wise count rates for Quadrant B Data is divided into 100 sec bins |
 |
 |
| Module-wise count rates for Quadrant C Data is divided into 100 sec bins |
 |
 |
| Module-wise count rates for Quadrant D Data is divided into 100 sec bins |
 |
 |
| Parameter | Plot |
|---|---|
| CZT HV Monitor | 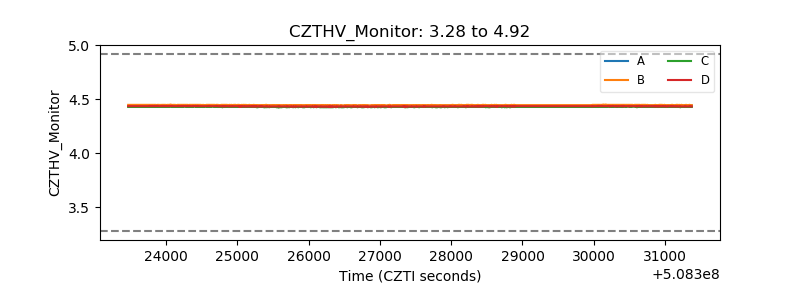 |
| D_VDD | 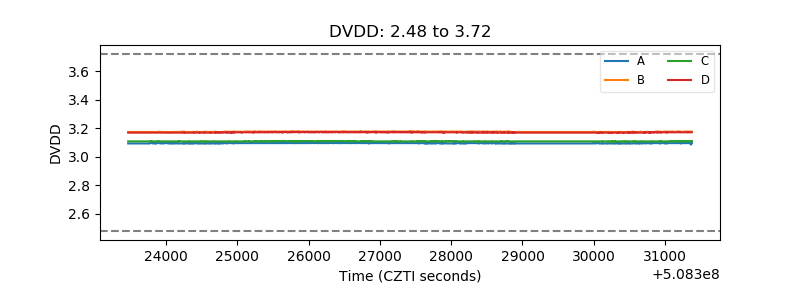 |
| Temperature 1 | 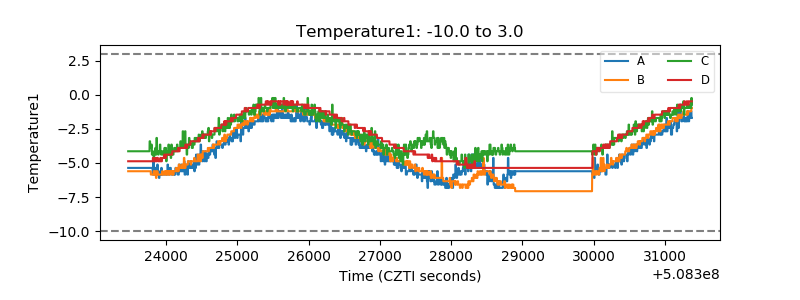 |
| Veto HV Monitor |  |
| Veto LLD | 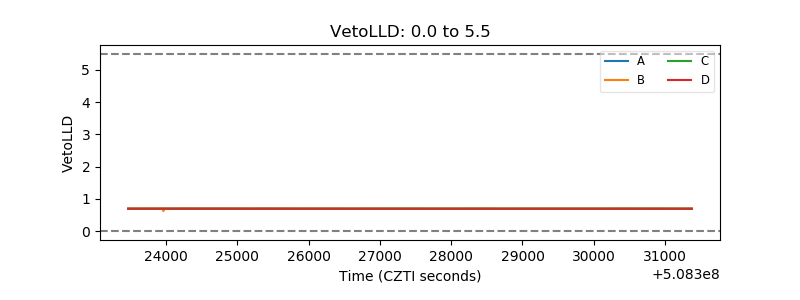 |
| Alpha Counter | 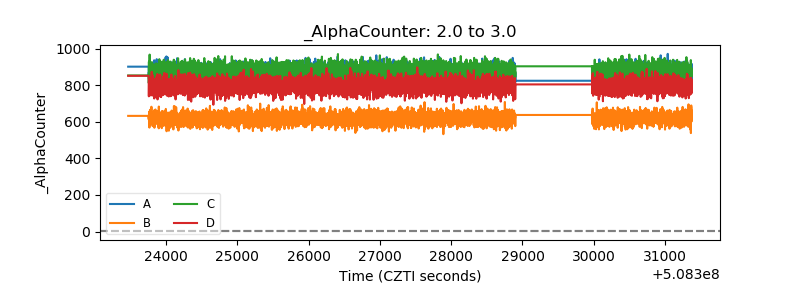 |
| _CPM_Rate | 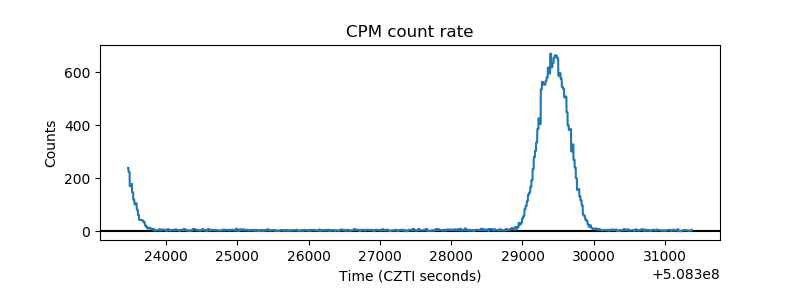 |
| CZT Counter | 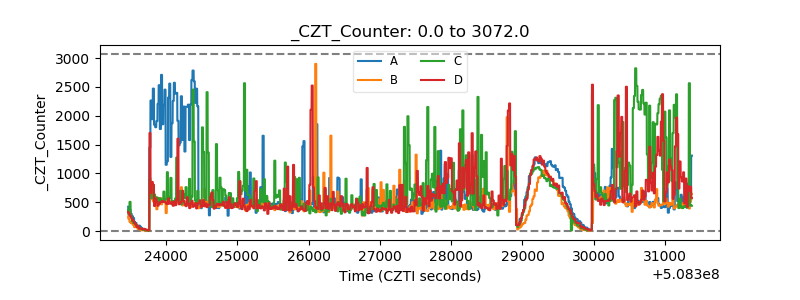 |
| +2.5 Volts monitor |  |
| +5 Volts monitor | 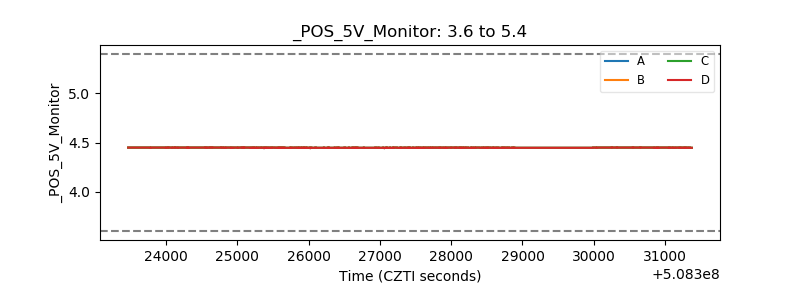 |
| _ROLL_ROT | 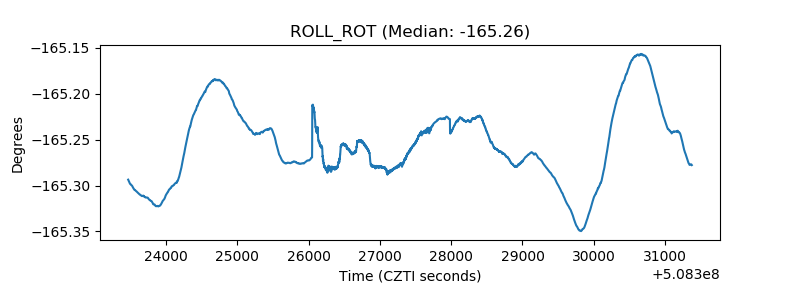 |
| _Roll_DEC | 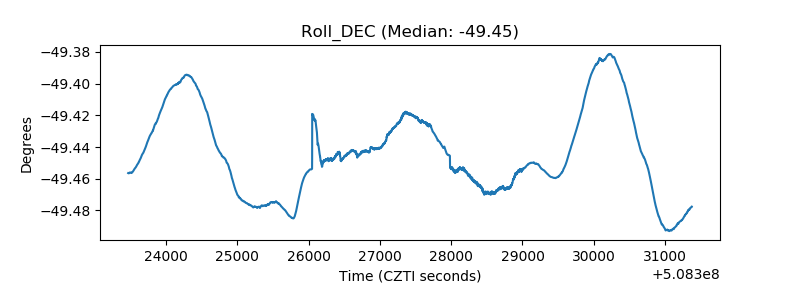 |
| _Roll_RA | 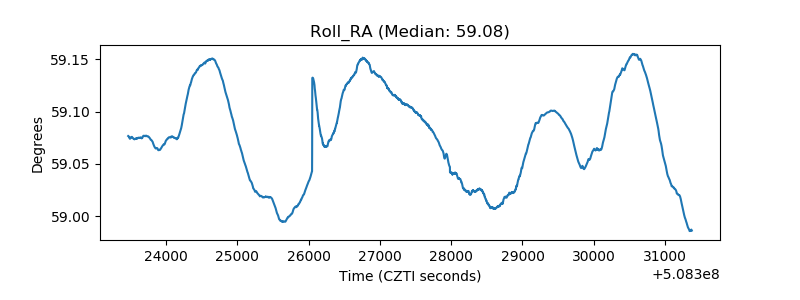 |
| Veto Counter | 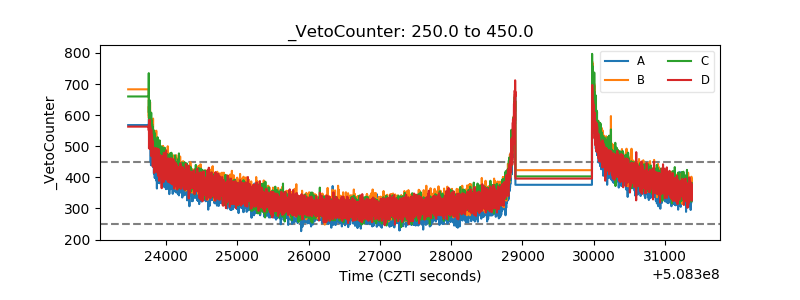 |