| Param | Original file | Final file |
|---|---|---|
| Filename | modeM0/AS1A14_083T03_9000006548_56099cztM0_level2.fits | modeM0/AS1A14_083T03_9000006548_56099cztM0_level2_quad_clean.evt |
| Size (bytes) | 523,445,760 | 99,213,120 |
| Size | 499.2 MB | 94.6 MB |
| Events in quadrant A | 4,628,393 | 651,059 |
| Events in quadrant B | 3,447,932 | 728,195 |
| Events in quadrant C | 5,179,245 | 592,616 |
| Events in quadrant D | 5,599,298 | 564,731 |
| Mode M0 | |||
|---|---|---|---|
| Quadrant | BADHDUFLAG | Total packets | Discarded packets |
| A | 0 | 18273 | 2 |
| B | 0 | 14803 | 2 |
| C | 0 | 20373 | 2 |
| D | 0 | 21292 | 2 |
| Mode SS | |||
|---|---|---|---|
| Quadrant | BADHDUFLAG | Total packets | Discarded packets |
| A | 0 | 134 | 0 |
| B | 0 | 134 | 0 |
| C | 0 | 134 | 0 |
| D | 0 | 134 | 0 |
| Mode M9 | |||
|---|---|---|---|
| Quadrant | BADHDUFLAG | Total packets | Discarded packets |
| A | 0 | 14 | 0 |
| B | 0 | 14 | 0 |
| C | 0 | 15 | 0 |
| D | 0 | 15 | 0 |
| Quadrant | Total seconds | Saturated seconds | Saturation percentage |
|---|---|---|---|
| A | 6713 | 343 | 5.109489% |
| B | 6713 | 96 | 1.430061% |
| C | 6713 | 669 | 9.965738% |
| D | 6713 | 604 | 8.997468% |
Noise dominated data is calculated using 1-second bins in cleaned event files. If a bin has >2000 counts, and if more than 50% of those come from <1% of pixels, then it is considered to be noise-dominated and hence unusable.
| Quadrant | # 1 sec bins | Bins with >0 counts | Bins with >2000 counts | High rate bins dominated by noise | Noise dominated (total time) | Noise dominated (detector-on time) | Marked lightcurve |
|---|---|---|---|---|---|---|---|
| A | 7863 | 6714 | 283 | 283 | 3.60% | 4.22% | 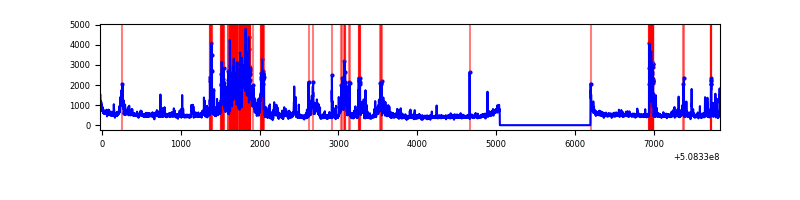 |
| B | 7863 | 6714 | 22 | 22 | 0.28% | 0.33% | 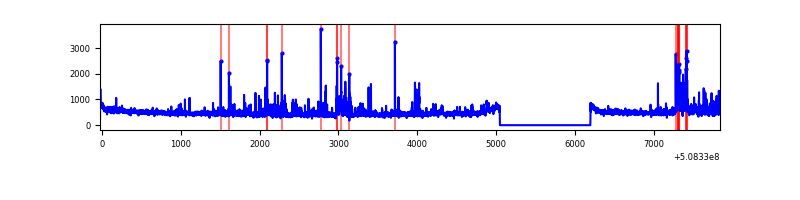 |
| C | 7863 | 6714 | 453 | 453 | 5.76% | 6.75% | 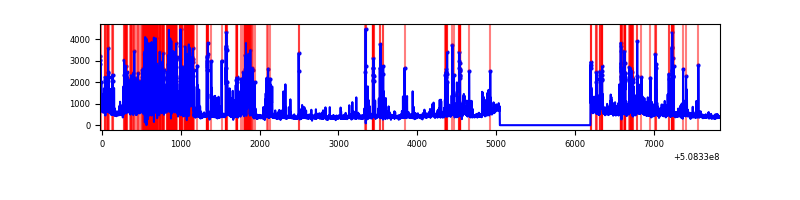 |
| D | 7863 | 6714 | 606 | 606 | 7.71% | 9.03% | 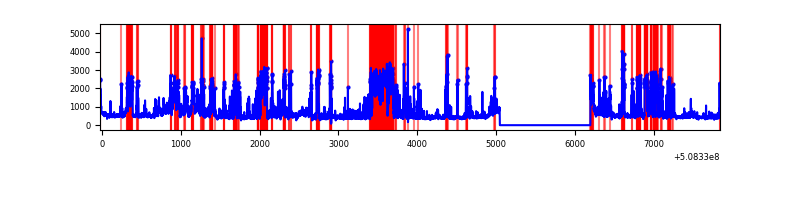 |
Top three noisy pixels from each quadrant. If the there are fewer than three noisy pixels in the level2.evt file, extra rows are filled as -1
| Pixel properties | Quadrant properties | ||||||
|---|---|---|---|---|---|---|---|
| Quadrant | DetID | PixID | Counts | Sigma | Mean | Median | Sigma |
| A | 15 | 32 | 816236 | 4489.09 | 734 | 716 | 181.7 |
| A | 12 | 115 | 712415 | 3917.6 | 734 | 716 | 181.7 |
| A | 3 | 14 | 152280 | 834.29 | 734 | 716 | 181.7 |
| B | 4 | 21 | 194570 | 1239.79 | 734 | 708 | 156.4 |
| B | 5 | 185 | 98323 | 624.27 | 734 | 708 | 156.4 |
| B | 7 | 252 | 51968 | 327.82 | 734 | 708 | 156.4 |
| C | 12 | 254 | 2014854 | 10724.01 | 680 | 672 | 187.8 |
| C | 12 | 252 | 302116 | 1604.96 | 680 | 672 | 187.8 |
| C | 15 | 230 | 81627 | 431.02 | 680 | 672 | 187.8 |
| D | 8 | 129 | 1005734 | 5085.89 | 698 | 666 | 197.6 |
| D | 8 | 240 | 942884 | 4767.86 | 698 | 666 | 197.6 |
| D | 2 | 120 | 350816 | 1771.85 | 698 | 666 | 197.6 |
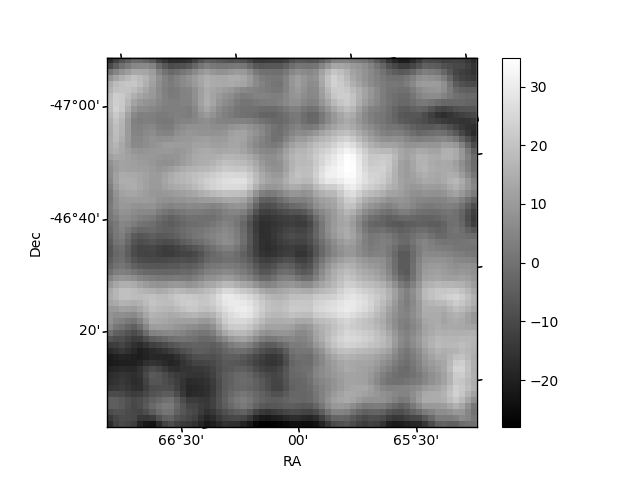
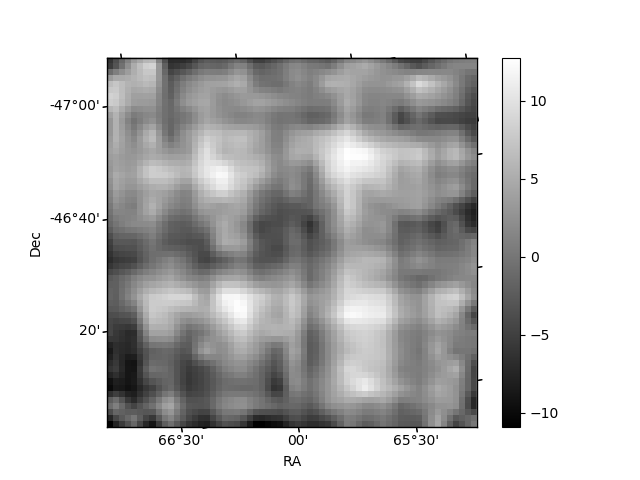
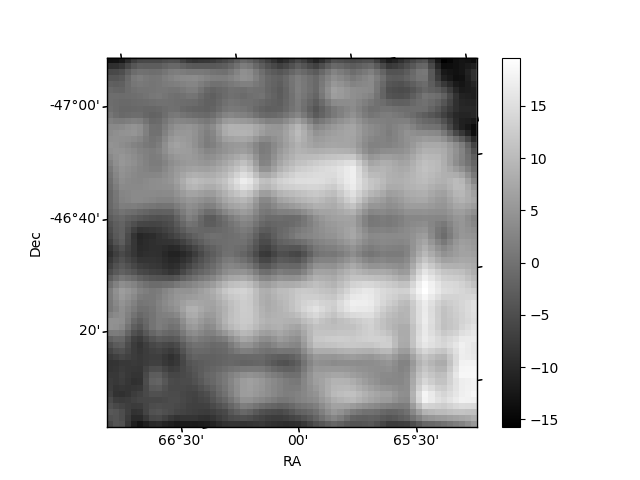
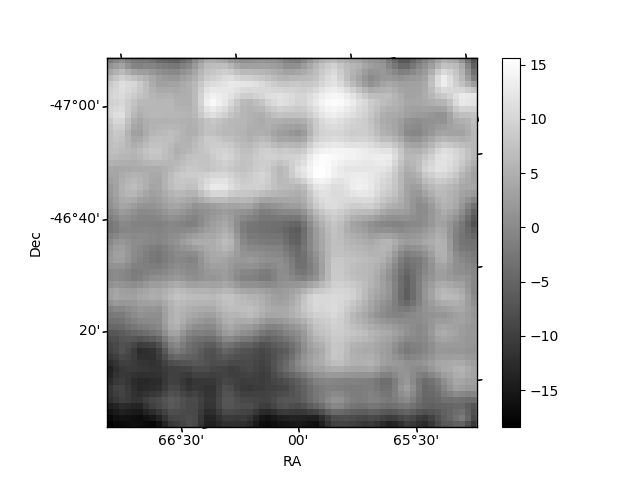
Histogram calculated using DETX and DETY for each event in the final _common_clean file
| Quadrant A | 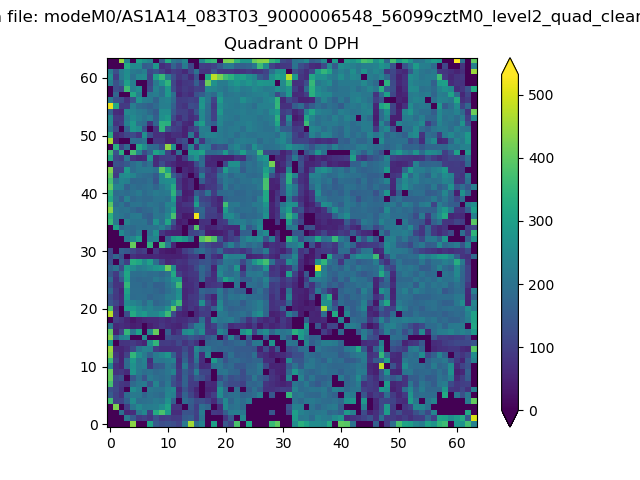 |
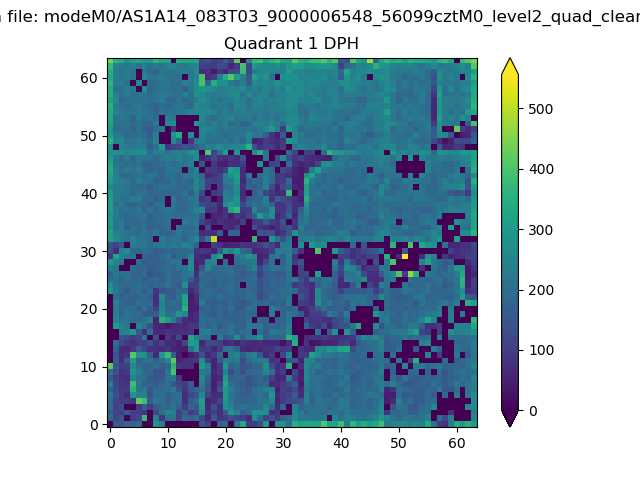 |
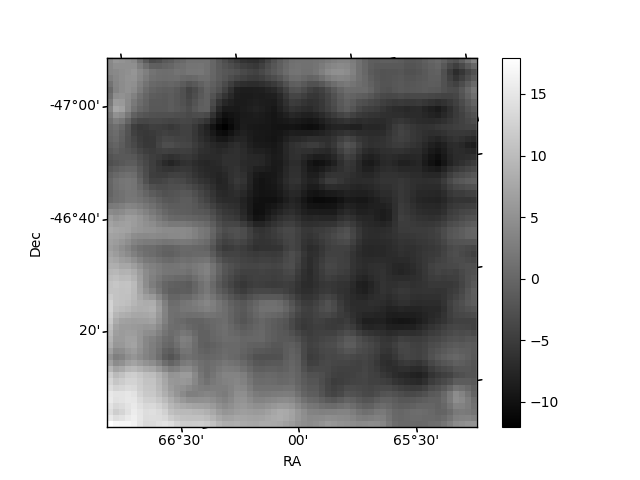
Quadrant B |
|---|---|---|---|
| Quadrant D | 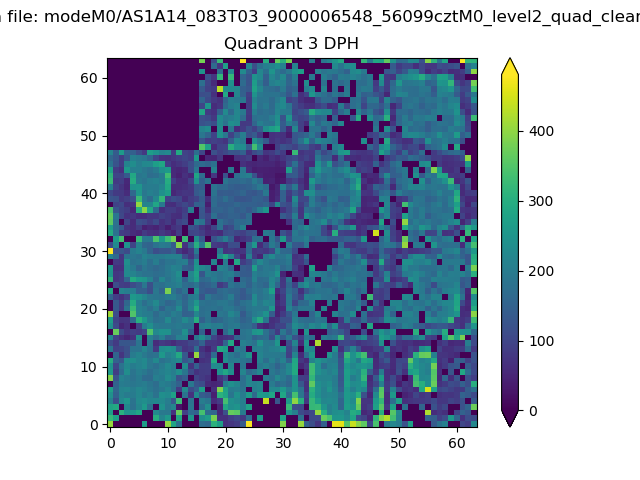 |
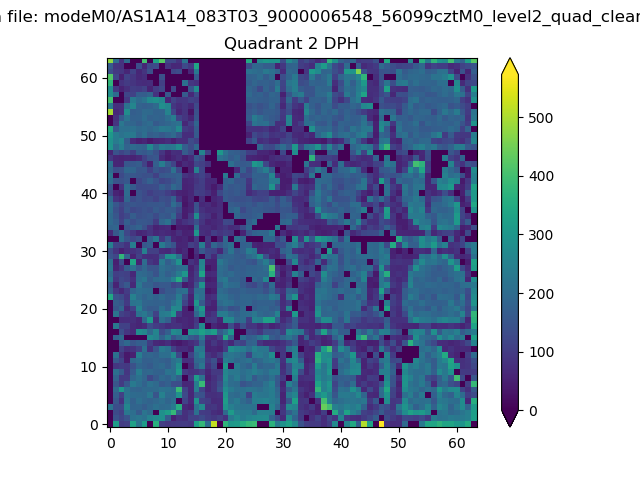 |
Quadrant C |
| Plot type | Count rate plots | Images |
|---|---|---|
| Comparison with Poisson distribution Blue bars denote a histogram of data divided into 1 sec bins. Red curve is a Poisson curve with rate = median count rate of data. |
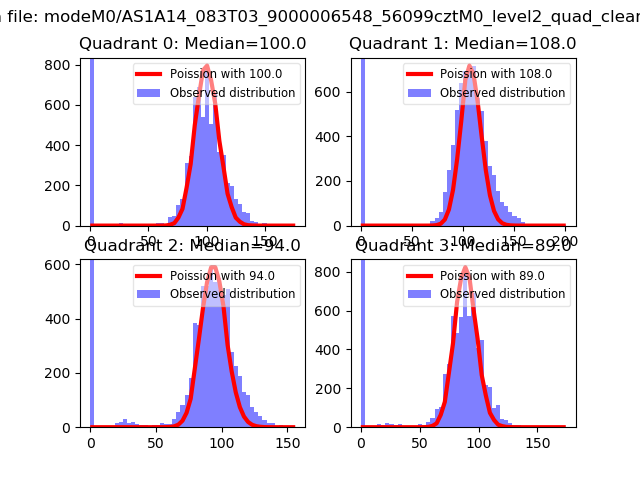 |
 |
| Quadrant-wise count rates Data is divided into 100 sec bins |
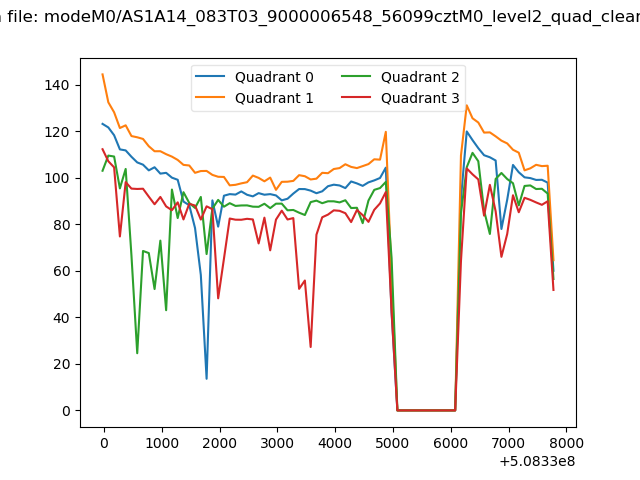 |
|
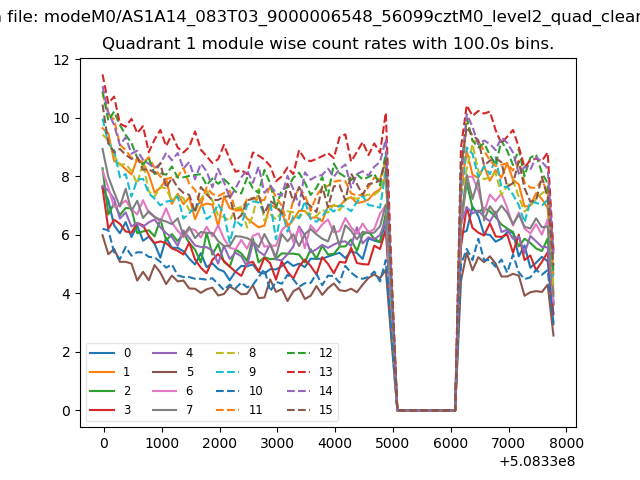
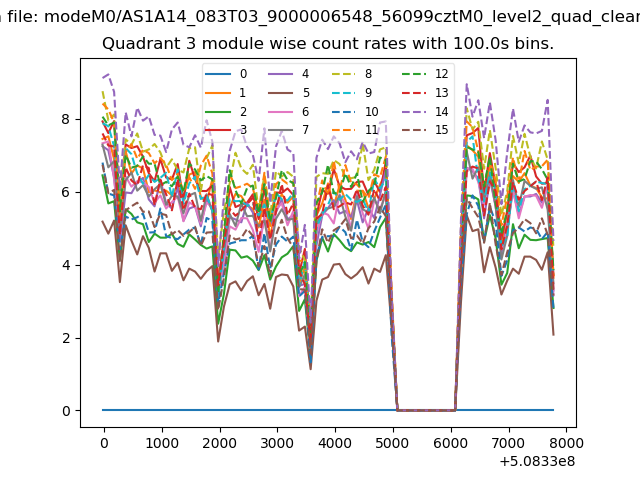
| Module-wise count rates for Quadrant A Data is divided into 100 sec bins |
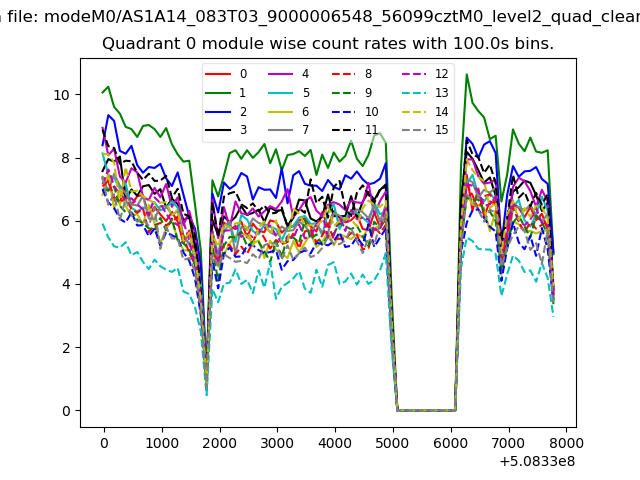 |
 |
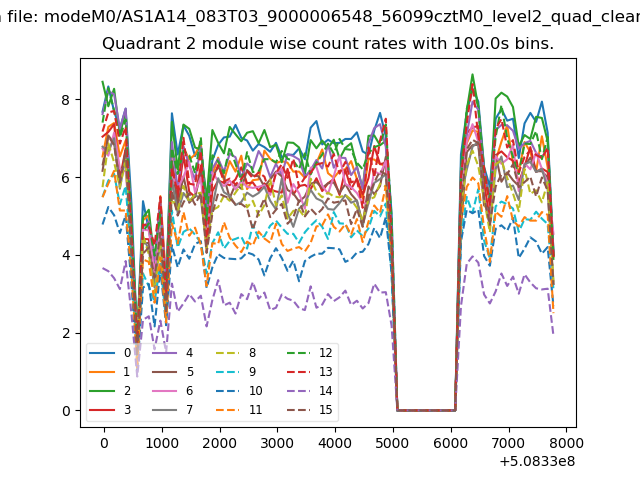
| Module-wise count rates for Quadrant B Data is divided into 100 sec bins |
 |
 |
| Module-wise count rates for Quadrant C Data is divided into 100 sec bins |
 |
 |
| Module-wise count rates for Quadrant D Data is divided into 100 sec bins |
 |
 |
| Parameter | Plot |
|---|---|
| CZT HV Monitor | 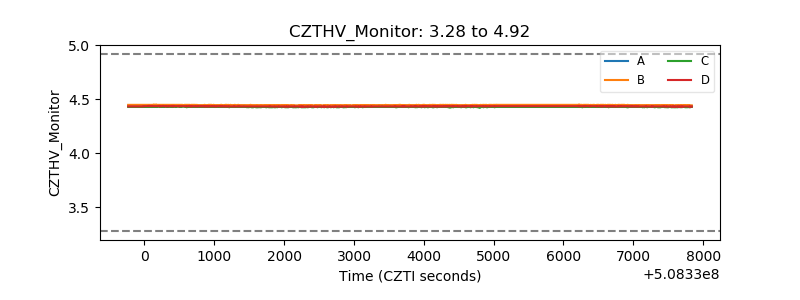 |
| D_VDD | 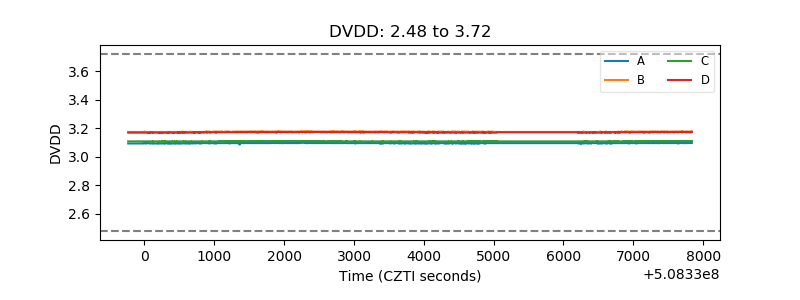 |
| Temperature 1 | 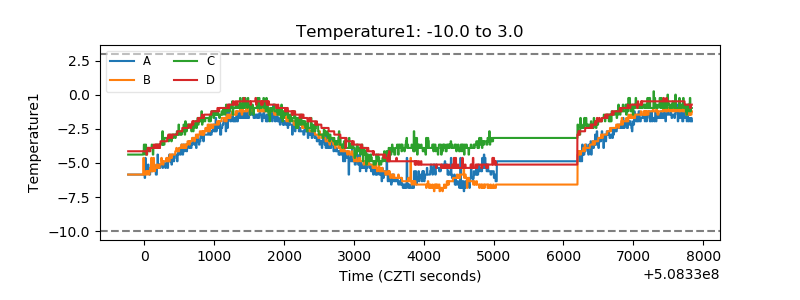 |
| Veto HV Monitor | 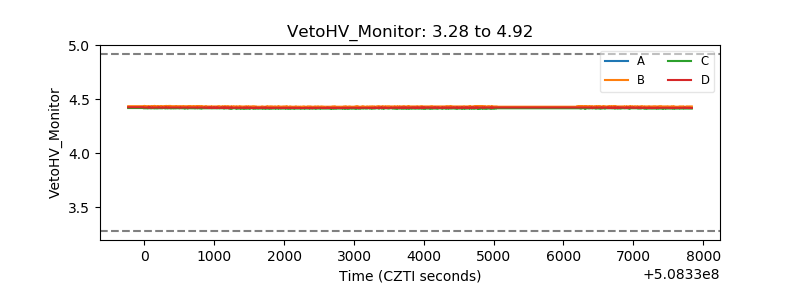 |
| Veto LLD | 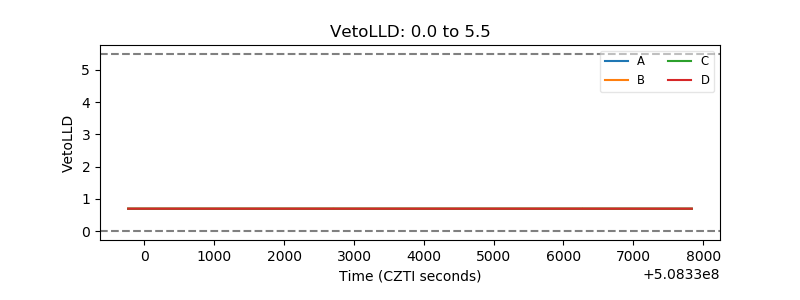 |
| Alpha Counter | 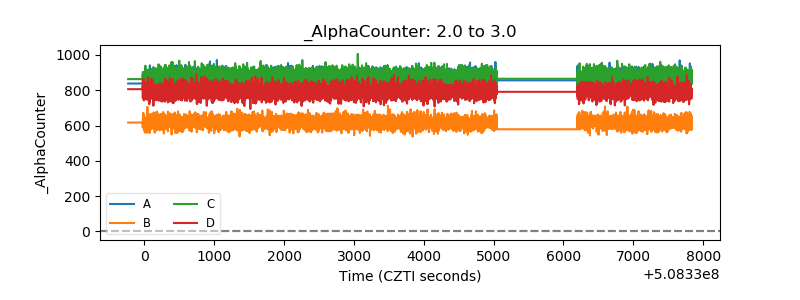 |
| _CPM_Rate | 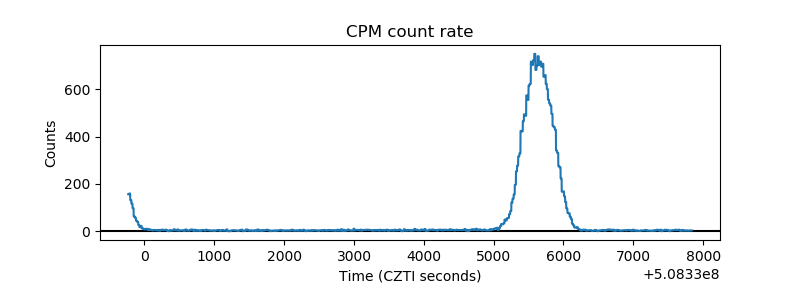 |
| CZT Counter | 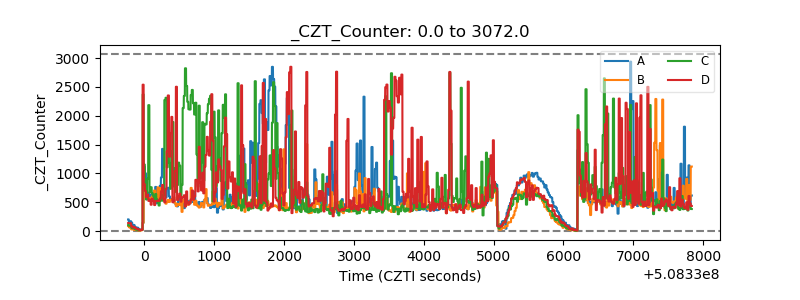 |
| +2.5 Volts monitor |  |
| +5 Volts monitor | 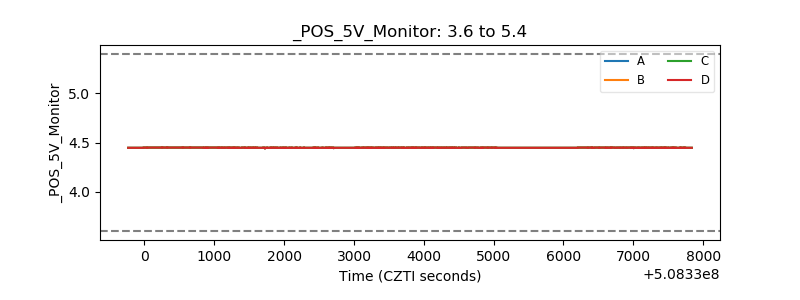 |
| _ROLL_ROT | 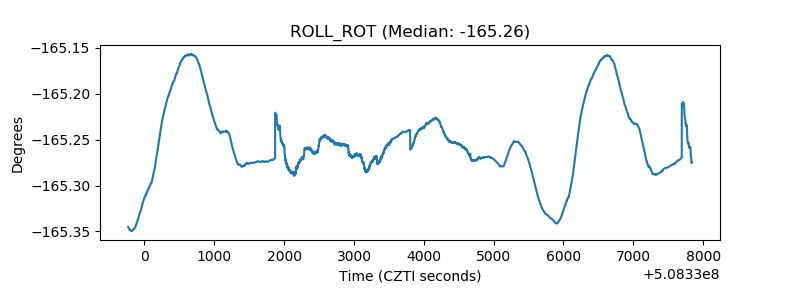 |
| _Roll_DEC | 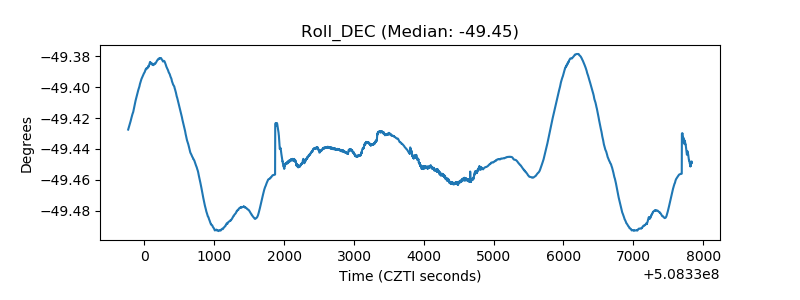 |
| _Roll_RA | 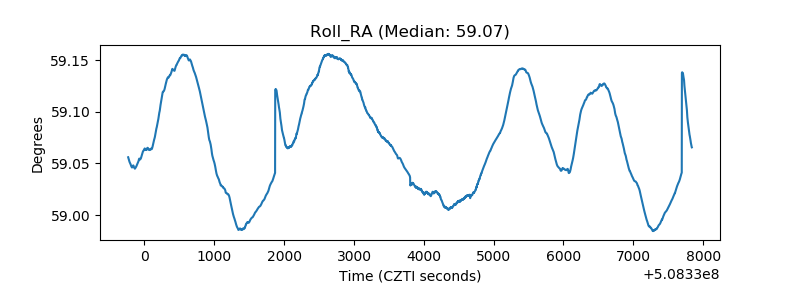 |
| Veto Counter | 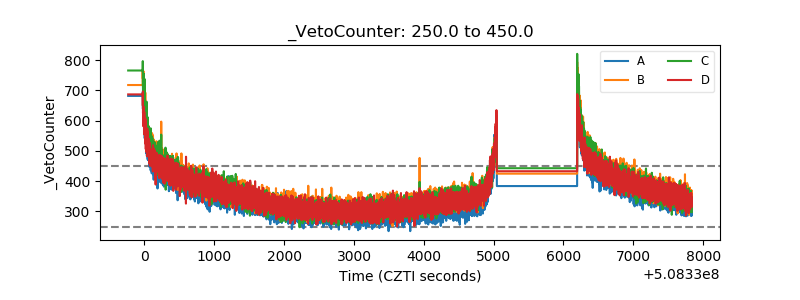 |