| Param | Original file | Final file |
|---|---|---|
| Filename | modeM0/AS1A14_083T03_9000006548_56100cztM0_level2.fits | modeM0/AS1A14_083T03_9000006548_56100cztM0_level2_quad_clean.evt |
| Size (bytes) | 452,194,560 | 91,025,280 |
| Size | 431.2 MB | 86.8 MB |
| Events in quadrant A | 5,400,991 | 538,833 |
| Events in quadrant B | 3,316,398 | 662,960 |
| Events in quadrant C | 4,096,484 | 574,822 |
| Events in quadrant D | 3,437,568 | 542,188 |
| Mode M0 | |||
|---|---|---|---|
| Quadrant | BADHDUFLAG | Total packets | Discarded packets |
| A | 0 | 20520 | 3 |
| B | 0 | 14146 | 1 |
| C | 0 | 16691 | 1 |
| D | 0 | 14782 | 1 |
| Mode SS | |||
|---|---|---|---|
| Quadrant | BADHDUFLAG | Total packets | Discarded packets |
| A | 0 | 128 | 0 |
| B | 0 | 128 | 0 |
| C | 0 | 128 | 0 |
| D | 0 | 128 | 0 |
| Mode M9 | |||
|---|---|---|---|
| Quadrant | BADHDUFLAG | Total packets | Discarded packets |
| A | 0 | 11 | 0 |
| B | 0 | 11 | 0 |
| C | 0 | 11 | 0 |
| D | 0 | 11 | 0 |
| Quadrant | Total seconds | Saturated seconds | Saturation percentage |
|---|---|---|---|
| A | 6262 | 961 | 15.346535% |
| B | 6262 | 123 | 1.964229% |
| C | 6263 | 249 | 3.975730% |
| D | 6263 | 192 | 3.065624% |
Noise dominated data is calculated using 1-second bins in cleaned event files. If a bin has >2000 counts, and if more than 50% of those come from <1% of pixels, then it is considered to be noise-dominated and hence unusable.
| Quadrant | # 1 sec bins | Bins with >0 counts | Bins with >2000 counts | High rate bins dominated by noise | Noise dominated (total time) | Noise dominated (detector-on time) | Marked lightcurve |
|---|---|---|---|---|---|---|---|
| A | 7402 | 6262 | 756 | 756 | 10.21% | 12.07% | 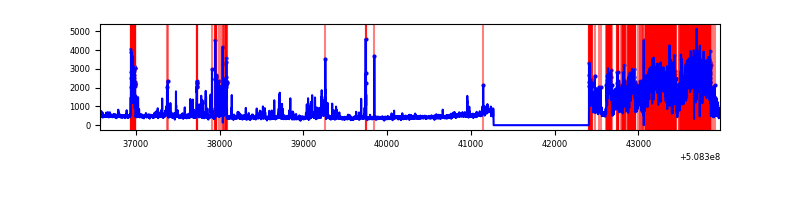 |
| B | 7402 | 6263 | 38 | 38 | 0.51% | 0.61% | 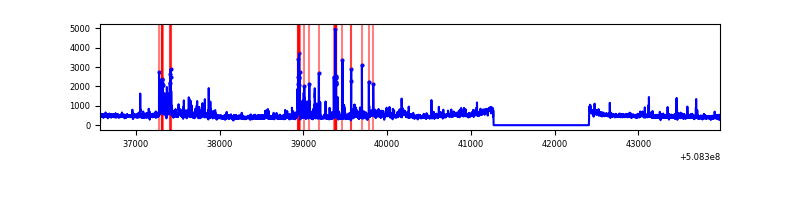 |
| C | 7403 | 6264 | 178 | 178 | 2.40% | 2.84% | 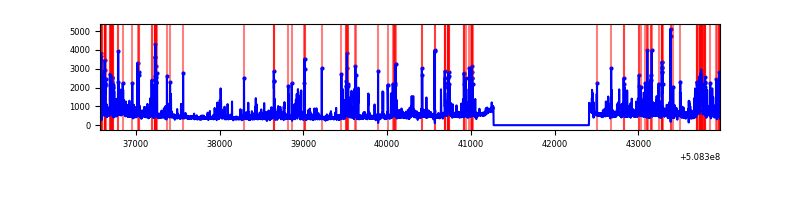 |
| D | 7403 | 6264 | 145 | 145 | 1.96% | 2.31% | 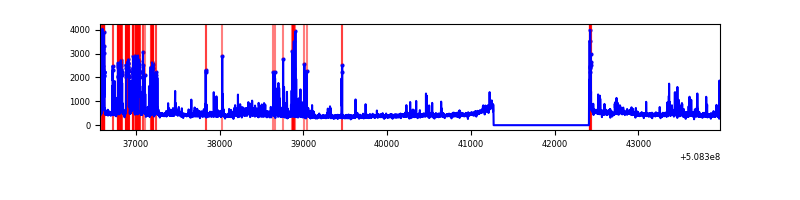 |
Top three noisy pixels from each quadrant. If the there are fewer than three noisy pixels in the level2.evt file, extra rows are filled as -1
| Pixel properties | Quadrant properties | ||||||
|---|---|---|---|---|---|---|---|
| Quadrant | DetID | PixID | Counts | Sigma | Mean | Median | Sigma |
| A | 12 | 115 | 1602565 | 10061.79 | 637 | 620 | 159.2 |
| A | 15 | 32 | 746595 | 4685.46 | 637 | 620 | 159.2 |
| A | 3 | 14 | 444179 | 2785.99 | 637 | 620 | 159.2 |
| B | 4 | 21 | 117891 | 826.57 | 672 | 648 | 141.8 |
| B | 7 | 252 | 117672 | 825.03 | 672 | 648 | 141.8 |
| B | 5 | 185 | 98258 | 688.16 | 672 | 648 | 141.8 |
| C | 12 | 254 | 1111391 | 6273.52 | 641 | 634 | 177.1 |
| C | 12 | 252 | 225739 | 1271.39 | 641 | 634 | 177.1 |
| C | 9 | 38 | 139004 | 781.51 | 641 | 634 | 177.1 |
| D | 8 | 129 | 331992 | 1773.7 | 648 | 616 | 186.8 |
| D | 8 | 240 | 232146 | 1239.27 | 648 | 616 | 186.8 |
| D | 14 | 52 | 97471 | 518.42 | 648 | 616 | 186.8 |
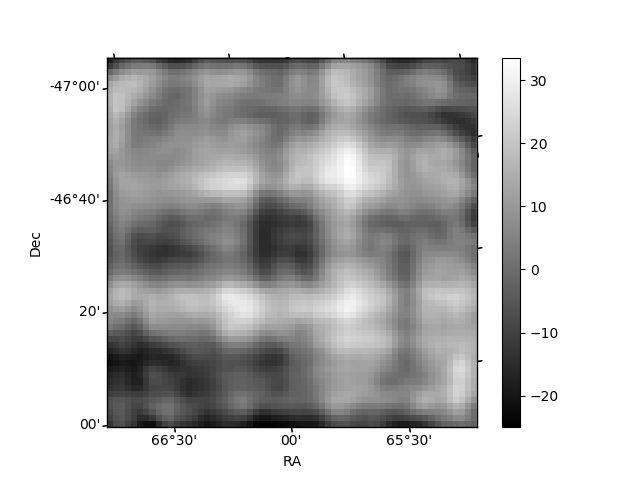
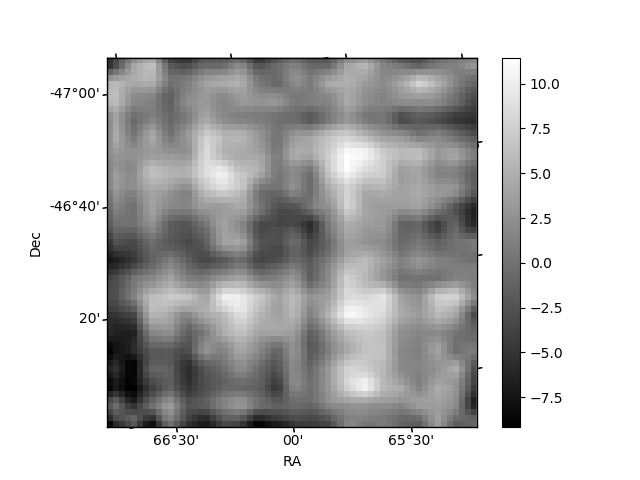
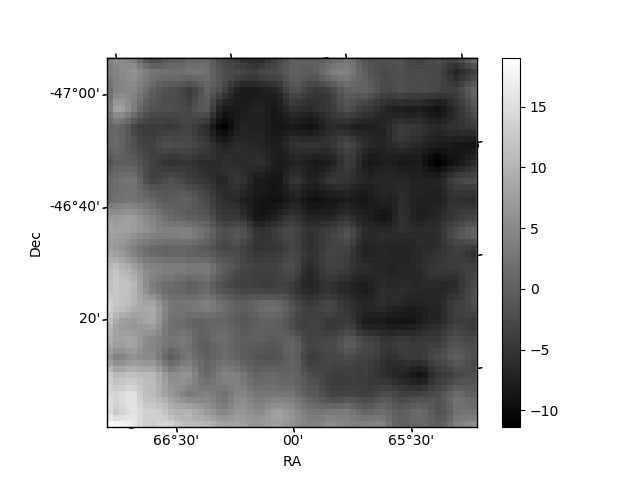
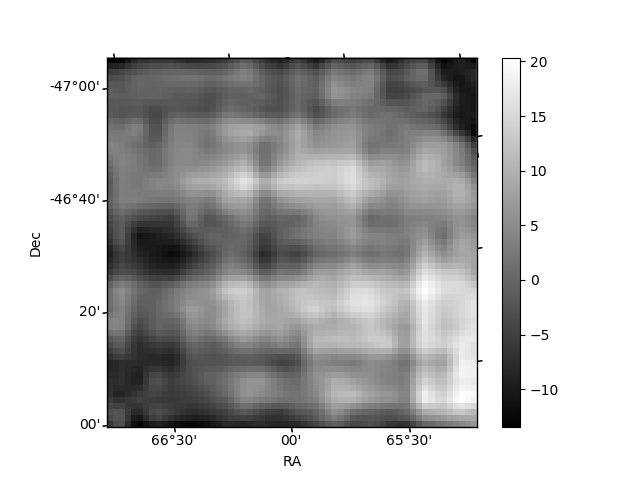
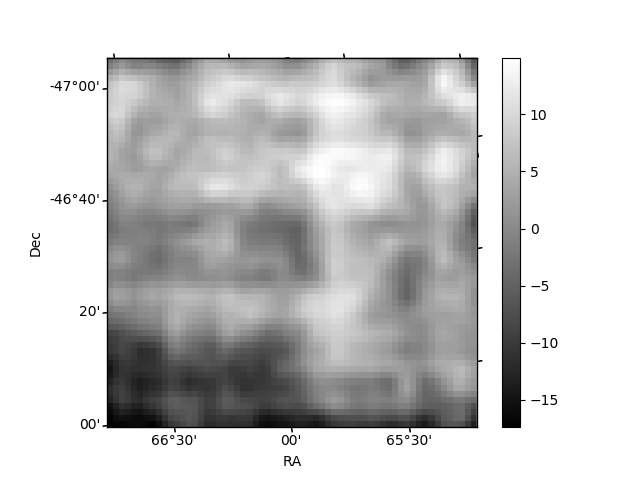
Histogram calculated using DETX and DETY for each event in the final _common_clean file
| Quadrant A | 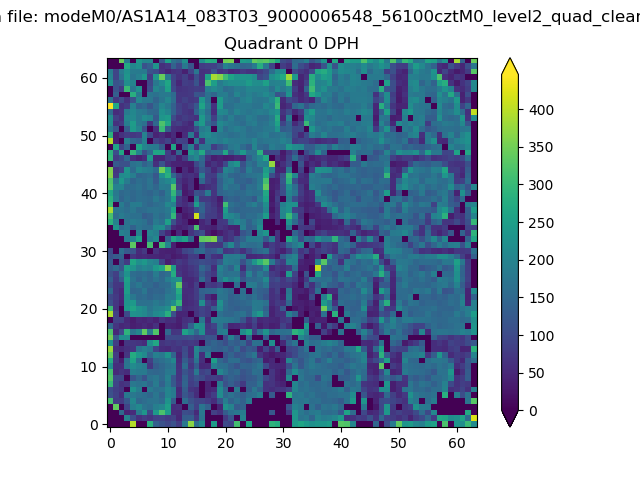 |
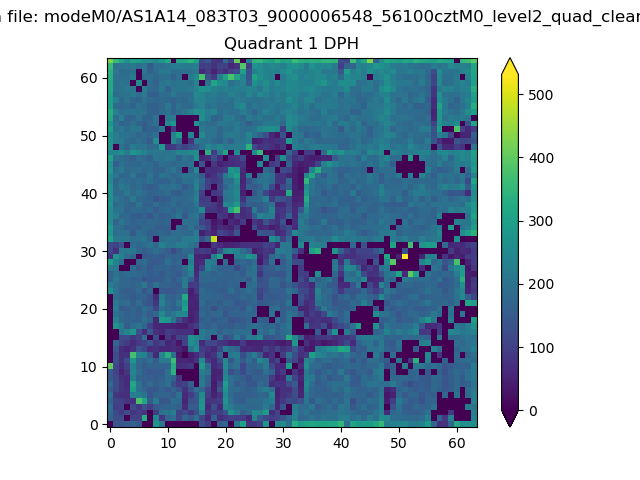 |
Quadrant B |
|---|---|---|---|
| Quadrant D | 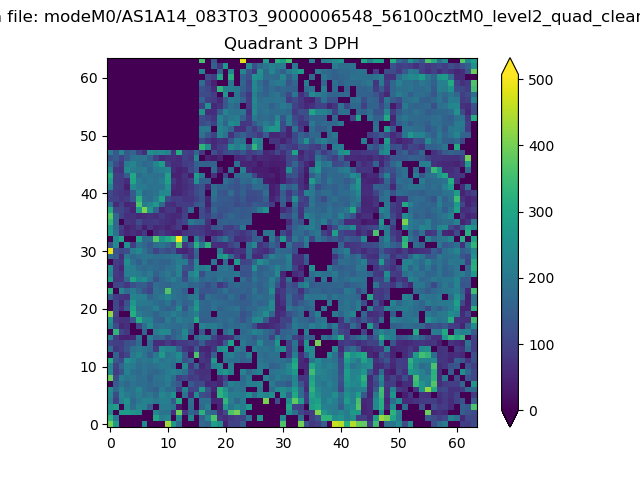 |
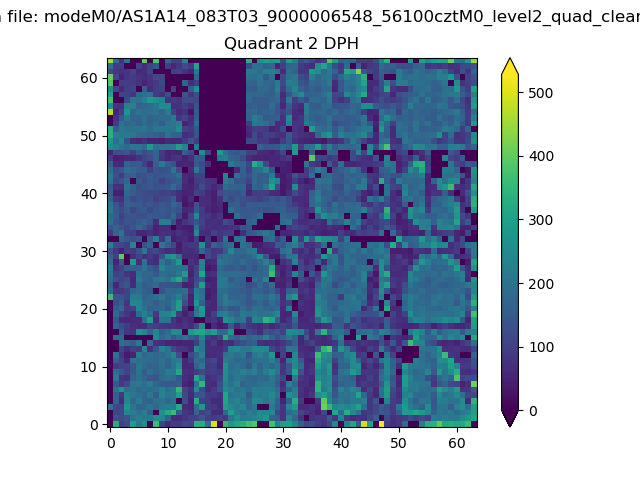 |
Quadrant C |
| Plot type | Count rate plots | Images |
|---|---|---|
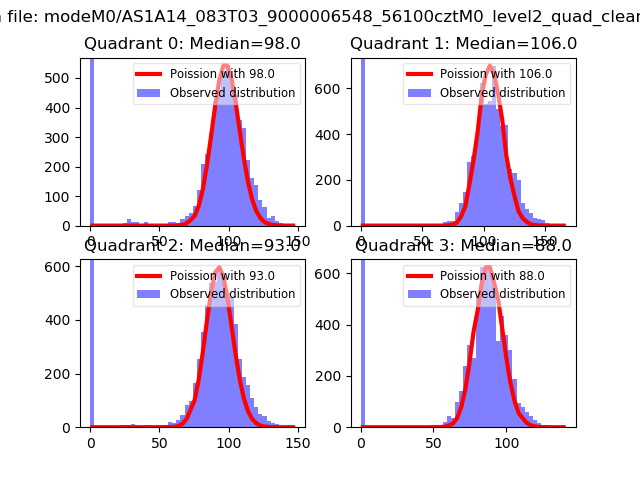
| Comparison with Poisson distribution Blue bars denote a histogram of data divided into 1 sec bins. Red curve is a Poisson curve with rate = median count rate of data. |
 |
 |
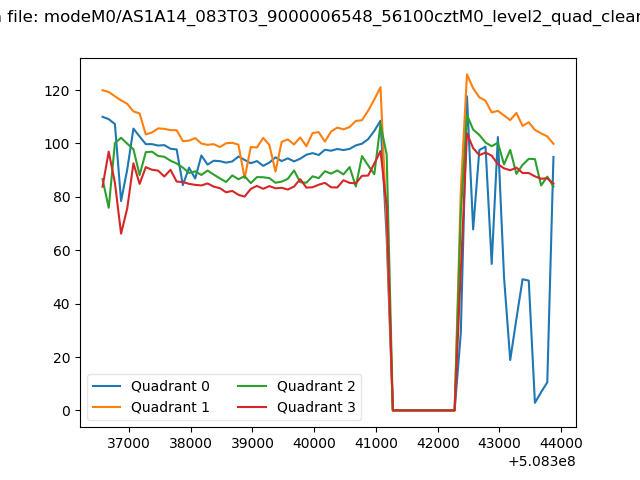
| Quadrant-wise count rates Data is divided into 100 sec bins |
 |
|
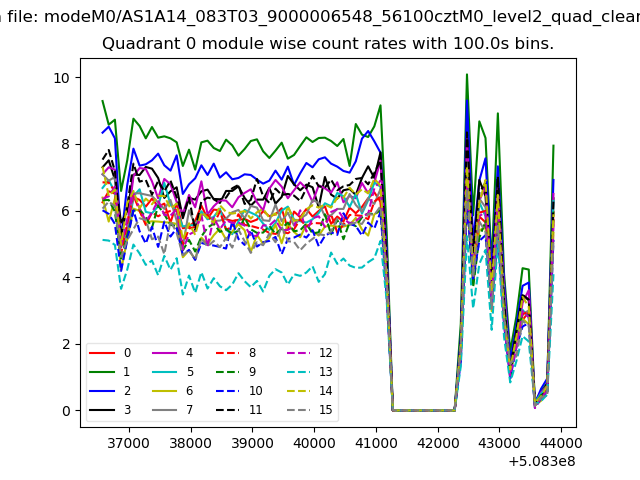
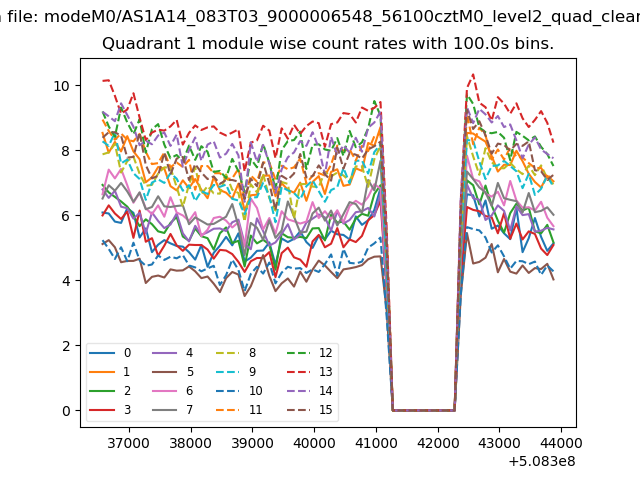
| Module-wise count rates for Quadrant A Data is divided into 100 sec bins |
 |
 |
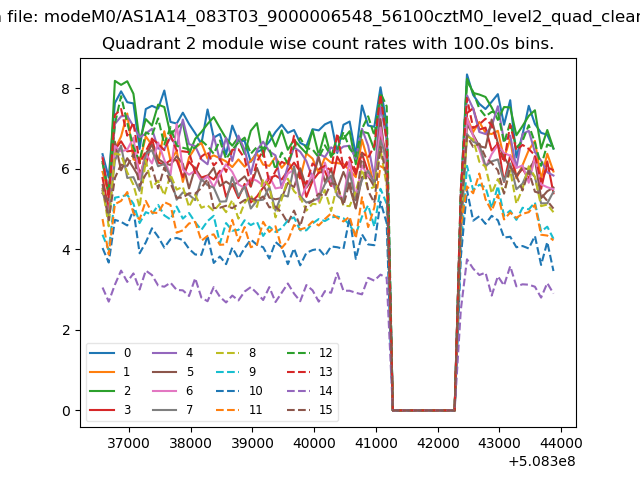
| Module-wise count rates for Quadrant B Data is divided into 100 sec bins |
 |
 |
| Module-wise count rates for Quadrant C Data is divided into 100 sec bins |
 |
 |
| Module-wise count rates for Quadrant D Data is divided into 100 sec bins |
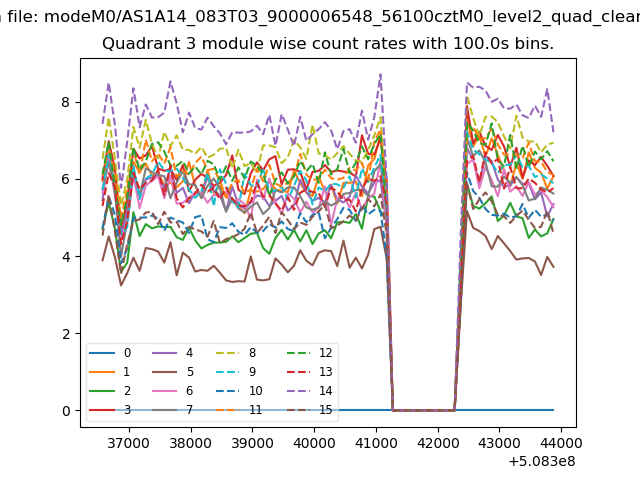 |
 |
| Parameter | Plot |
|---|---|
| CZT HV Monitor |  |
| D_VDD | 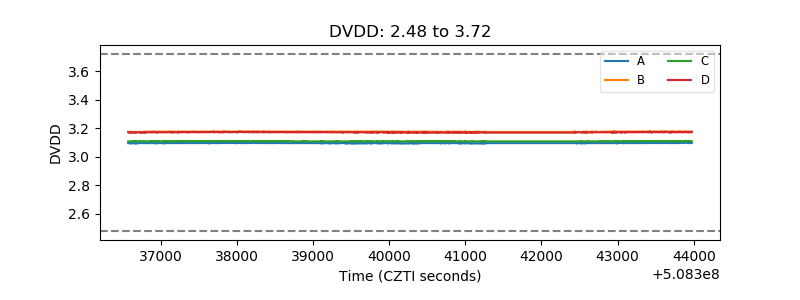 |
| Temperature 1 | 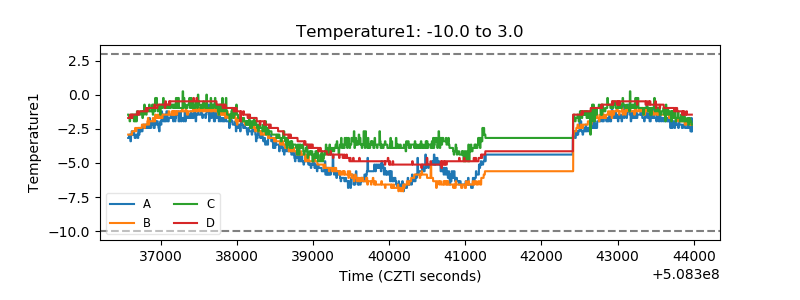 |
| Veto HV Monitor | 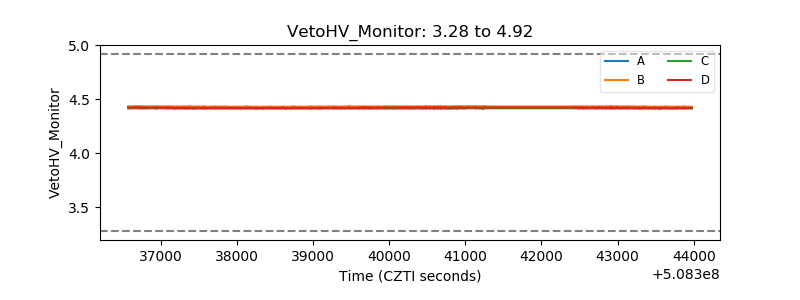 |
| Veto LLD | 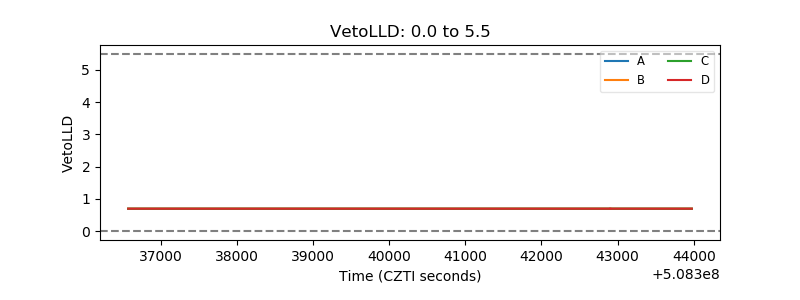 |
| Alpha Counter | 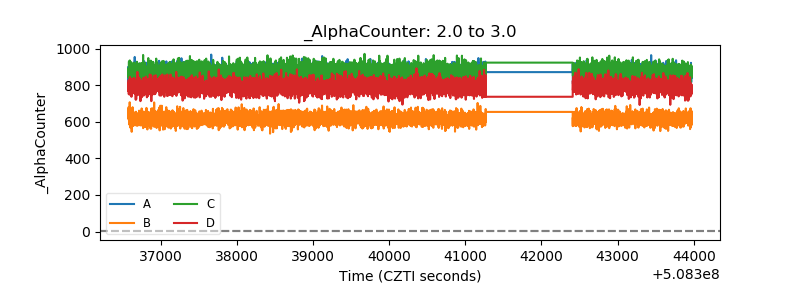 |
| _CPM_Rate | 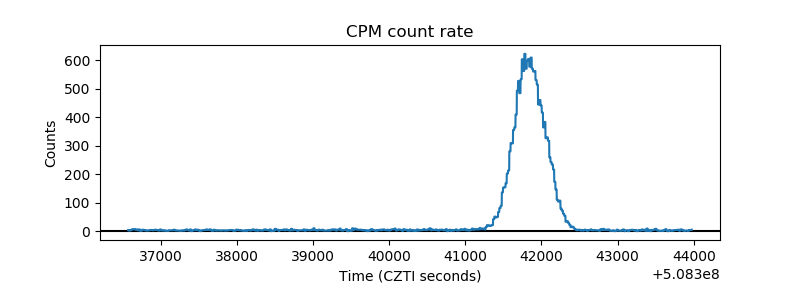 |
| CZT Counter | 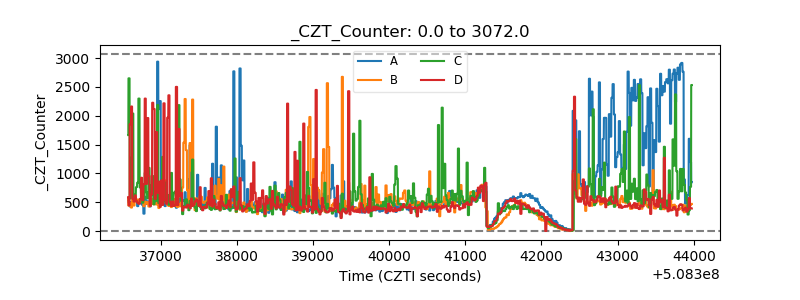 |
| +2.5 Volts monitor | 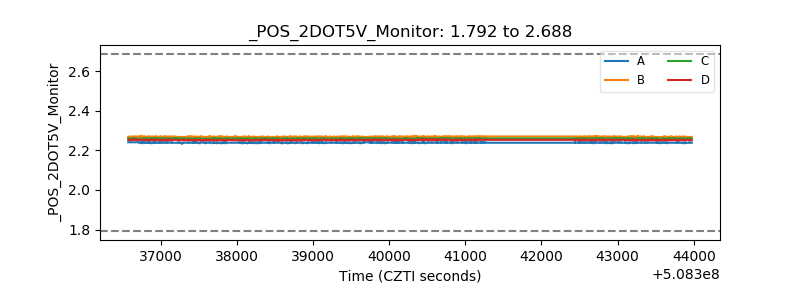 |
| +5 Volts monitor | 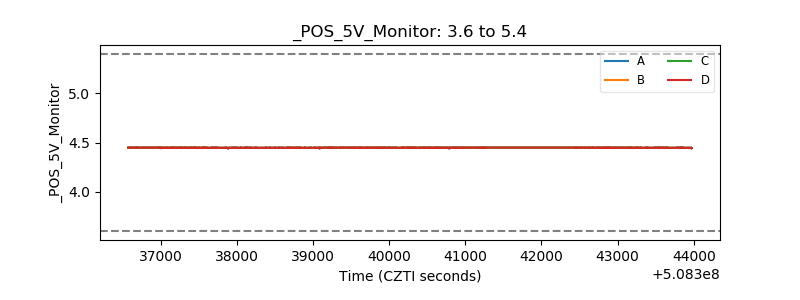 |
| _ROLL_ROT | 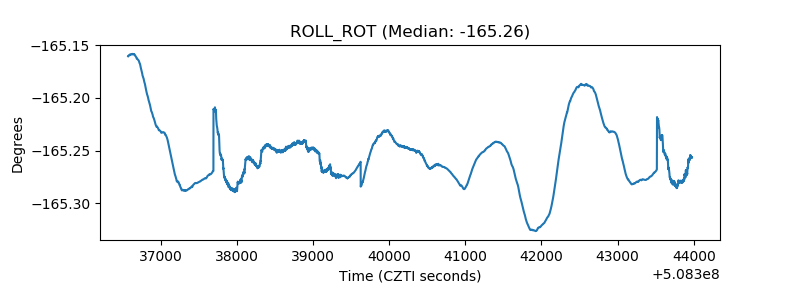 |
| _Roll_DEC | 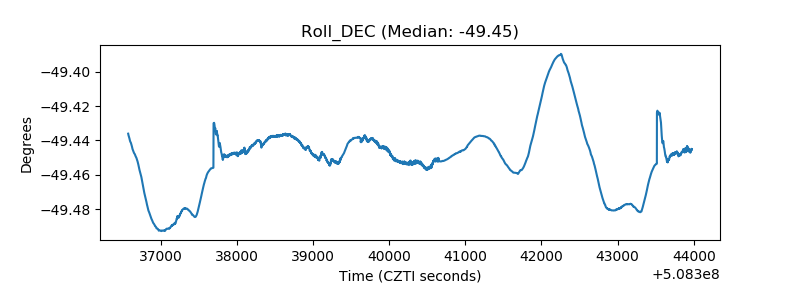 |
| _Roll_RA | 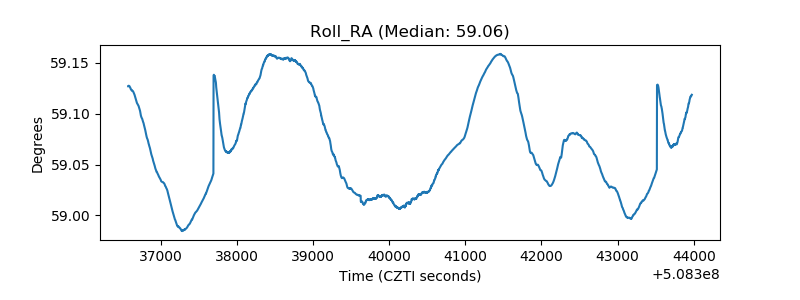 |
| Veto Counter | 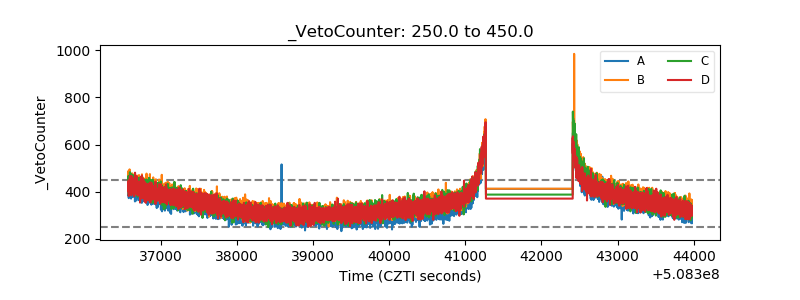 |