| Param | Original file | Final file |
|---|---|---|
| Filename | modeM0/AS1A14_083T03_9000006548_56101cztM0_level2.fits | modeM0/AS1A14_083T03_9000006548_56101cztM0_level2_quad_clean.evt |
| Size (bytes) | 569,243,520 | 90,956,160 |
| Size | 542.9 MB | 86.7 MB |
| Events in quadrant A | 6,979,898 | 533,203 |
| Events in quadrant B | 3,529,296 | 673,195 |
| Events in quadrant C | 6,678,662 | 538,704 |
| Events in quadrant D | 3,379,042 | 555,236 |
| Mode M0 | |||
|---|---|---|---|
| Quadrant | BADHDUFLAG | Total packets | Discarded packets |
| A | 0 | 25215 | 1 |
| B | 0 | 15155 | 3 |
| C | 0 | 24392 | 1 |
| D | 0 | 14998 | 1 |
| Mode SS | |||
|---|---|---|---|
| Quadrant | BADHDUFLAG | Total packets | Discarded packets |
| A | 0 | 132 | 0 |
| B | 0 | 132 | 0 |
| C | 0 | 132 | 0 |
| D | 0 | 132 | 0 |
| Mode M9 | |||
|---|---|---|---|
| Quadrant | BADHDUFLAG | Total packets | Discarded packets |
| A | 0 | 10 | 0 |
| B | 0 | 10 | 0 |
| C | 0 | 10 | 0 |
| D | 0 | 10 | 0 |
| Quadrant | Total seconds | Saturated seconds | Saturation percentage |
|---|---|---|---|
| A | 6502 | 1188 | 18.271301% |
| B | 6502 | 147 | 2.260843% |
| C | 6502 | 897 | 13.795755% |
| D | 6502 | 140 | 2.153184% |
Noise dominated data is calculated using 1-second bins in cleaned event files. If a bin has >2000 counts, and if more than 50% of those come from <1% of pixels, then it is considered to be noise-dominated and hence unusable.
| Quadrant | # 1 sec bins | Bins with >0 counts | Bins with >2000 counts | High rate bins dominated by noise | Noise dominated (total time) | Noise dominated (detector-on time) | Marked lightcurve |
|---|---|---|---|---|---|---|---|
| A | 7542 | 6502 | 992 | 992 | 13.15% | 15.26% | 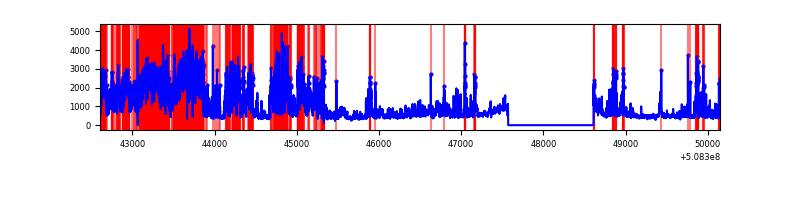 |
| B | 7542 | 6503 | 32 | 32 | 0.42% | 0.49% | 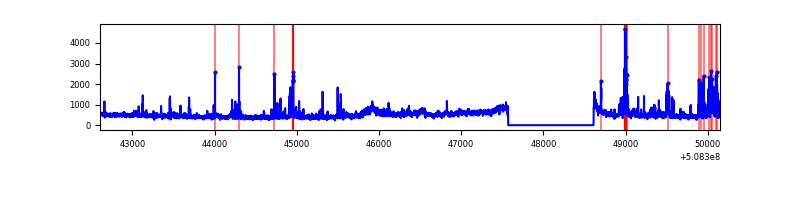 |
| C | 7542 | 6503 | 746 | 746 | 9.89% | 11.47% | 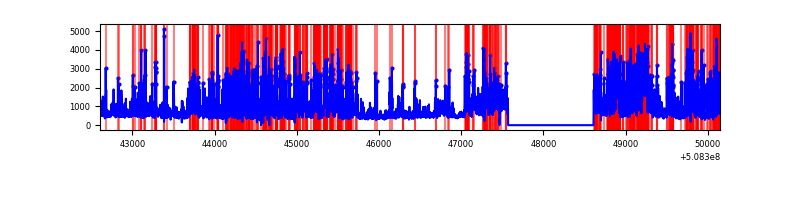 |
| D | 7542 | 6503 | 71 | 71 | 0.94% | 1.09% | 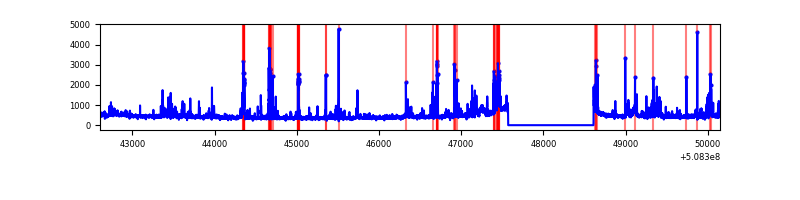 |
Top three noisy pixels from each quadrant. If the there are fewer than three noisy pixels in the level2.evt file, extra rows are filled as -1
| Pixel properties | Quadrant properties | ||||||
|---|---|---|---|---|---|---|---|
| Quadrant | DetID | PixID | Counts | Sigma | Mean | Median | Sigma |
| A | 12 | 115 | 2326414 | 14296.45 | 651 | 635 | 162.7 |
| A | 15 | 32 | 945247 | 5806.49 | 651 | 635 | 162.7 |
| A | 3 | 14 | 943159 | 5793.65 | 651 | 635 | 162.7 |
| B | 9 | 254 | 293727 | 2005.57 | 691 | 668 | 146.1 |
| B | 10 | 247 | 241923 | 1651.04 | 691 | 668 | 146.1 |
| B | 5 | 185 | 72993 | 494.96 | 691 | 668 | 146.1 |
| C | 12 | 254 | 3620848 | 20666.59 | 637 | 630 | 175.2 |
| C | 12 | 252 | 284548 | 1620.79 | 637 | 630 | 175.2 |
| C | 9 | 38 | 133648 | 759.35 | 637 | 630 | 175.2 |
| D | 8 | 240 | 231170 | 1215.29 | 666 | 636 | 189.7 |
| D | 14 | 52 | 185229 | 973.11 | 666 | 636 | 189.7 |
| D | 2 | 249 | 92178 | 482.58 | 666 | 636 | 189.7 |
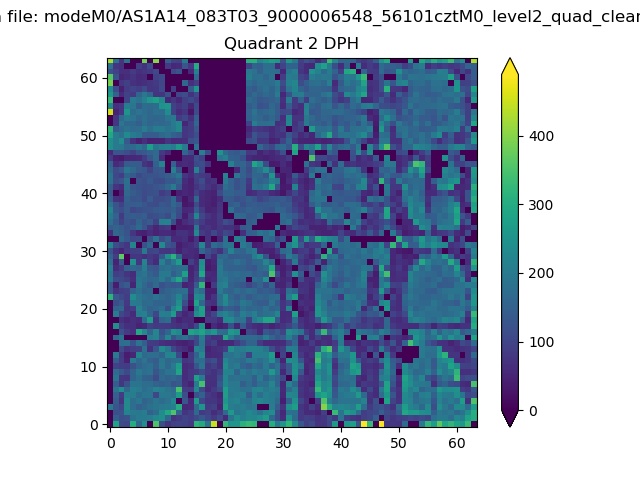
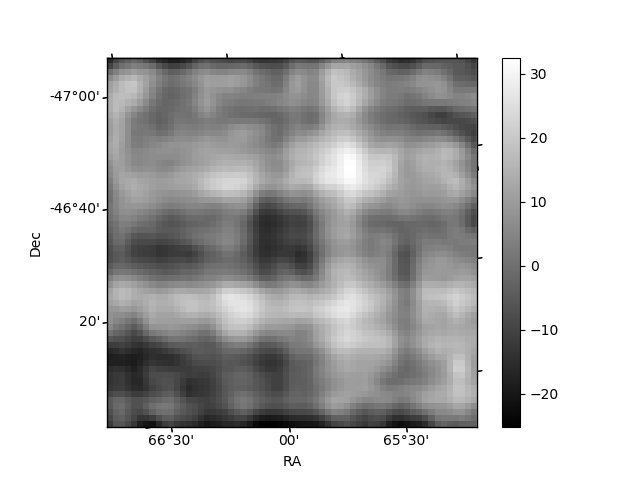
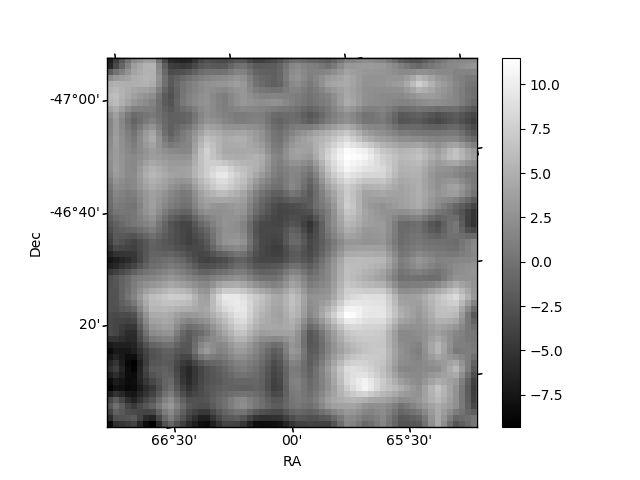
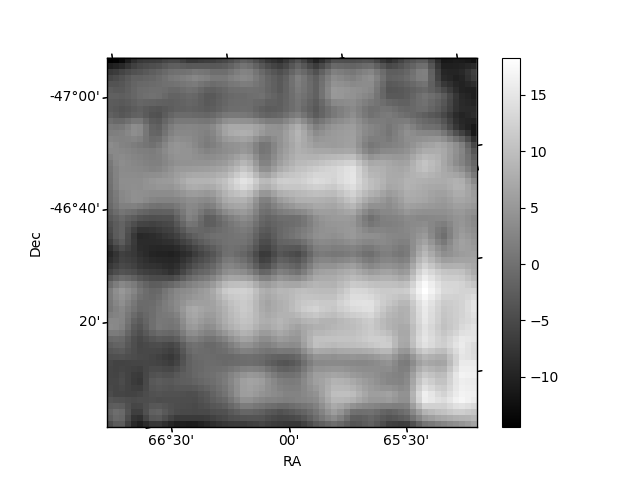
Histogram calculated using DETX and DETY for each event in the final _common_clean file
| Quadrant A | 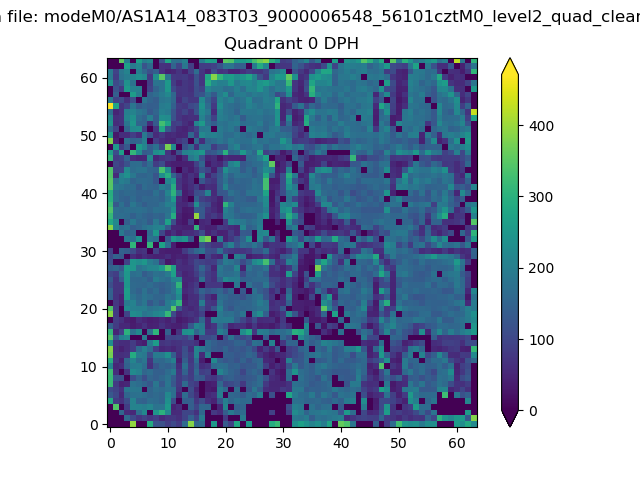 |
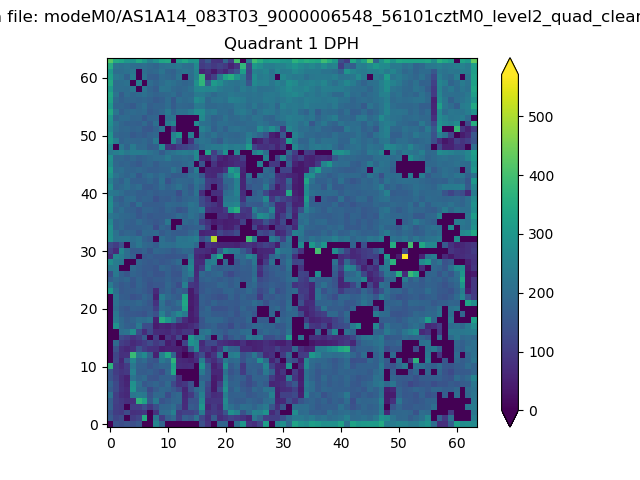 |
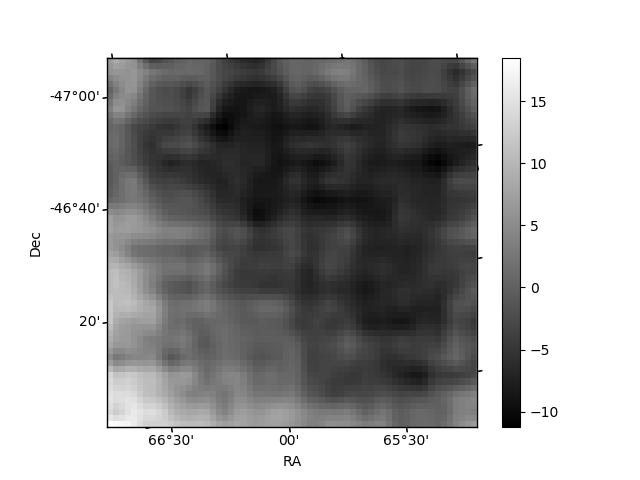
Quadrant B |
|---|---|---|---|
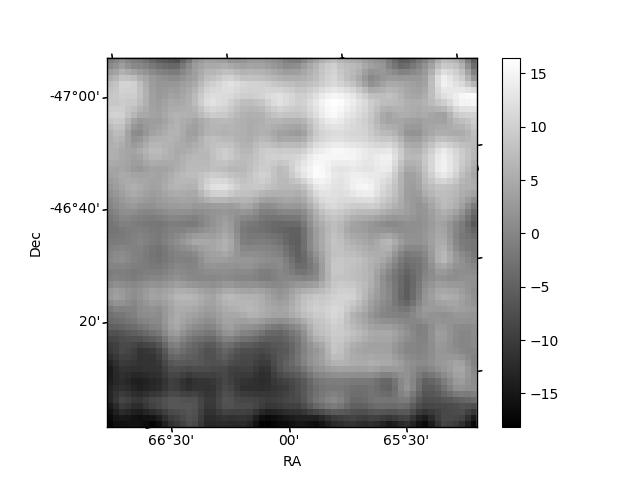
| Quadrant D | 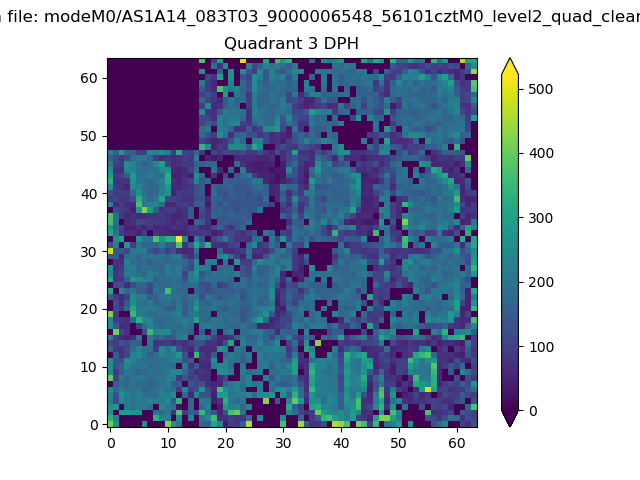 |
 |
Quadrant C |
| Plot type | Count rate plots | Images |
|---|---|---|
| Comparison with Poisson distribution Blue bars denote a histogram of data divided into 1 sec bins. Red curve is a Poisson curve with rate = median count rate of data. |
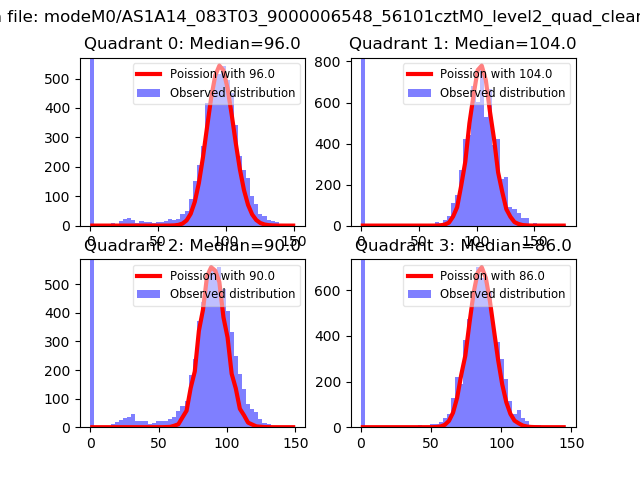 |
 |
| Quadrant-wise count rates Data is divided into 100 sec bins |
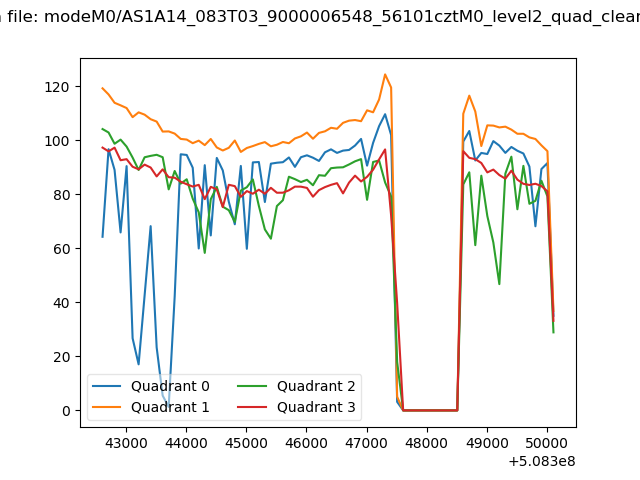 |
|
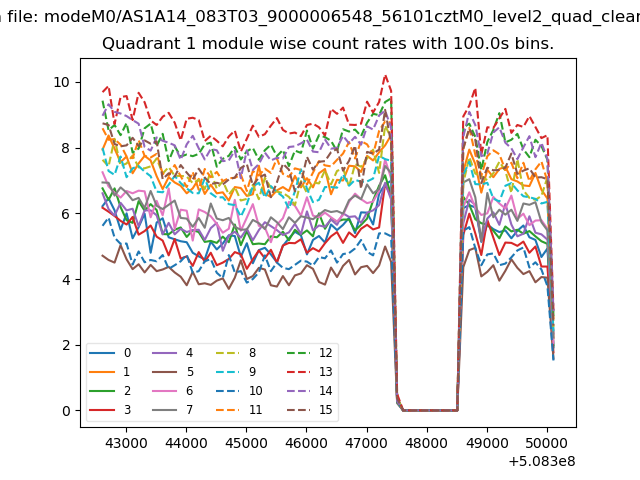
| Module-wise count rates for Quadrant A Data is divided into 100 sec bins |
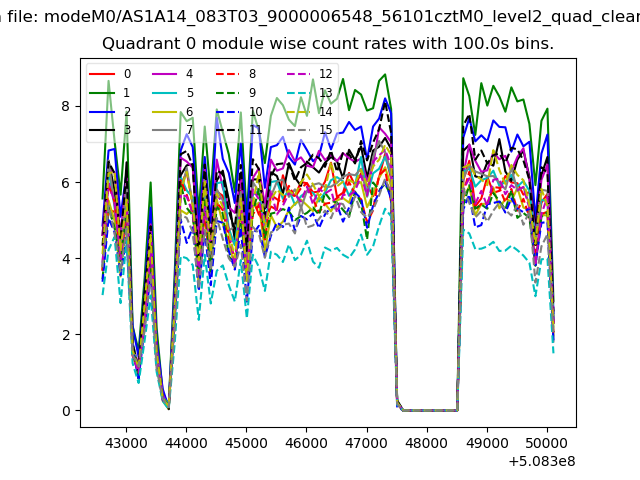 |
 |
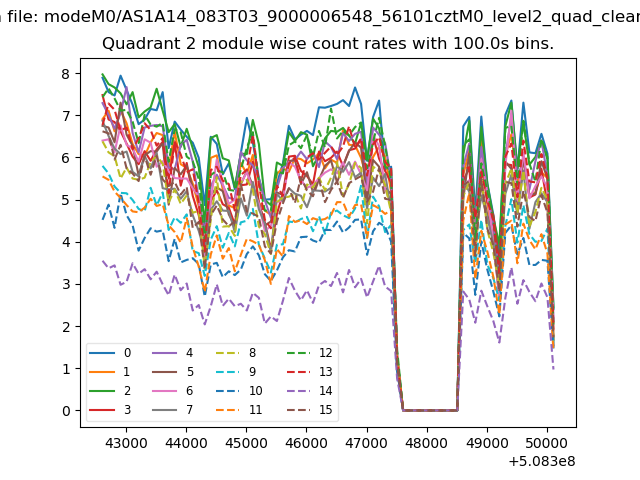
| Module-wise count rates for Quadrant B Data is divided into 100 sec bins |
 |
 |
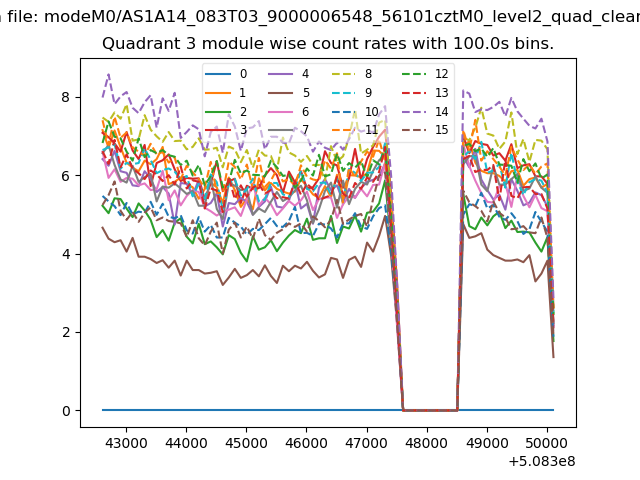
| Module-wise count rates for Quadrant C Data is divided into 100 sec bins |
 |
 |
| Module-wise count rates for Quadrant D Data is divided into 100 sec bins |
 |
 |
| Parameter | Plot |
|---|---|
| CZT HV Monitor |  |
| D_VDD | 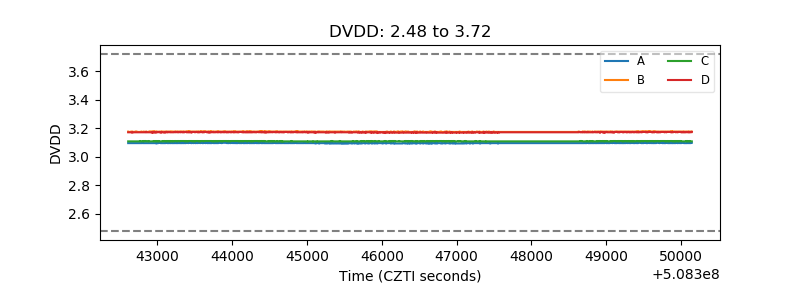 |
| Temperature 1 | 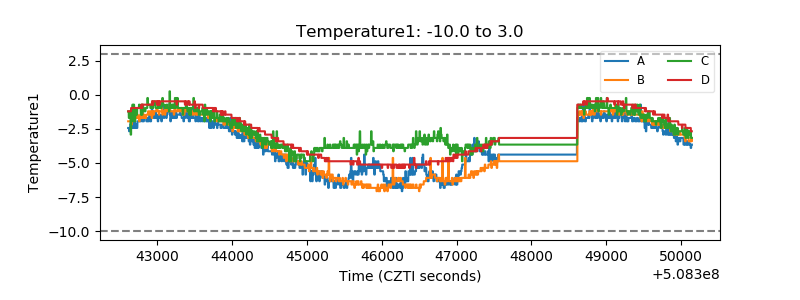 |
| Veto HV Monitor | 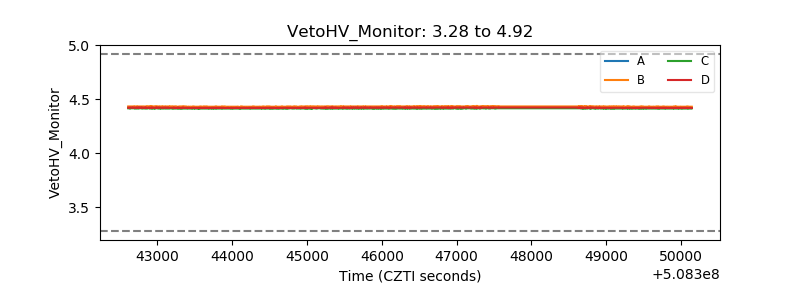 |
| Veto LLD | 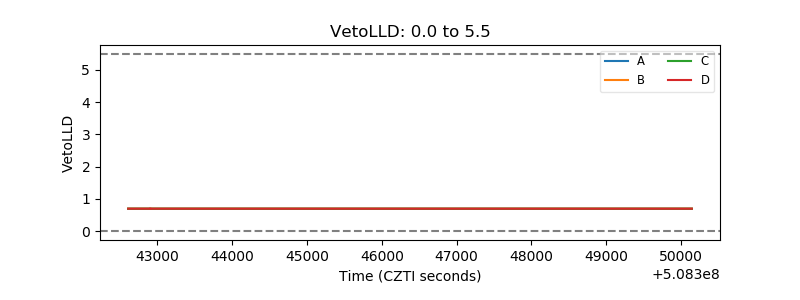 |
| Alpha Counter | 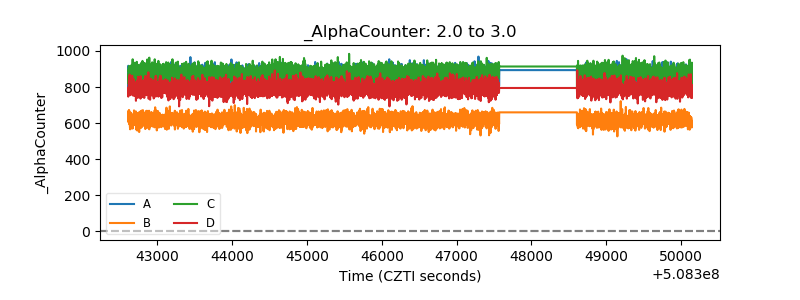 |
| _CPM_Rate | 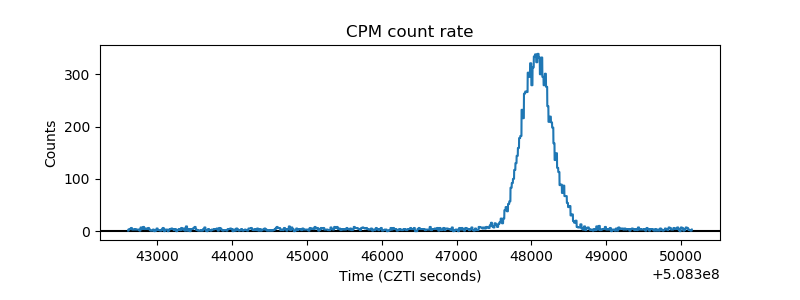 |
| CZT Counter | 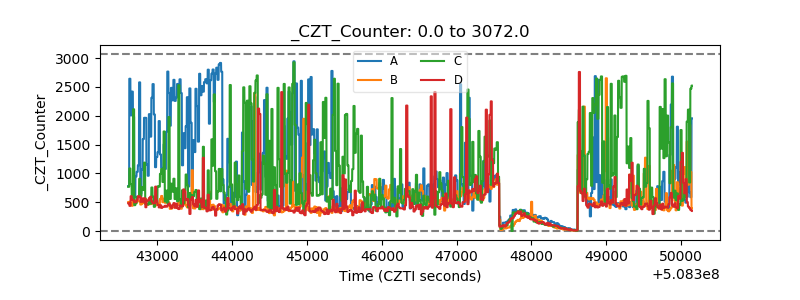 |
| +2.5 Volts monitor |  |
| +5 Volts monitor | 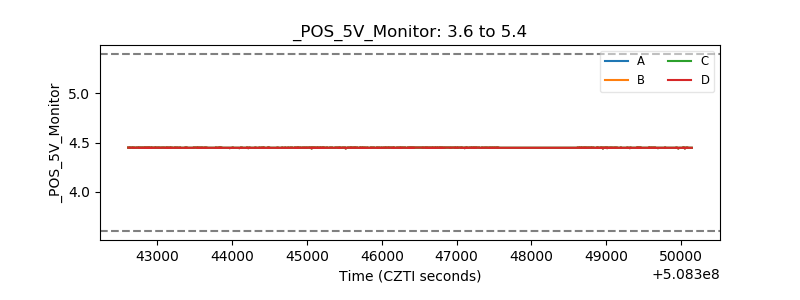 |
| _ROLL_ROT | 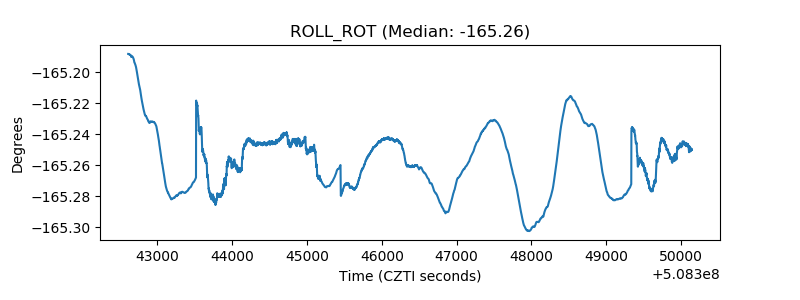 |
| _Roll_DEC | 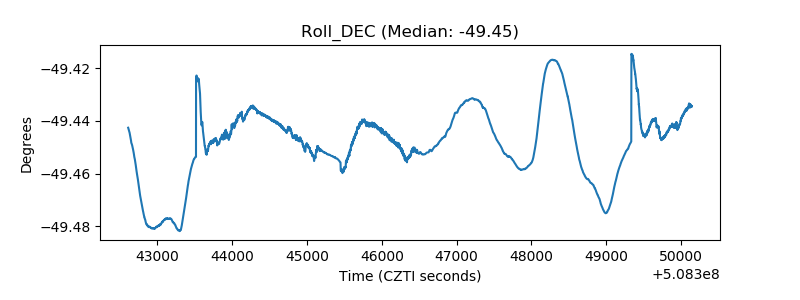 |
| _Roll_RA | 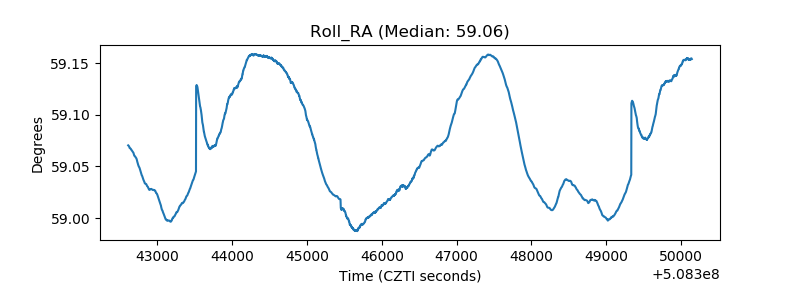 |
| Veto Counter | 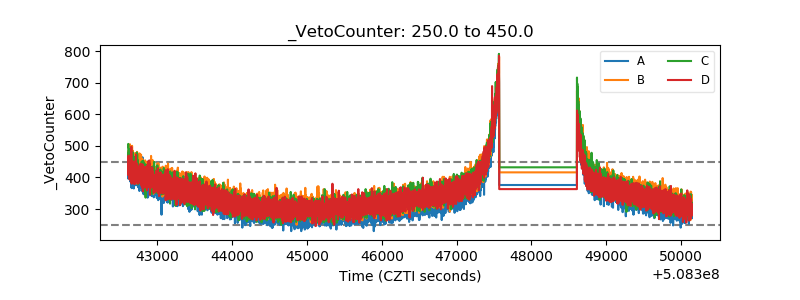 |