| Param | Original file | Final file |
|---|---|---|
| Filename | modeM0/AS1A14_083T03_9000006548_56103cztM0_level2.fits | modeM0/AS1A14_083T03_9000006548_56103cztM0_level2_quad_clean.evt |
| Size (bytes) | 525,836,160 | 98,951,040 |
| Size | 501.5 MB | 94.4 MB |
| Events in quadrant A | 6,621,551 | 600,284 |
| Events in quadrant B | 3,475,900 | 716,551 |
| Events in quadrant C | 5,003,177 | 599,759 |
| Events in quadrant D | 3,809,634 | 582,837 |
| Mode M0 | |||
|---|---|---|---|
| Quadrant | BADHDUFLAG | Total packets | Discarded packets |
| A | 0 | 24450 | 1 |
| B | 0 | 15297 | 1 |
| C | 0 | 19973 | 2 |
| D | 0 | 16845 | 1 |
| Mode SS | |||
|---|---|---|---|
| Quadrant | BADHDUFLAG | Total packets | Discarded packets |
| A | 0 | 144 | 0 |
| B | 0 | 144 | 0 |
| C | 0 | 144 | 0 |
| D | 0 | 144 | 0 |
| Mode M9 | |||
|---|---|---|---|
| Quadrant | BADHDUFLAG | Total packets | Discarded packets |
| A | 0 | 6 | 0 |
| B | 0 | 6 | 0 |
| C | 0 | 6 | 0 |
| D | 0 | 6 | 0 |
| Quadrant | Total seconds | Saturated seconds | Saturation percentage |
|---|---|---|---|
| A | 7139 | 758 | 10.617734% |
| B | 7139 | 56 | 0.784424% |
| C | 7139 | 475 | 6.653593% |
| D | 7139 | 162 | 2.269225% |
Noise dominated data is calculated using 1-second bins in cleaned event files. If a bin has >2000 counts, and if more than 50% of those come from <1% of pixels, then it is considered to be noise-dominated and hence unusable.
| Quadrant | # 1 sec bins | Bins with >0 counts | Bins with >2000 counts | High rate bins dominated by noise | Noise dominated (total time) | Noise dominated (detector-on time) | Marked lightcurve |
|---|---|---|---|---|---|---|---|
| A | 7634 | 7141 | 689 | 689 | 9.03% | 9.65% | 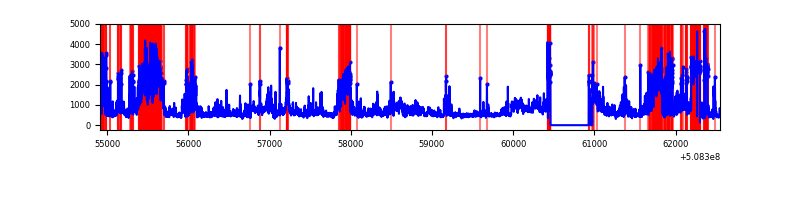 |
| B | 7634 | 7141 | 25 | 25 | 0.33% | 0.35% | 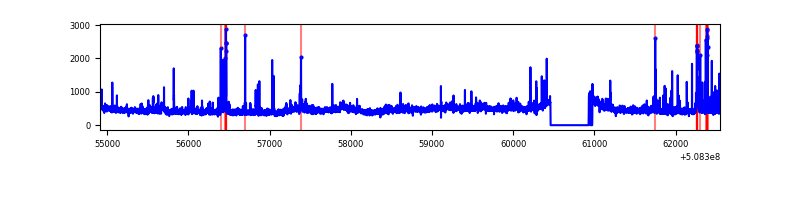 |
| C | 7633 | 7139 | 351 | 351 | 4.60% | 4.92% | 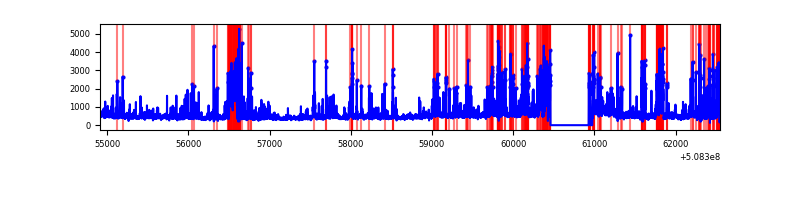 |
| D | 7634 | 7141 | 124 | 124 | 1.62% | 1.74% | 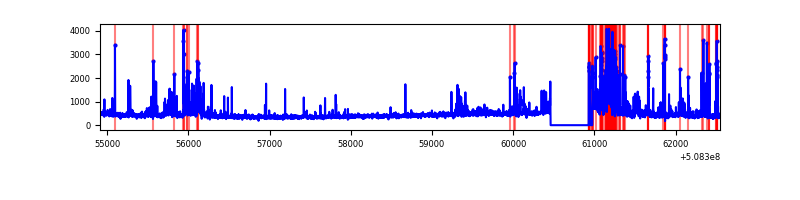 |
Top three noisy pixels from each quadrant. If the there are fewer than three noisy pixels in the level2.evt file, extra rows are filled as -1
| Pixel properties | Quadrant properties | ||||||
|---|---|---|---|---|---|---|---|
| Quadrant | DetID | PixID | Counts | Sigma | Mean | Median | Sigma |
| A | 12 | 115 | 1237765 | 7046.6 | 709 | 693 | 175.6 |
| A | 3 | 14 | 1196260 | 6810.18 | 709 | 693 | 175.6 |
| A | 15 | 32 | 821564 | 4675.84 | 709 | 693 | 175.6 |
| B | 9 | 254 | 148900 | 936.06 | 740 | 714 | 158.3 |
| B | 10 | 247 | 96546 | 605.35 | 740 | 714 | 158.3 |
| B | 7 | 252 | 90814 | 569.14 | 740 | 714 | 158.3 |
| C | 12 | 254 | 1282573 | 6754.94 | 695 | 687 | 189.8 |
| C | 12 | 252 | 251539 | 1321.87 | 695 | 687 | 189.8 |
| C | 15 | 230 | 242255 | 1272.95 | 695 | 687 | 189.8 |
| D | 2 | 120 | 388581 | 1933.38 | 705 | 673 | 200.6 |
| D | 14 | 52 | 152043 | 754.44 | 705 | 673 | 200.6 |
| D | 2 | 249 | 122822 | 608.8 | 705 | 673 | 200.6 |
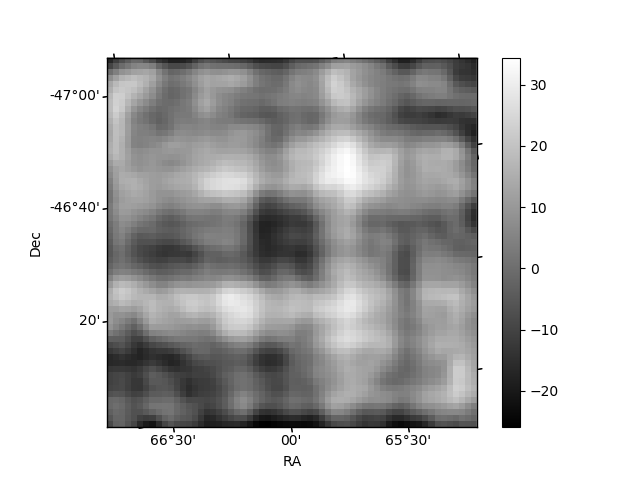
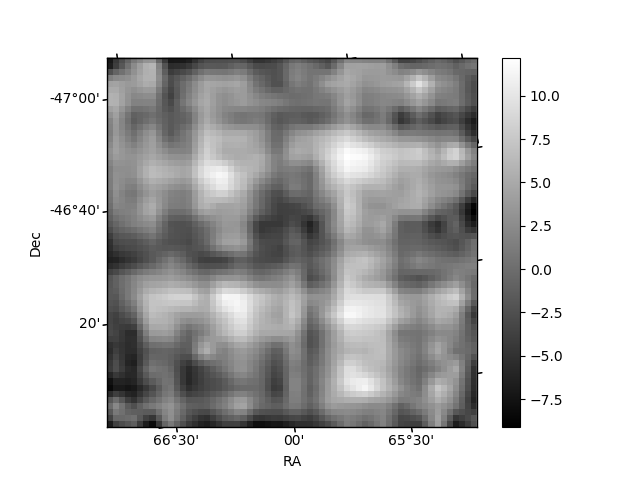
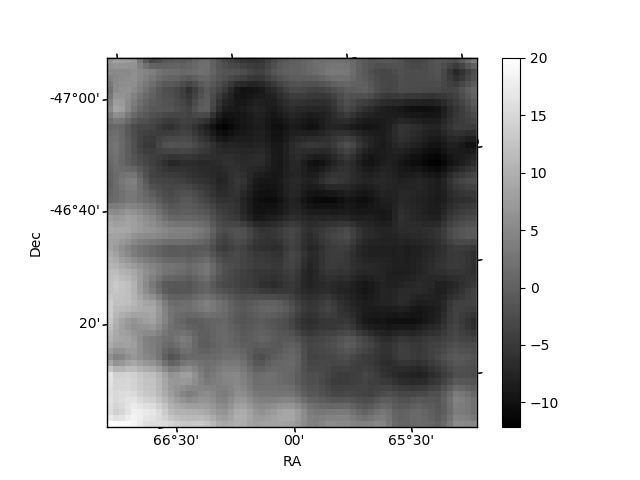
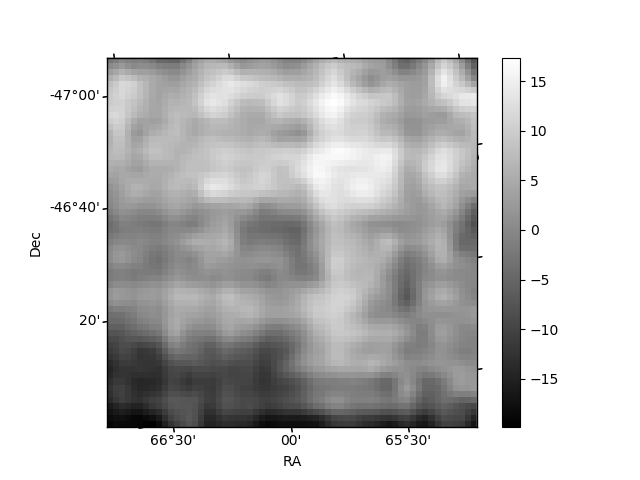
Histogram calculated using DETX and DETY for each event in the final _common_clean file
| Quadrant A | 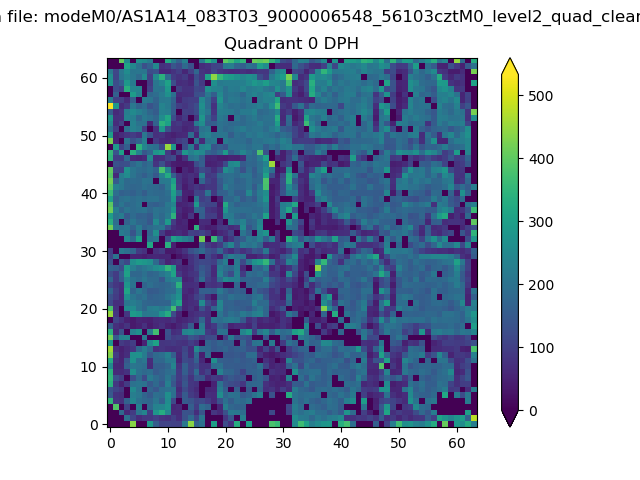 |
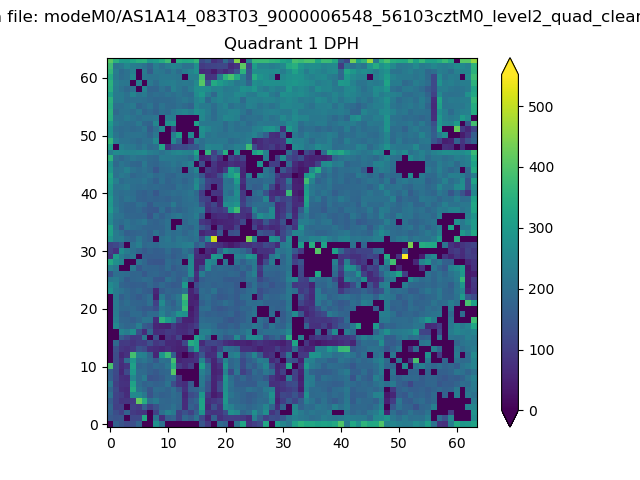 |
Quadrant B |
|---|---|---|---|
| Quadrant D | 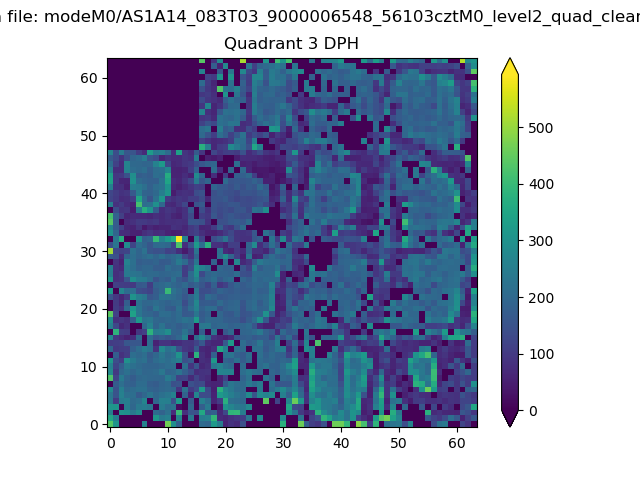 |
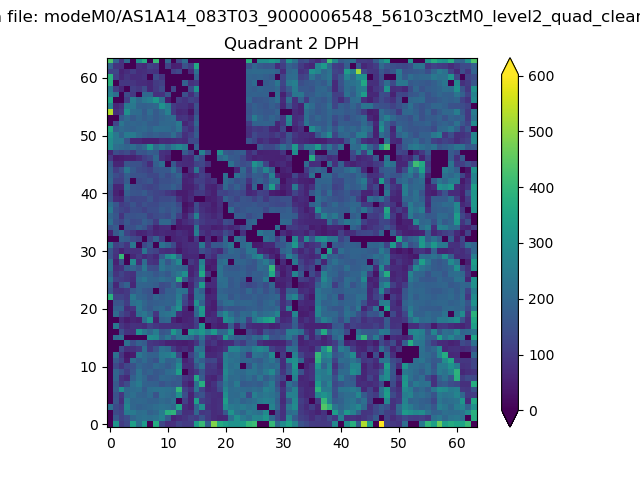 |
Quadrant C |
| Plot type | Count rate plots | Images |
|---|---|---|
| Comparison with Poisson distribution Blue bars denote a histogram of data divided into 1 sec bins. Red curve is a Poisson curve with rate = median count rate of data. |
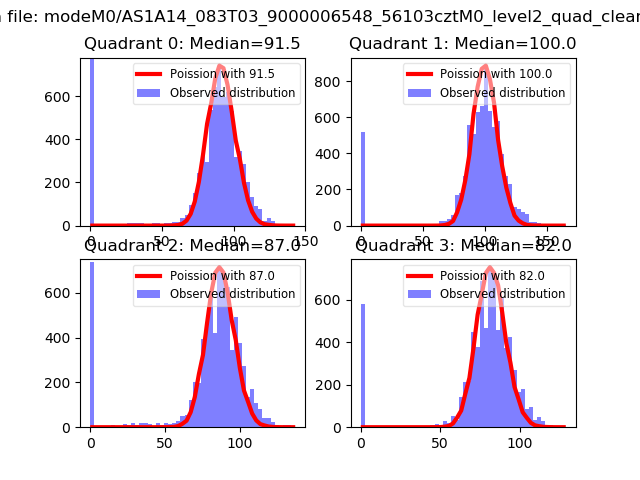 |
 |
| Quadrant-wise count rates Data is divided into 100 sec bins |
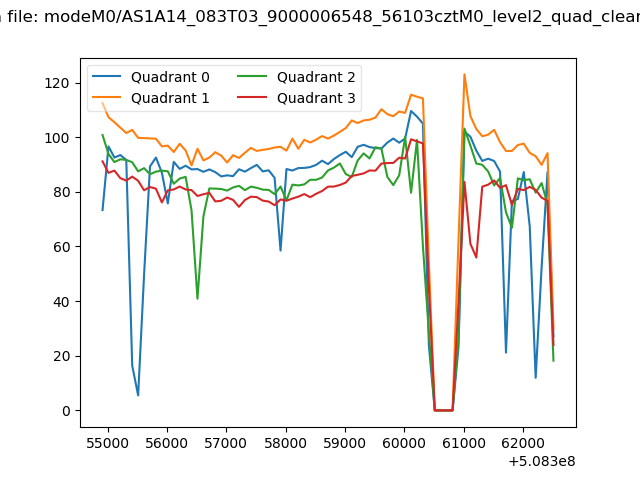 |
|
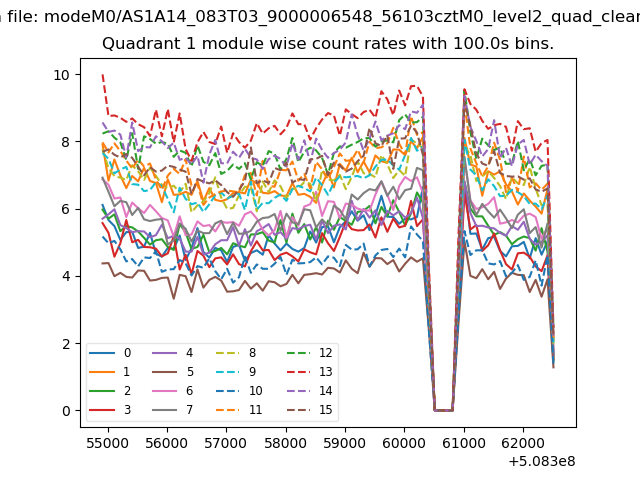
| Module-wise count rates for Quadrant A Data is divided into 100 sec bins |
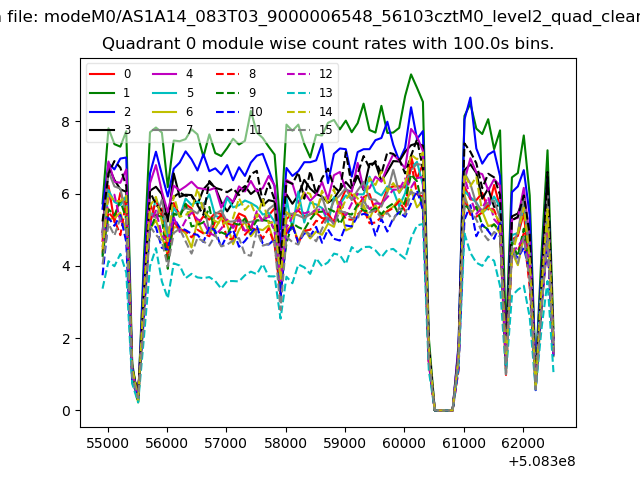 |
 |
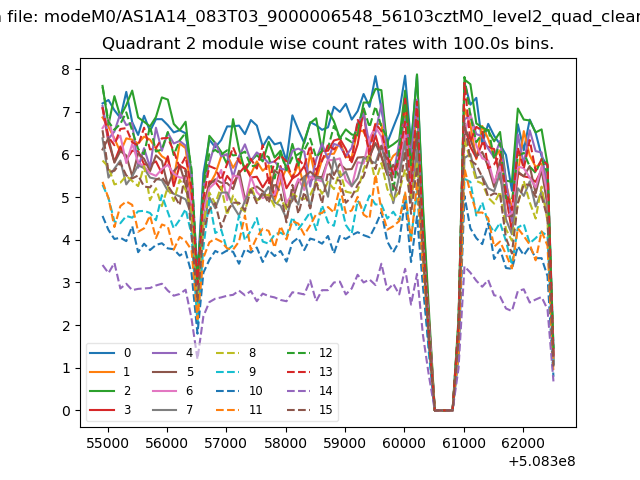
| Module-wise count rates for Quadrant B Data is divided into 100 sec bins |
 |
 |
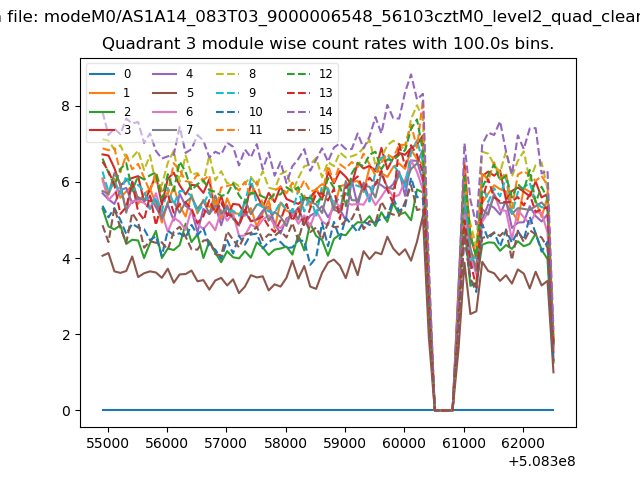
| Module-wise count rates for Quadrant C Data is divided into 100 sec bins |
 |
 |
| Module-wise count rates for Quadrant D Data is divided into 100 sec bins |
 |
 |
| Parameter | Plot |
|---|---|
| CZT HV Monitor |  |
| D_VDD | 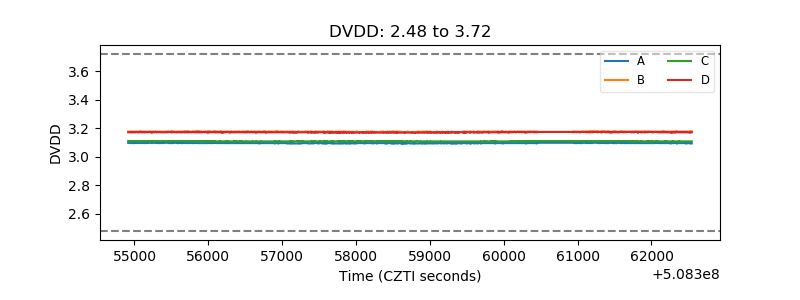 |
| Temperature 1 | 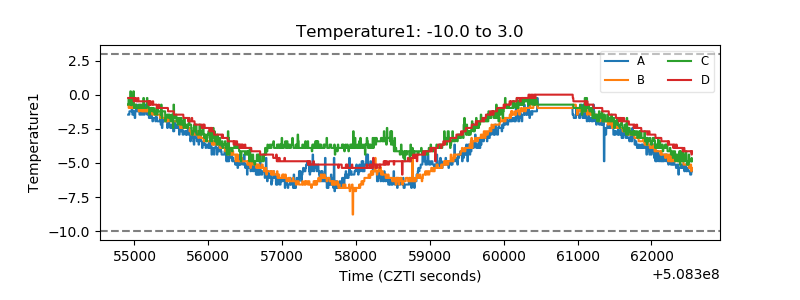 |
| Veto HV Monitor | 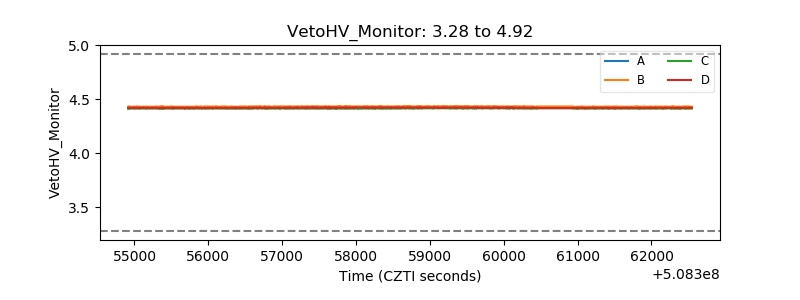 |
| Veto LLD |  |
| Alpha Counter | 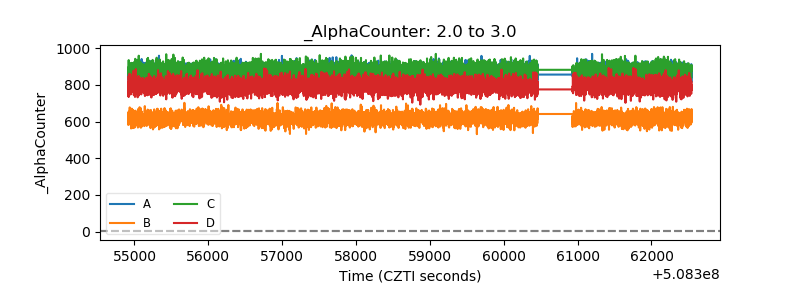 |
| _CPM_Rate | 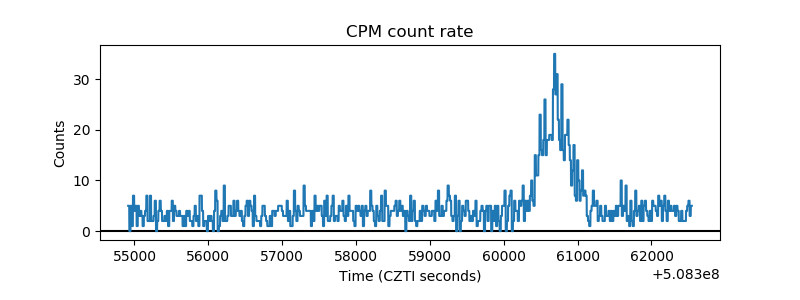 |
| CZT Counter | 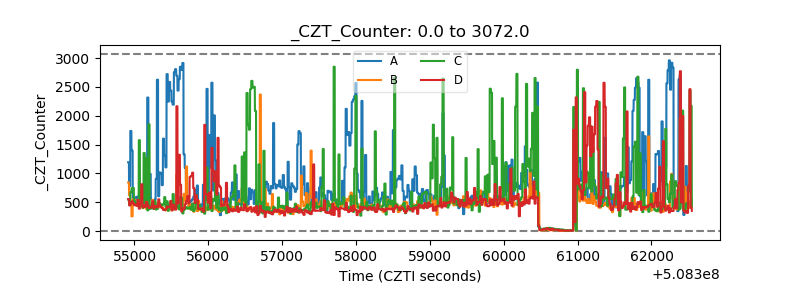 |
| +2.5 Volts monitor |  |
| +5 Volts monitor | 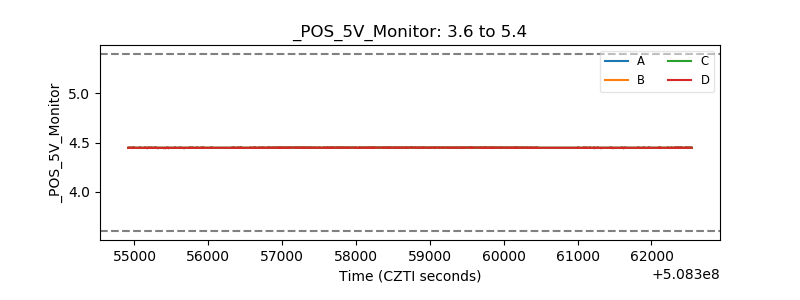 |
| _ROLL_ROT | 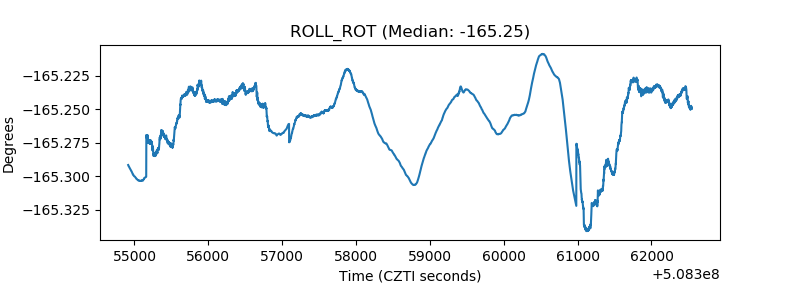 |
| _Roll_DEC | 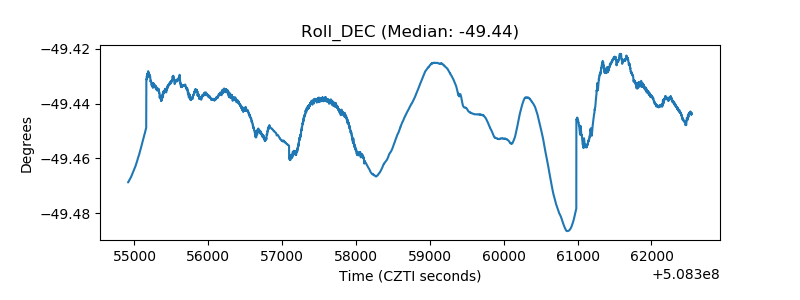 |
| _Roll_RA | 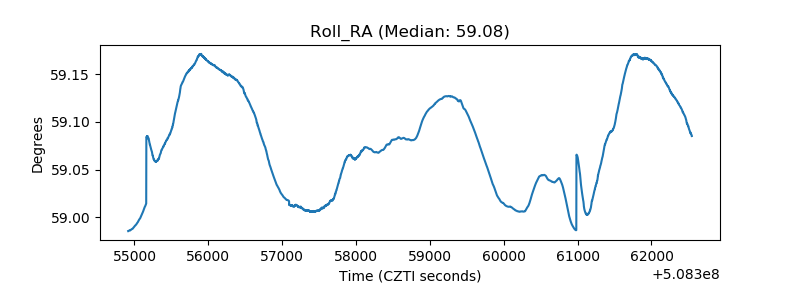 |
| Veto Counter | 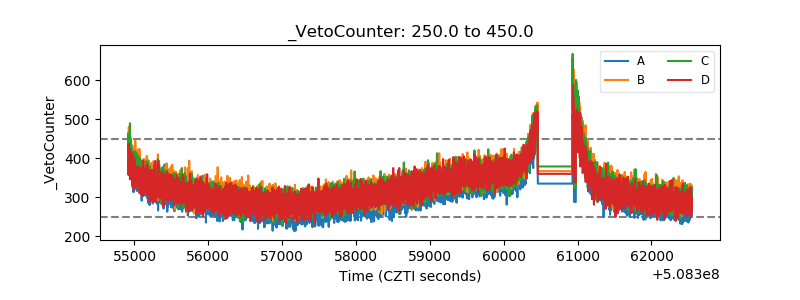 |