| Param | Original file | Final file |
|---|---|---|
| Filename | modeM0/AS1A14_083T03_9000006548_56104cztM0_level2.fits | modeM0/AS1A14_083T03_9000006548_56104cztM0_level2_quad_clean.evt |
| Size (bytes) | 585,008,640 | 107,190,720 |
| Size | 557.9 MB | 102.2 MB |
| Events in quadrant A | 5,680,015 | 677,848 |
| Events in quadrant B | 4,078,375 | 775,887 |
| Events in quadrant C | 6,526,249 | 619,416 |
| Events in quadrant D | 4,763,927 | 628,902 |
| Mode M0 | |||
|---|---|---|---|
| Quadrant | BADHDUFLAG | Total packets | Discarded packets |
| A | 0 | 22372 | 1 |
| B | 0 | 17626 | 1 |
| C | 0 | 24932 | 1 |
| D | 0 | 19945 | 1 |
| Mode SS | |||
|---|---|---|---|
| Quadrant | BADHDUFLAG | Total packets | Discarded packets |
| A | 0 | 158 | 0 |
| B | 0 | 158 | 0 |
| C | 0 | 158 | 0 |
| D | 0 | 158 | 0 |
| Mode M9 | |||
|---|---|---|---|
| Quadrant | BADHDUFLAG | Total packets | Discarded packets |
| A | 0 | 3 | 0 |
| B | 0 | 4 | 0 |
| C | 0 | 4 | 0 |
| D | 0 | 4 | 0 |
| Quadrant | Total seconds | Saturated seconds | Saturation percentage |
|---|---|---|---|
| A | 7815 | 578 | 7.396033% |
| B | 7815 | 105 | 1.343570% |
| C | 7815 | 891 | 11.401152% |
| D | 7815 | 266 | 3.403711% |
Noise dominated data is calculated using 1-second bins in cleaned event files. If a bin has >2000 counts, and if more than 50% of those come from <1% of pixels, then it is considered to be noise-dominated and hence unusable.
| Quadrant | # 1 sec bins | Bins with >0 counts | Bins with >2000 counts | High rate bins dominated by noise | Noise dominated (total time) | Noise dominated (detector-on time) | Marked lightcurve |
|---|---|---|---|---|---|---|---|
| A | 7840 | 7816 | 464 | 464 | 5.92% | 5.94% | 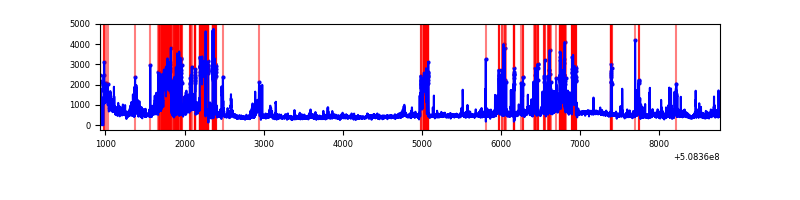 |
| B | 7840 | 7816 | 57 | 57 | 0.73% | 0.73% | 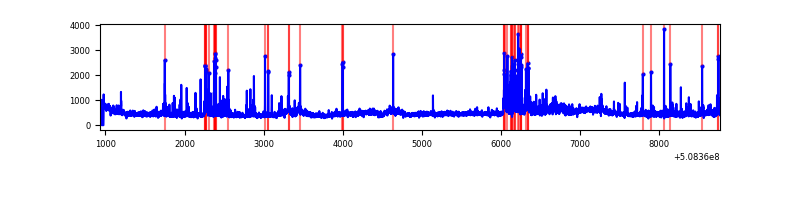 |
| C | 7840 | 7816 | 736 | 736 | 9.39% | 9.42% | 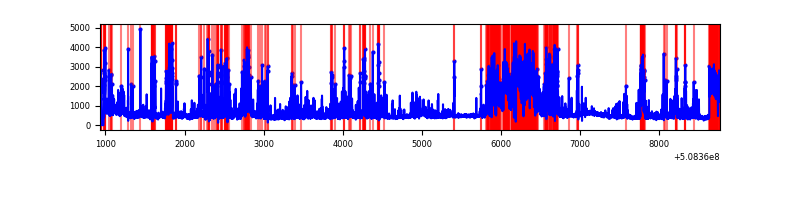 |
| D | 7840 | 7816 | 218 | 218 | 2.78% | 2.79% | 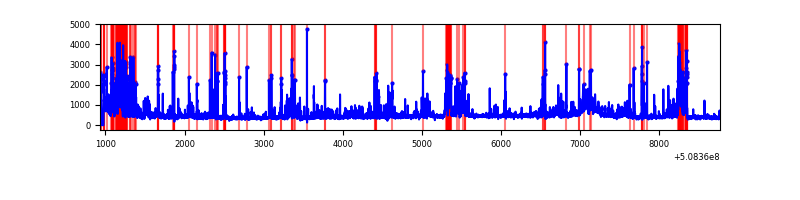 |
Top three noisy pixels from each quadrant. If the there are fewer than three noisy pixels in the level2.evt file, extra rows are filled as -1
| Pixel properties | Quadrant properties | ||||||
|---|---|---|---|---|---|---|---|
| Quadrant | DetID | PixID | Counts | Sigma | Mean | Median | Sigma |
| A | 12 | 115 | 914959 | 4645.75 | 792 | 773 | 196.8 |
| A | 7 | 64 | 582707 | 2957.29 | 792 | 773 | 196.8 |
| A | 15 | 32 | 503005 | 2552.26 | 792 | 773 | 196.8 |
| B | 5 | 185 | 184382 | 1057.18 | 814 | 787 | 173.7 |
| B | 9 | 254 | 158444 | 907.82 | 814 | 787 | 173.7 |
| B | 0 | 171 | 100407 | 573.63 | 814 | 787 | 173.7 |
| C | 12 | 254 | 2415529 | 11910.39 | 746 | 736 | 202.7 |
| C | 12 | 252 | 285053 | 1402.32 | 746 | 736 | 202.7 |
| C | 15 | 230 | 253250 | 1245.46 | 746 | 736 | 202.7 |
| D | 2 | 120 | 781358 | 3529.81 | 772 | 737 | 221.2 |
| D | 11 | 129 | 315712 | 1424.25 | 772 | 737 | 221.2 |
| D | 2 | 249 | 207939 | 936.93 | 772 | 737 | 221.2 |
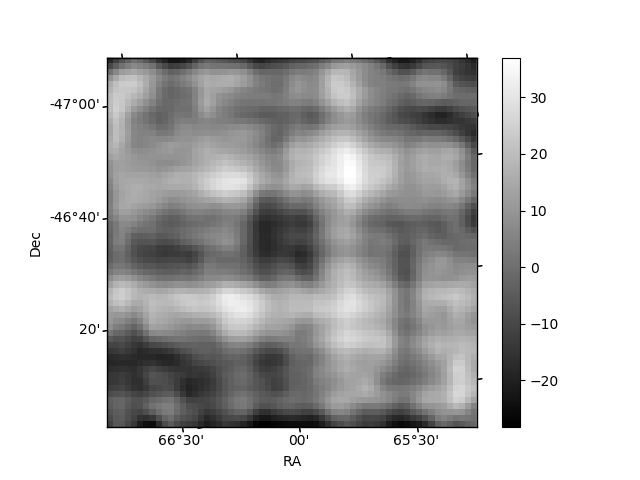
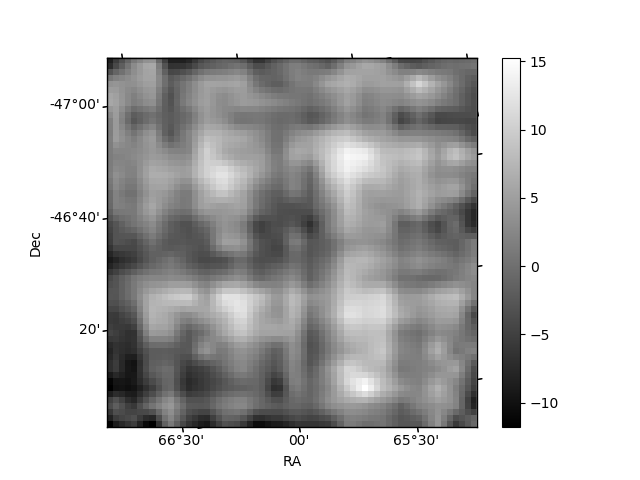
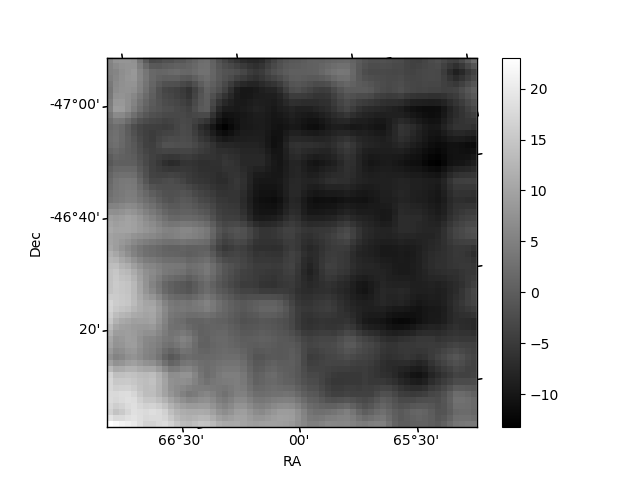
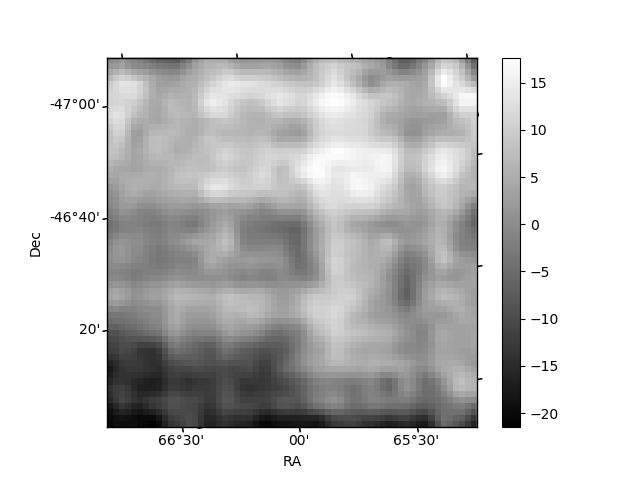
Histogram calculated using DETX and DETY for each event in the final _common_clean file
| Quadrant A | 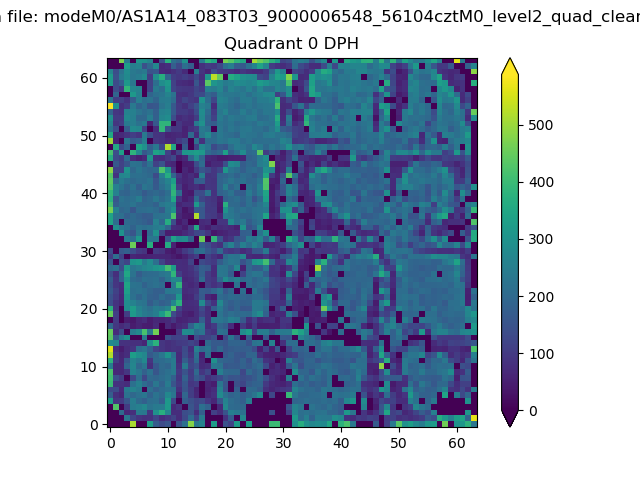 |
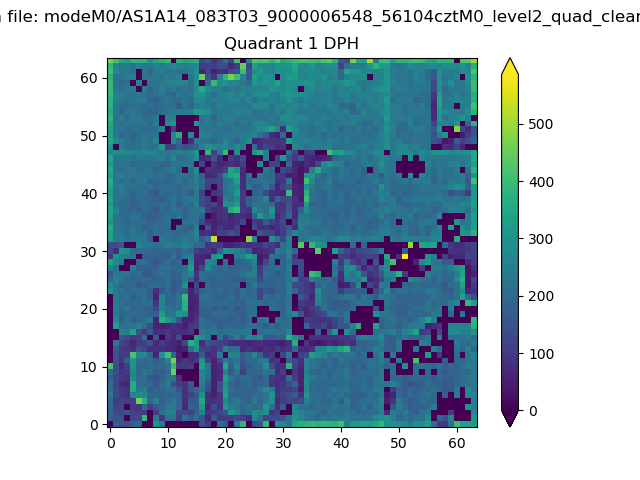 |
Quadrant B |
|---|---|---|---|
| Quadrant D | 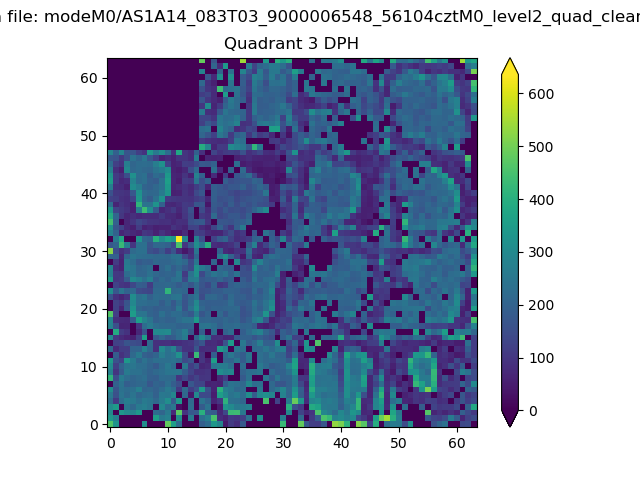 |
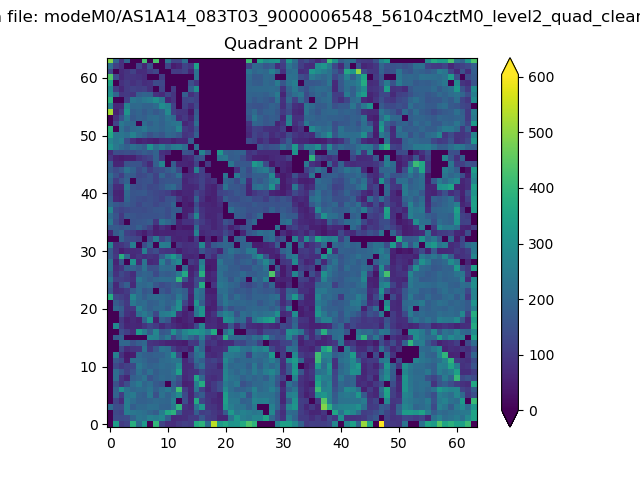 |
Quadrant C |
| Plot type | Count rate plots | Images |
|---|---|---|
| Comparison with Poisson distribution Blue bars denote a histogram of data divided into 1 sec bins. Red curve is a Poisson curve with rate = median count rate of data. |
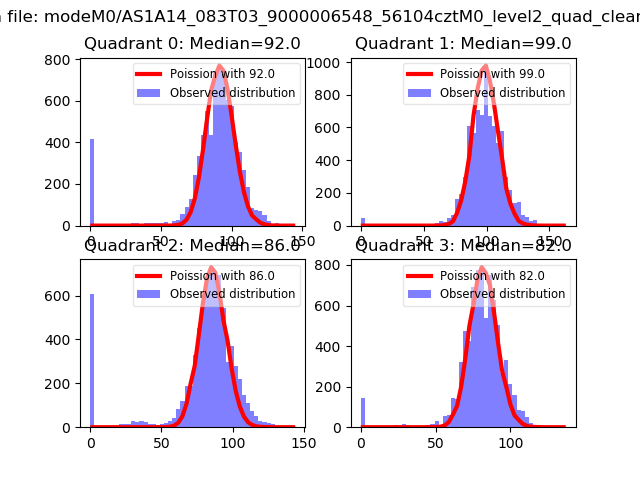 |
 |
| Quadrant-wise count rates Data is divided into 100 sec bins |
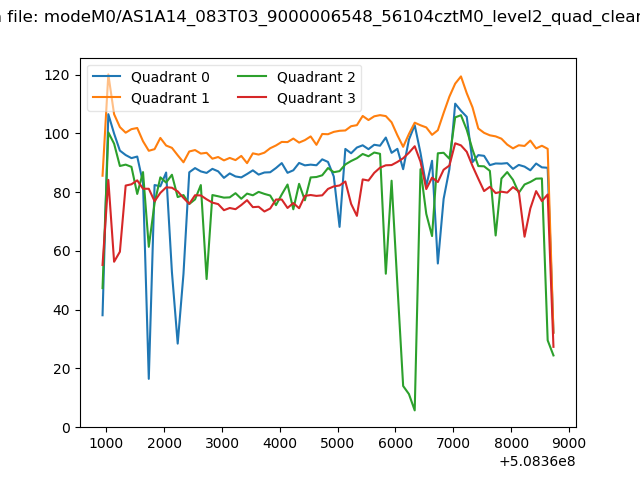 |
|
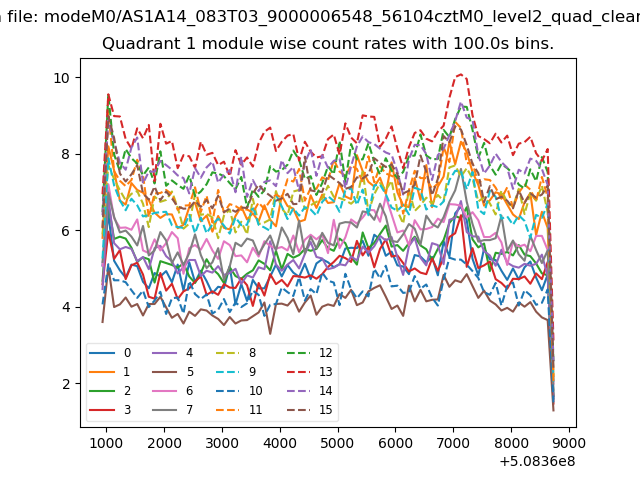
| Module-wise count rates for Quadrant A Data is divided into 100 sec bins |
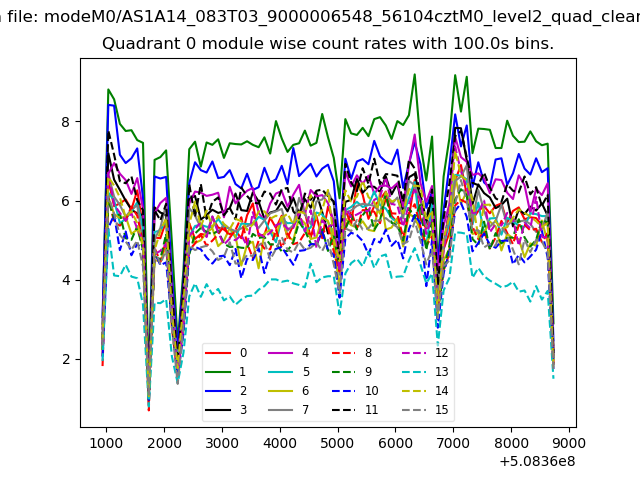 |
 |
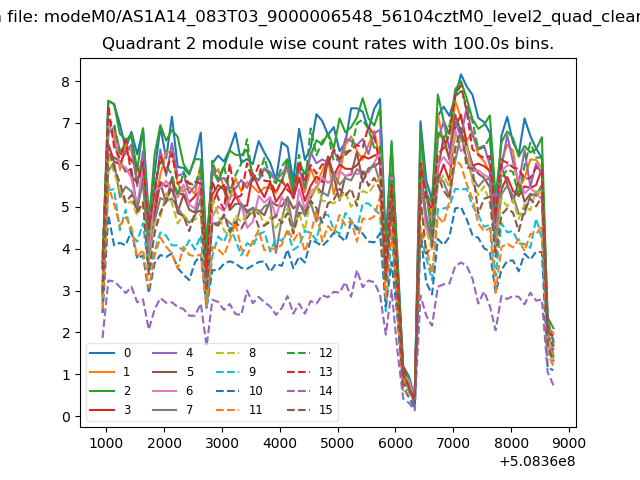
| Module-wise count rates for Quadrant B Data is divided into 100 sec bins |
 |
 |
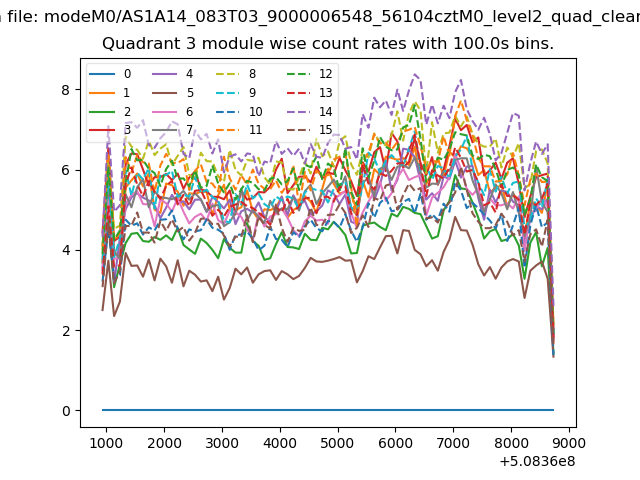
| Module-wise count rates for Quadrant C Data is divided into 100 sec bins |
 |
 |
| Module-wise count rates for Quadrant D Data is divided into 100 sec bins |
 |
 |
| Parameter | Plot |
|---|---|
| CZT HV Monitor | 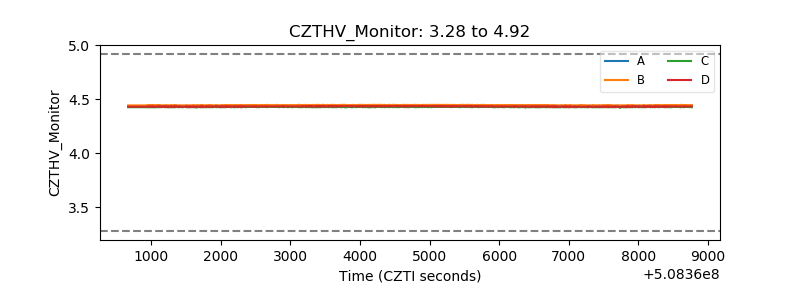 |
| D_VDD | 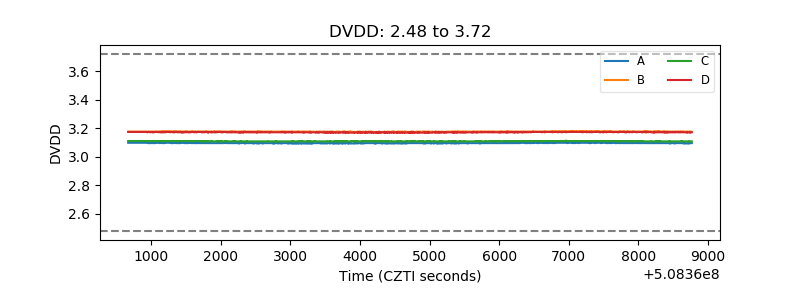 |
| Temperature 1 | 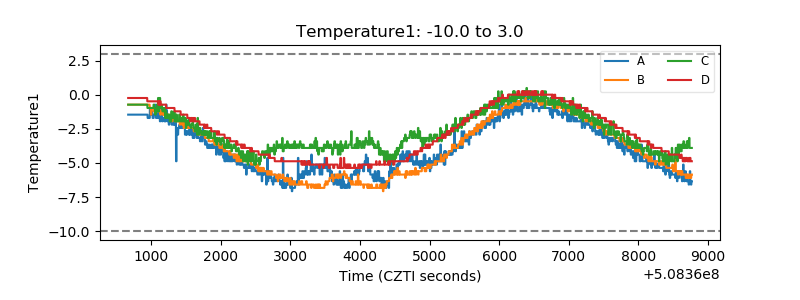 |
| Veto HV Monitor | 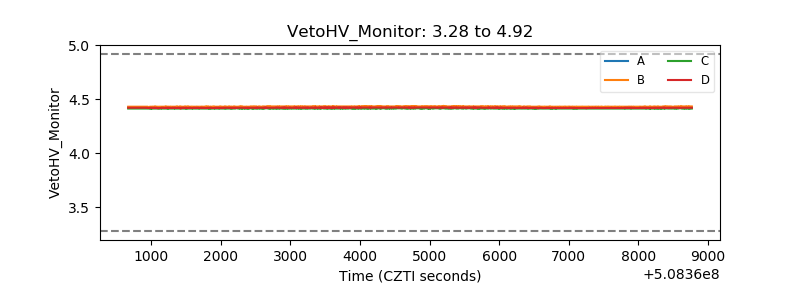 |
| Veto LLD | 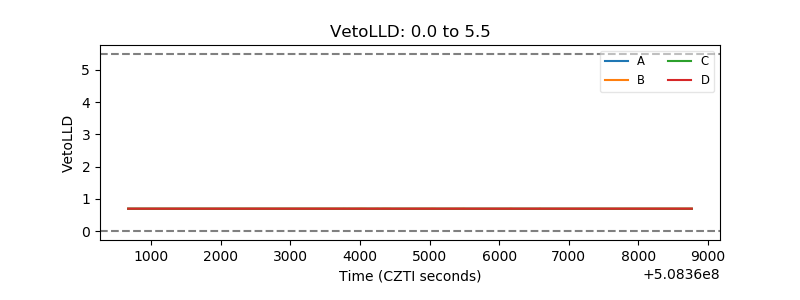 |
| Alpha Counter | 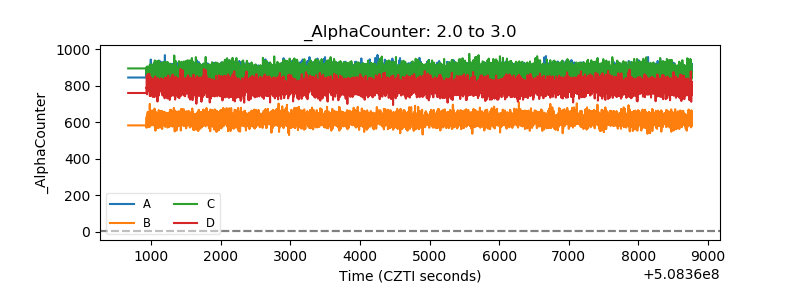 |
| _CPM_Rate | 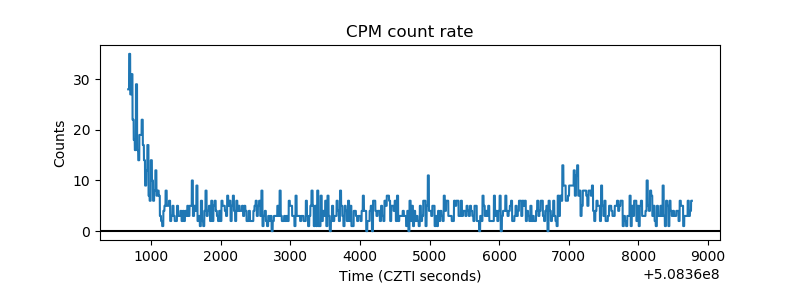 |
| CZT Counter | 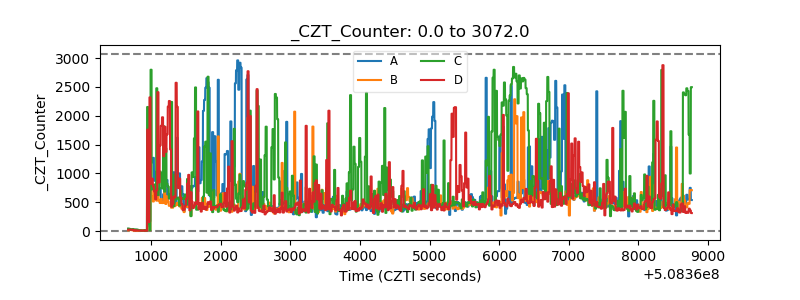 |
| +2.5 Volts monitor |  |
| +5 Volts monitor |  |
| _ROLL_ROT | 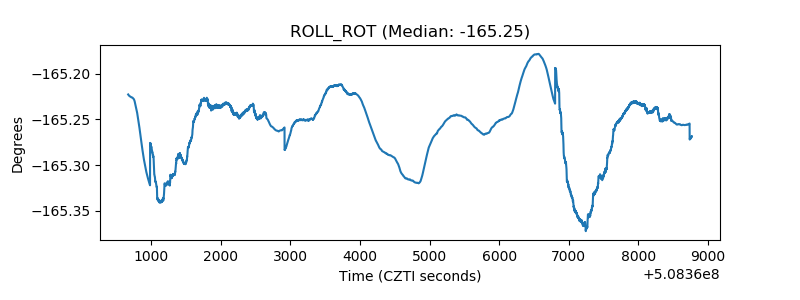 |
| _Roll_DEC | 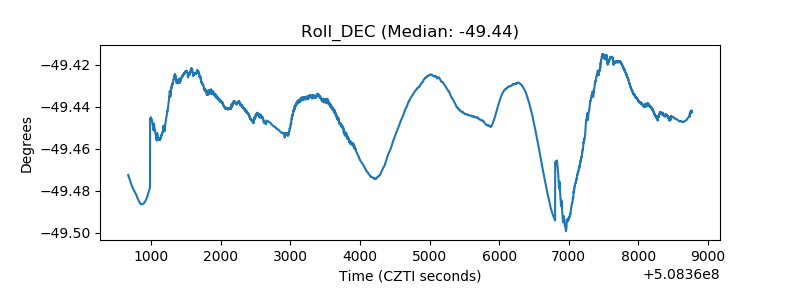 |
| _Roll_RA | 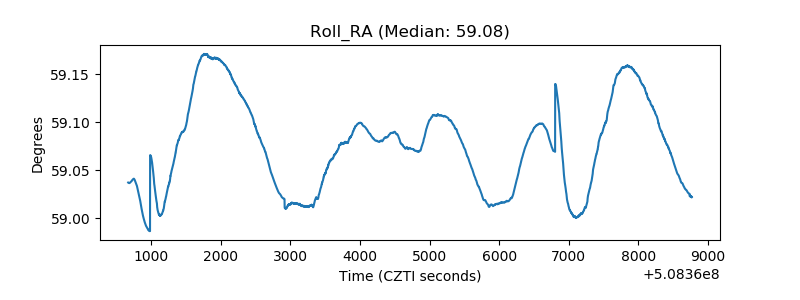 |
| Veto Counter | 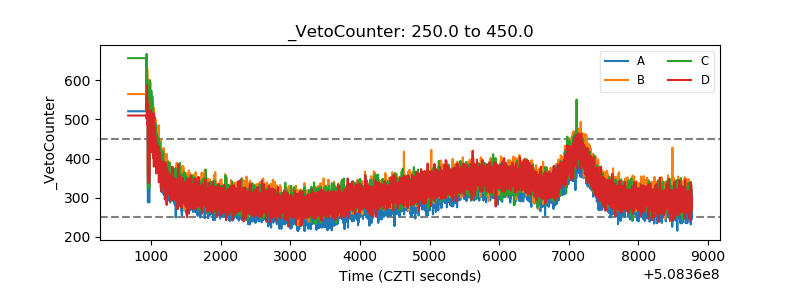 |