| Param | Original file | Final file |
|---|---|---|
| Filename | modeM0/AS1A14_083T03_9000006548_56105cztM0_level2.fits | modeM0/AS1A14_083T03_9000006548_56105cztM0_level2_quad_clean.evt |
| Size (bytes) | 626,880,960 | 110,666,880 |
| Size | 597.8 MB | 105.5 MB |
| Events in quadrant A | 5,933,679 | 713,518 |
| Events in quadrant B | 4,272,968 | 802,911 |
| Events in quadrant C | 7,868,200 | 613,433 |
| Events in quadrant D | 4,501,673 | 657,522 |
| Mode M0 | |||
|---|---|---|---|
| Quadrant | BADHDUFLAG | Total packets | Discarded packets |
| A | 0 | 23368 | 1 |
| B | 0 | 18158 | 0 |
| C | 0 | 29125 | 0 |
| D | 0 | 19406 | 0 |
| Mode SS | |||
|---|---|---|---|
| Quadrant | BADHDUFLAG | Total packets | Discarded packets |
| A | 0 | 162 | 0 |
| B | 0 | 162 | 0 |
| C | 0 | 162 | 0 |
| D | 0 | 162 | 0 |
| Quadrant | Total seconds | Saturated seconds | Saturation percentage |
|---|---|---|---|
| A | 8101 | 469 | 5.789409% |
| B | 8101 | 53 | 0.654240% |
| C | 8102 | 1285 | 15.860281% |
| D | 8102 | 136 | 1.678598% |
Noise dominated data is calculated using 1-second bins in cleaned event files. If a bin has >2000 counts, and if more than 50% of those come from <1% of pixels, then it is considered to be noise-dominated and hence unusable.
| Quadrant | # 1 sec bins | Bins with >0 counts | Bins with >2000 counts | High rate bins dominated by noise | Noise dominated (total time) | Noise dominated (detector-on time) | Marked lightcurve |
|---|---|---|---|---|---|---|---|
| A | 8101 | 8101 | 358 | 358 | 4.42% | 4.42% | 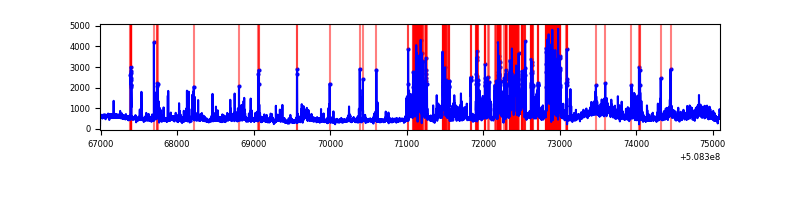 |
| B | 8101 | 8101 | 20 | 20 | 0.25% | 0.25% | 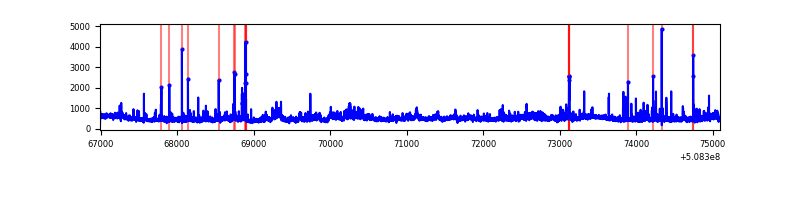 |
| C | 8102 | 8102 | 1100 | 1100 | 13.58% | 13.58% | 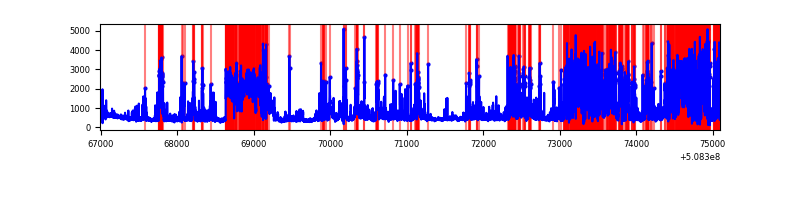 |
| D | 8102 | 8102 | 147 | 147 | 1.81% | 1.81% | 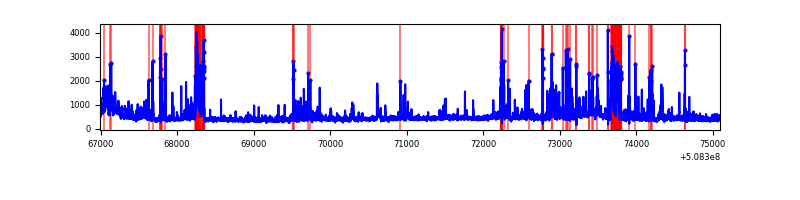 |
Top three noisy pixels from each quadrant. If the there are fewer than three noisy pixels in the level2.evt file, extra rows are filled as -1
| Pixel properties | Quadrant properties | ||||||
|---|---|---|---|---|---|---|---|
| Quadrant | DetID | PixID | Counts | Sigma | Mean | Median | Sigma |
| A | 15 | 32 | 1332971 | 6405.71 | 827 | 806 | 208.0 |
| A | 7 | 64 | 728616 | 3499.67 | 827 | 806 | 208.0 |
| A | 3 | 14 | 291877 | 1399.61 | 827 | 806 | 208.0 |
| B | 9 | 254 | 453851 | 2499.7 | 846 | 815 | 181.2 |
| B | 0 | 171 | 95816 | 524.18 | 846 | 815 | 181.2 |
| B | 7 | 252 | 93113 | 509.27 | 846 | 815 | 181.2 |
| C | 12 | 254 | 3068452 | 14558.86 | 770 | 761 | 210.7 |
| C | 15 | 230 | 1236029 | 5862.42 | 770 | 761 | 210.7 |
| C | 12 | 252 | 153034 | 722.67 | 770 | 761 | 210.7 |
| D | 8 | 240 | 317959 | 1401.26 | 804 | 768 | 226.4 |
| D | 11 | 129 | 256487 | 1129.69 | 804 | 768 | 226.4 |
| D | 2 | 120 | 230467 | 1014.74 | 804 | 768 | 226.4 |
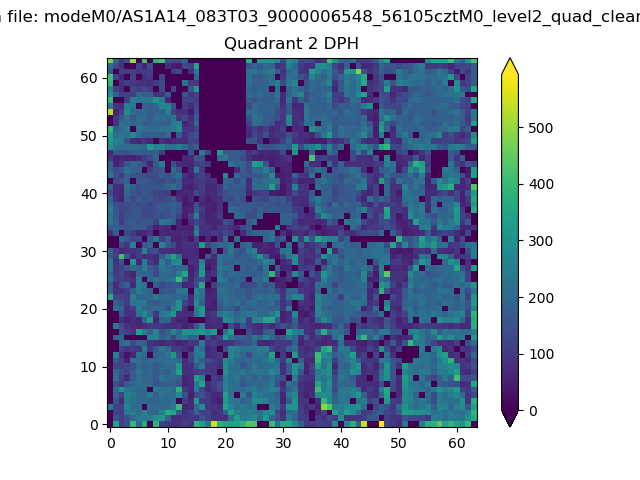
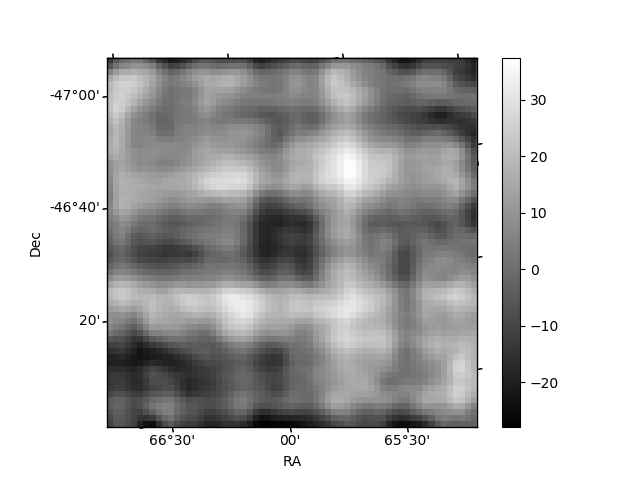
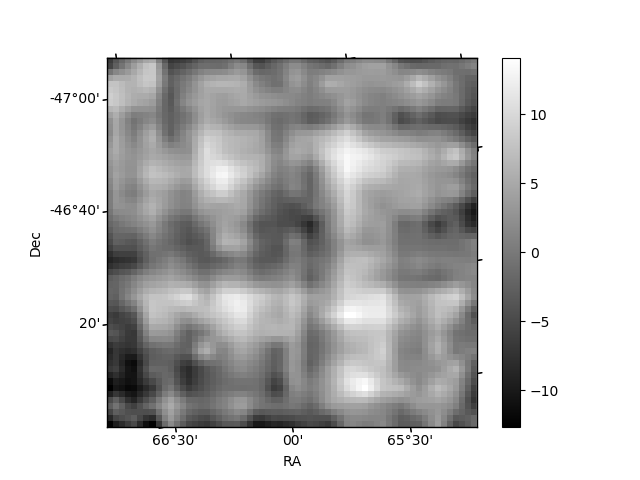
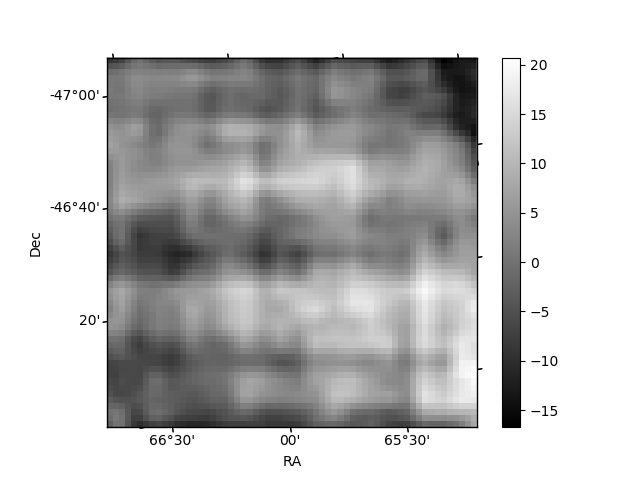
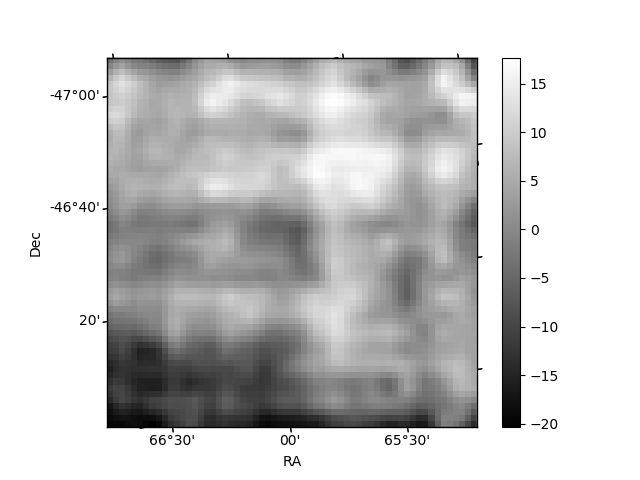
Histogram calculated using DETX and DETY for each event in the final _common_clean file
| Quadrant A | 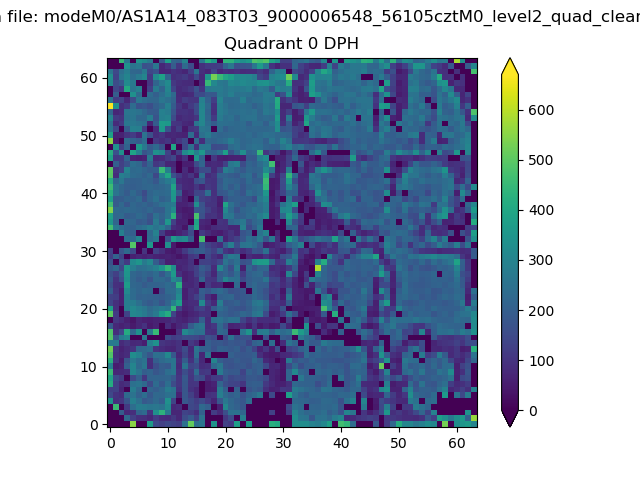 |
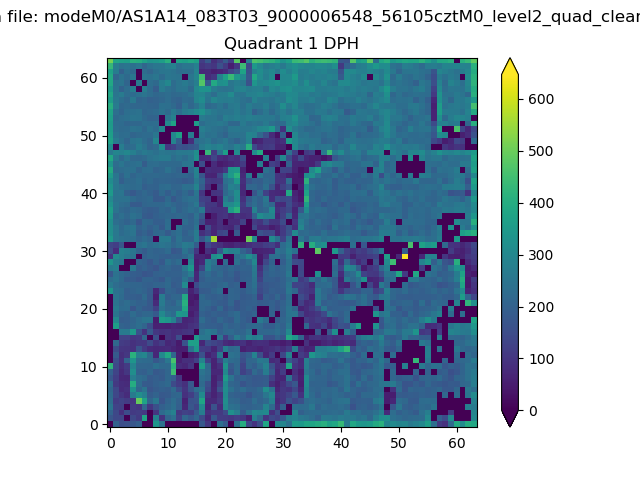 |
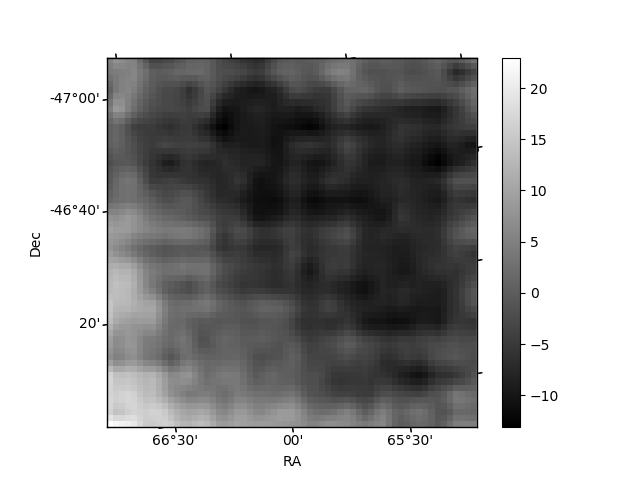
Quadrant B |
|---|---|---|---|
| Quadrant D | 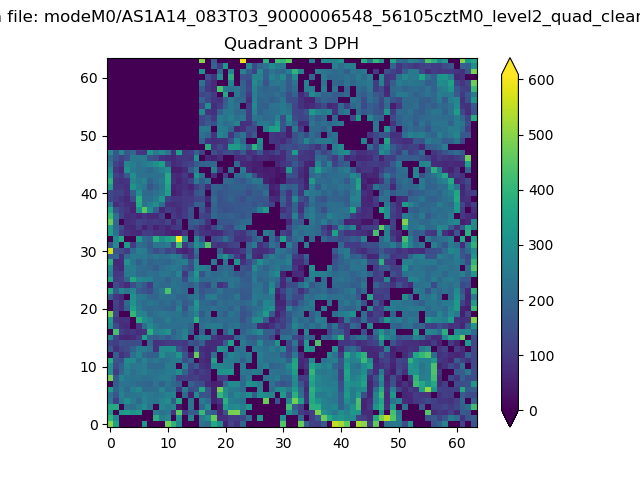 |
 |
Quadrant C |
| Plot type | Count rate plots | Images |
|---|---|---|
| Comparison with Poisson distribution Blue bars denote a histogram of data divided into 1 sec bins. Red curve is a Poisson curve with rate = median count rate of data. |
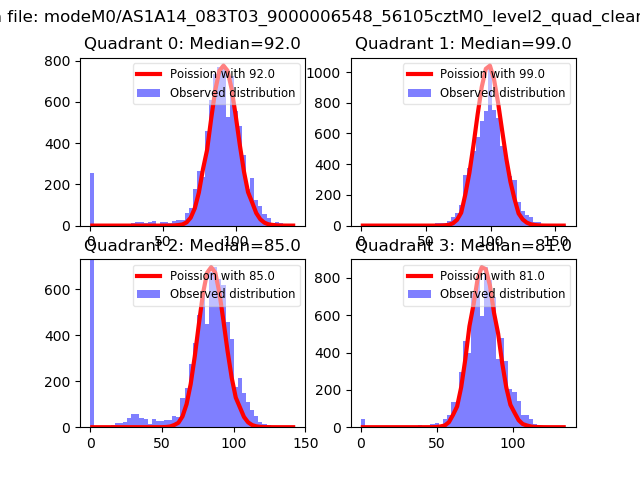 |
 |
| Quadrant-wise count rates Data is divided into 100 sec bins |
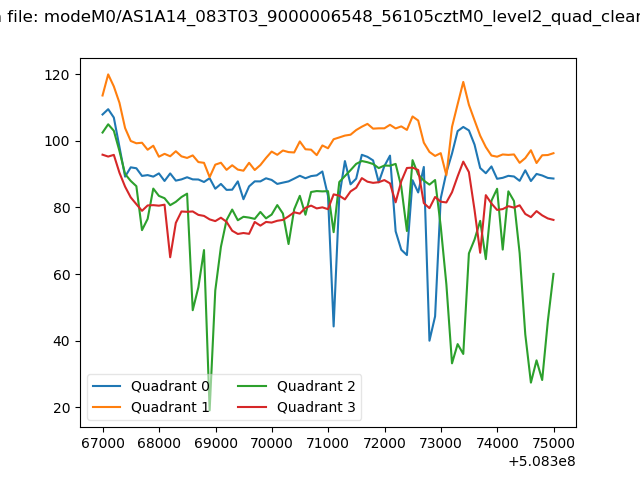 |
|
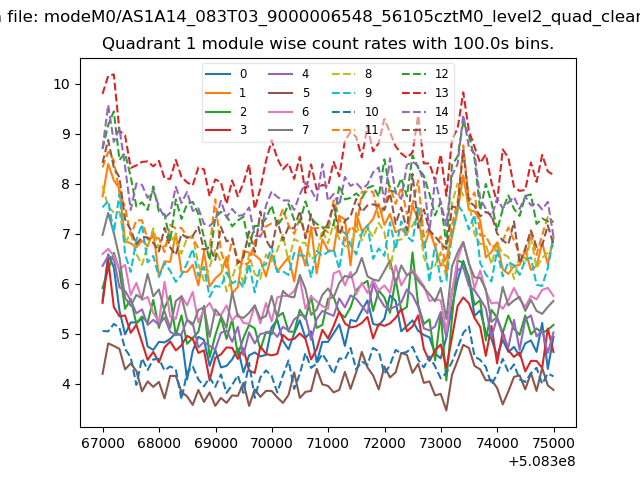
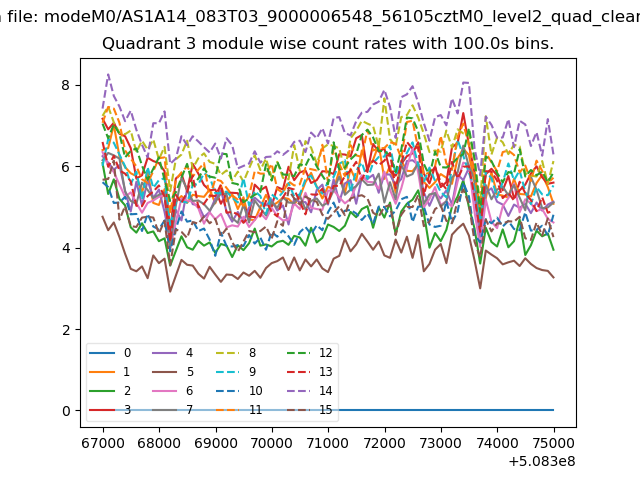
| Module-wise count rates for Quadrant A Data is divided into 100 sec bins |
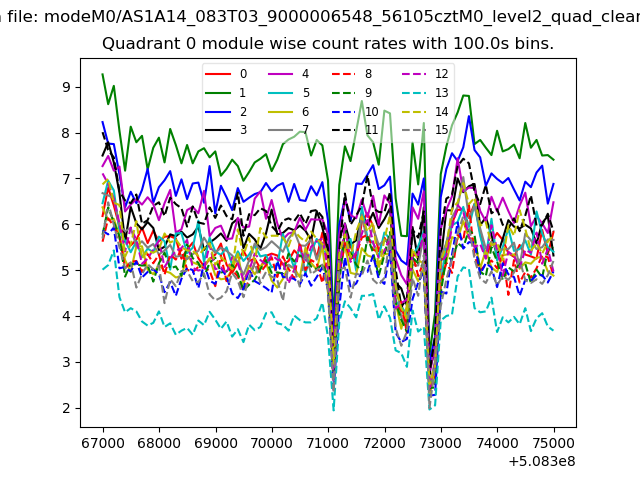 |
 |
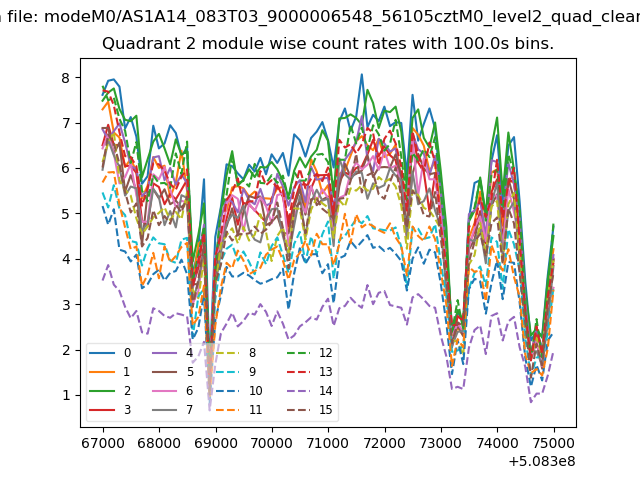
| Module-wise count rates for Quadrant B Data is divided into 100 sec bins |
 |
 |
| Module-wise count rates for Quadrant C Data is divided into 100 sec bins |
 |
 |
| Module-wise count rates for Quadrant D Data is divided into 100 sec bins |
 |
 |
| Parameter | Plot |
|---|---|
| CZT HV Monitor | 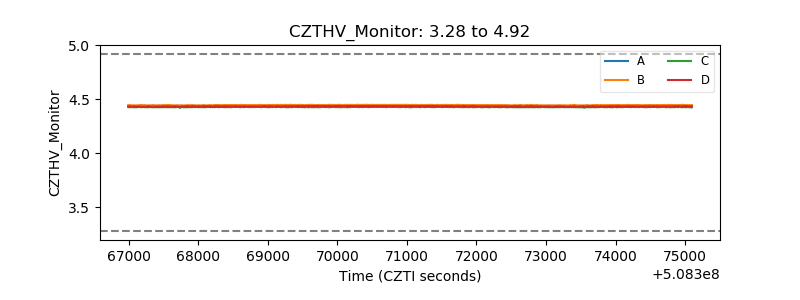 |
| D_VDD | 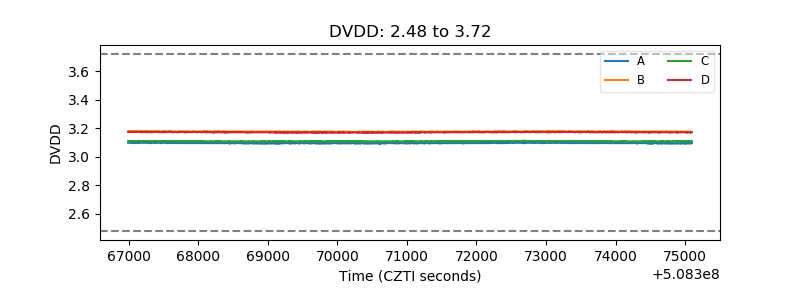 |
| Temperature 1 | 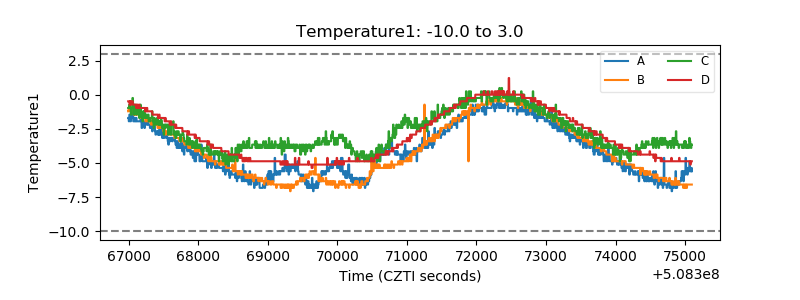 |
| Veto HV Monitor |  |
| Veto LLD | 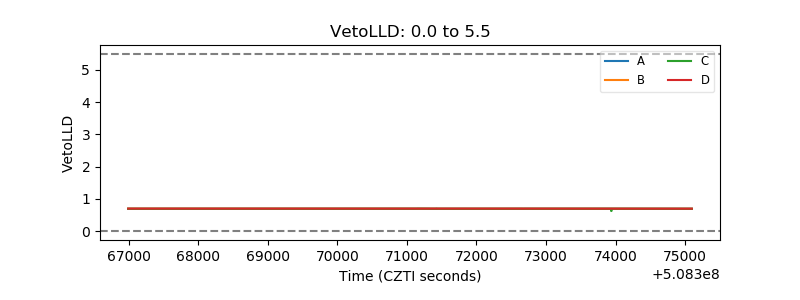 |
| Alpha Counter | 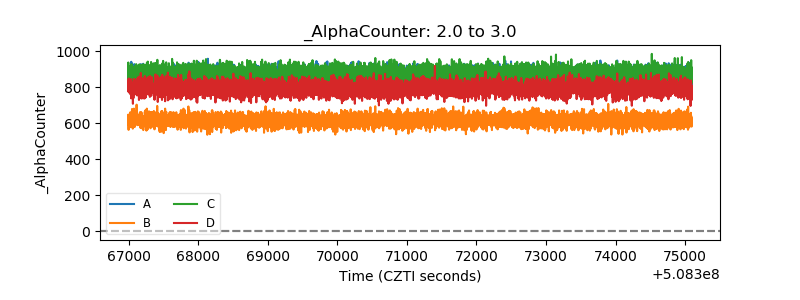 |
| _CPM_Rate | 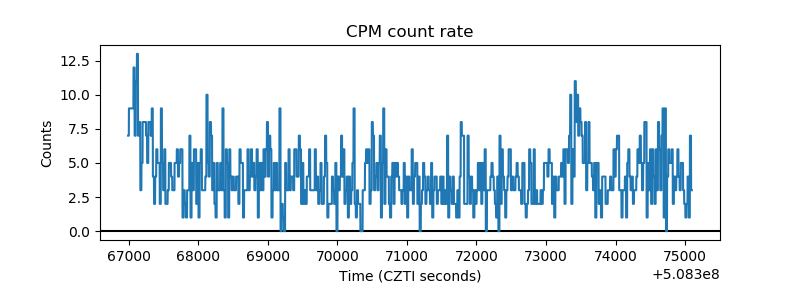 |
| CZT Counter | 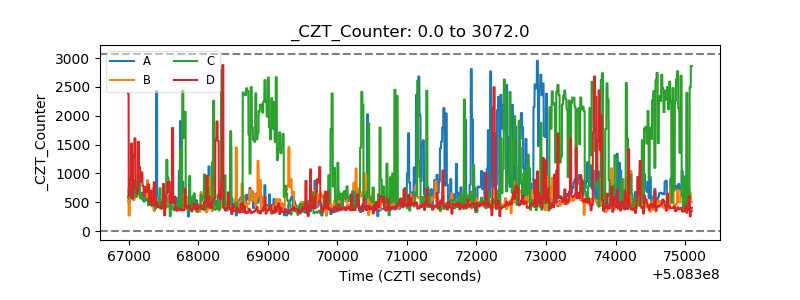 |
| +2.5 Volts monitor | 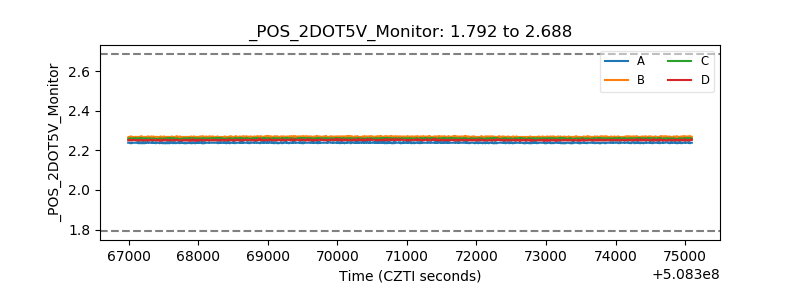 |
| +5 Volts monitor | 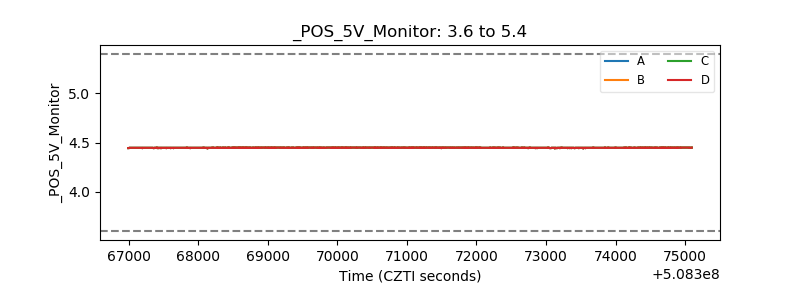 |
| _ROLL_ROT | 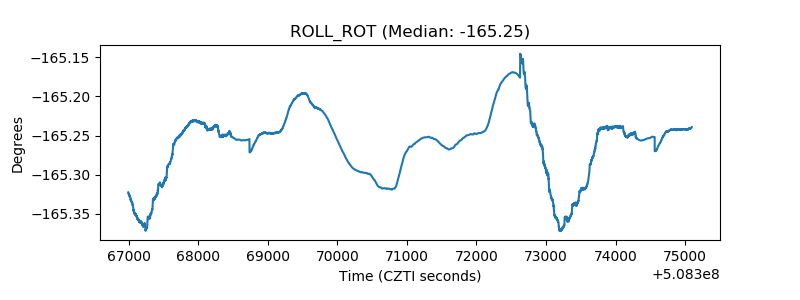 |
| _Roll_DEC | 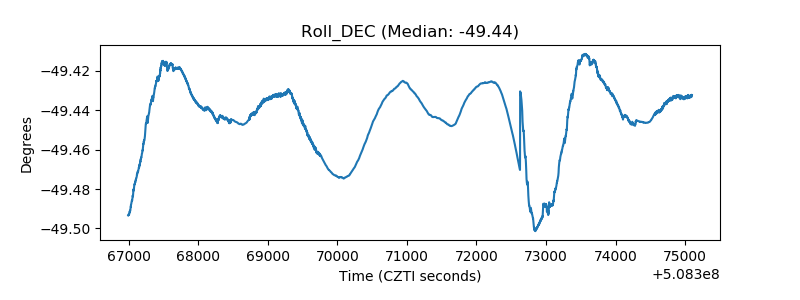 |
| _Roll_RA | 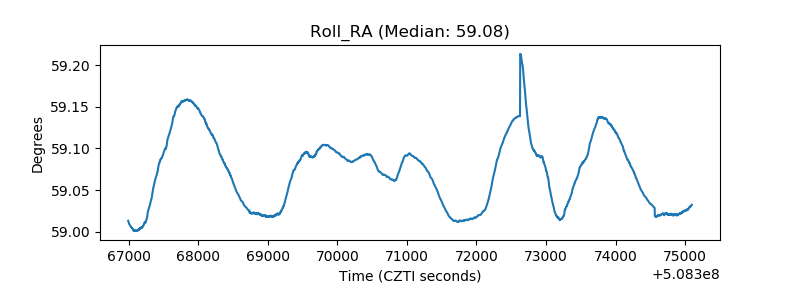 |
| Veto Counter | 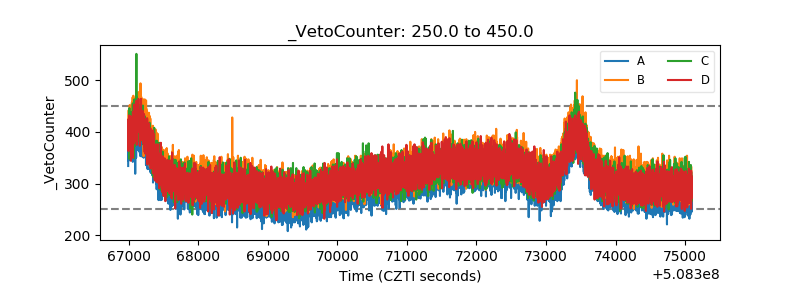 |