| Param | Original file | Final file |
|---|---|---|
| Filename | modeM0/AS1A14_083T03_9000006548_56109cztM0_level2.fits | modeM0/AS1A14_083T03_9000006548_56109cztM0_level2_quad_clean.evt |
| Size (bytes) | 1,465,070,400 | 250,007,040 |
| Size | 1.4 GB | 238.4 MB |
| Events in quadrant A | 17,308,301 | 1,497,924 |
| Events in quadrant B | 9,571,226 | 1,819,358 |
| Events in quadrant C | 14,484,597 | 1,472,902 |
| Events in quadrant D | 11,416,827 | 1,484,583 |
| Mode M0 | |||
|---|---|---|---|
| Quadrant | BADHDUFLAG | Total packets | Discarded packets |
| A | 0 | 64602 | 4 |
| B | 0 | 41663 | 4 |
| C | 0 | 56637 | 4 |
| D | 0 | 47548 | 4 |
| Mode SS | |||
|---|---|---|---|
| Quadrant | BADHDUFLAG | Total packets | Discarded packets |
| A | 0 | 384 | 0 |
| B | 0 | 384 | 0 |
| C | 0 | 384 | 0 |
| D | 0 | 384 | 0 |
| Mode M9 | |||
|---|---|---|---|
| Quadrant | BADHDUFLAG | Total packets | Discarded packets |
| A | 0 | 15 | 0 |
| B | 0 | 15 | 0 |
| C | 0 | 15 | 0 |
| D | 0 | 15 | 0 |
| Quadrant | Total seconds | Saturated seconds | Saturation percentage |
|---|---|---|---|
| A | 18769 | 2326 | 12.392775% |
| B | 18769 | 419 | 2.232404% |
| C | 18770 | 1922 | 10.239744% |
| D | 18770 | 655 | 3.489611% |
Noise dominated data is calculated using 1-second bins in cleaned event files. If a bin has >2000 counts, and if more than 50% of those come from <1% of pixels, then it is considered to be noise-dominated and hence unusable.
| Quadrant | # 1 sec bins | Bins with >0 counts | Bins with >2000 counts | High rate bins dominated by noise | Noise dominated (total time) | Noise dominated (detector-on time) | Marked lightcurve |
|---|---|---|---|---|---|---|---|
| A | 20394 | 18772 | 1868 | 1868 | 9.16% | 9.95% | 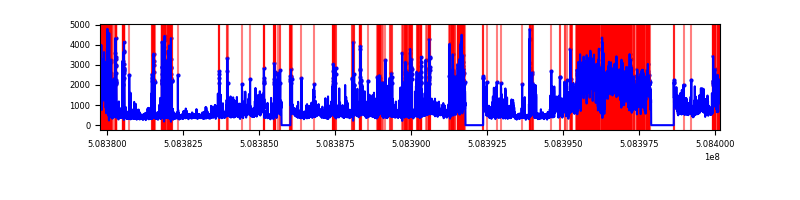 |
| B | 20394 | 18772 | 47 | 47 | 0.23% | 0.25% | 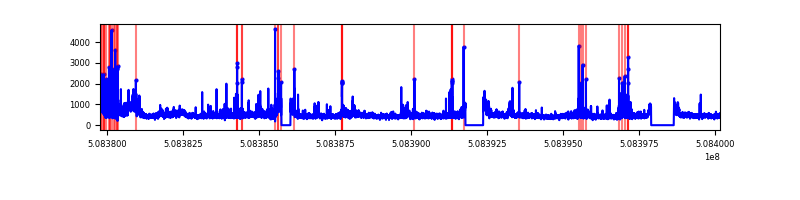 |
| C | 20395 | 18772 | 1260 | 1260 | 6.18% | 6.71% | 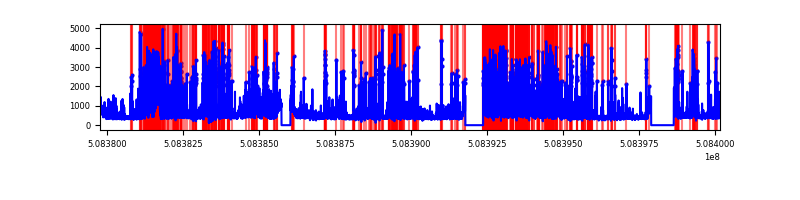 |
| D | 20395 | 18773 | 425 | 425 | 2.08% | 2.26% | 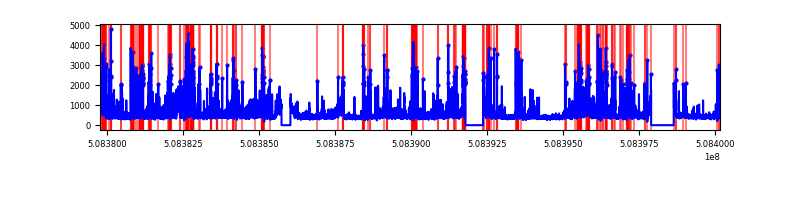 |
Top three noisy pixels from each quadrant. If the there are fewer than three noisy pixels in the level2.evt file, extra rows are filled as -1
| Pixel properties | Quadrant properties | ||||||
|---|---|---|---|---|---|---|---|
| Quadrant | DetID | PixID | Counts | Sigma | Mean | Median | Sigma |
| A | 3 | 14 | 5136581 | 10879.19 | 1913 | 1861 | 472.0 |
| A | 15 | 32 | 1418583 | 3001.68 | 1913 | 1861 | 472.0 |
| A | 12 | 115 | 1200849 | 2540.36 | 1913 | 1861 | 472.0 |
| B | 9 | 254 | 819707 | 1963.51 | 1967 | 1896 | 416.5 |
| B | 10 | 247 | 256478 | 611.23 | 1967 | 1896 | 416.5 |
| B | 0 | 199 | 171869 | 408.09 | 1967 | 1896 | 416.5 |
| C | 12 | 254 | 5932843 | 11714.1 | 1860 | 1842 | 506.3 |
| C | 12 | 252 | 756785 | 1491.06 | 1860 | 1842 | 506.3 |
| C | 13 | 3 | 229772 | 450.18 | 1860 | 1842 | 506.3 |
| D | 8 | 240 | 1343944 | 2505.01 | 1905 | 1819 | 535.8 |
| D | 11 | 129 | 1140613 | 2125.5 | 1905 | 1819 | 535.8 |
| D | 2 | 249 | 359209 | 667.05 | 1905 | 1819 | 535.8 |
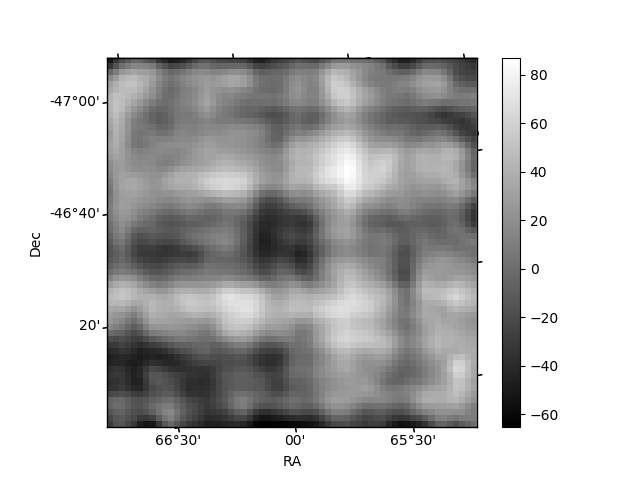
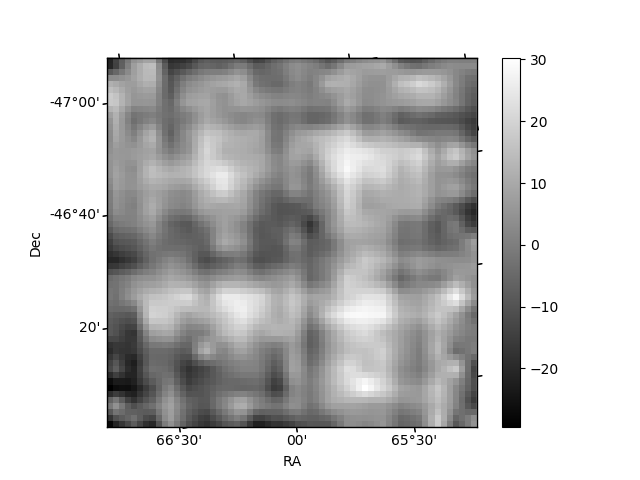
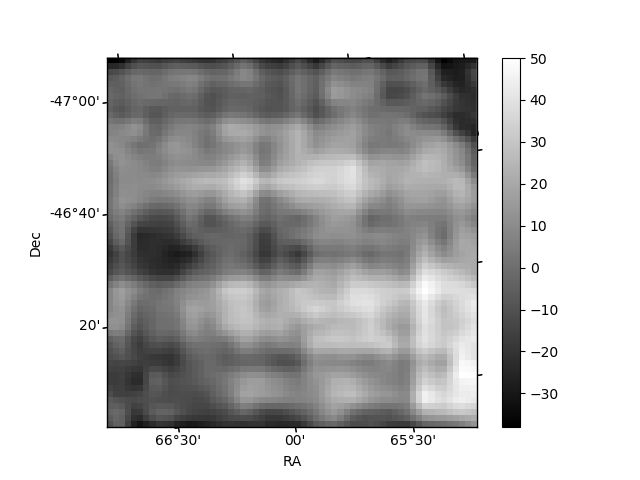
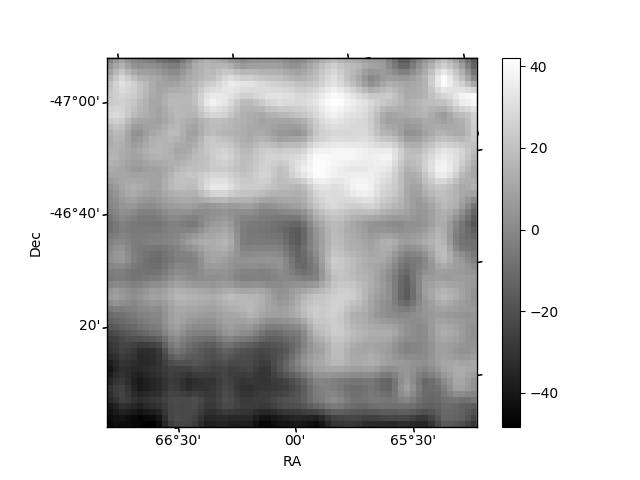
Histogram calculated using DETX and DETY for each event in the final _common_clean file
| Quadrant A | 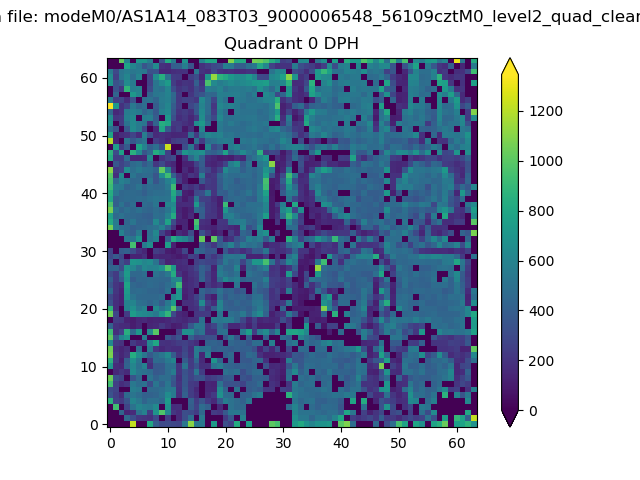 |
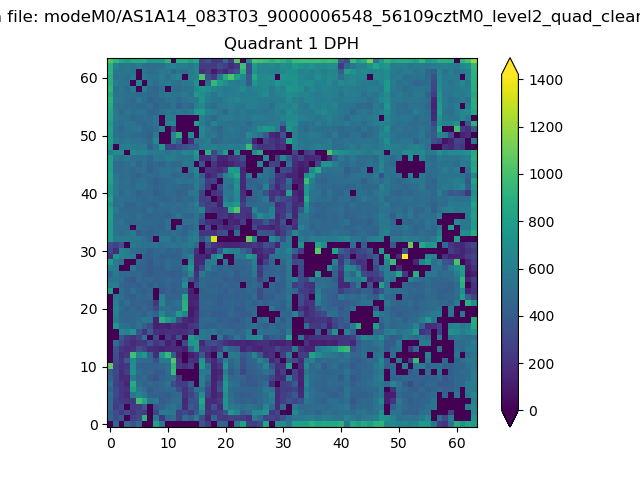 |
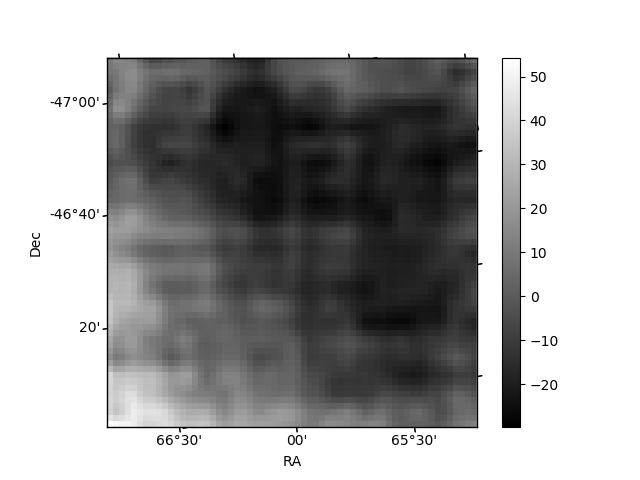
Quadrant B |
|---|---|---|---|
| Quadrant D | 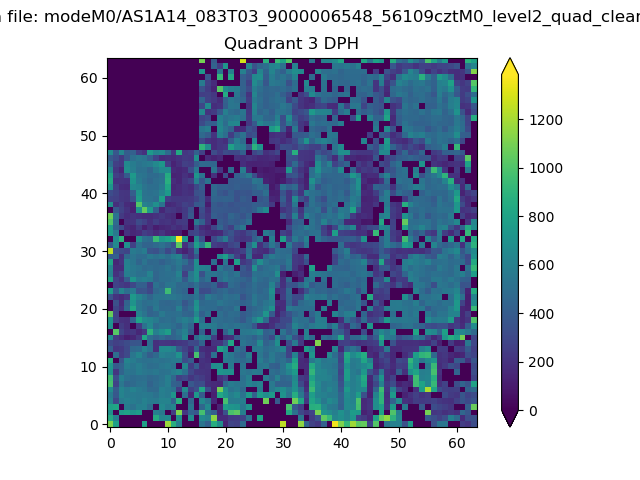 |
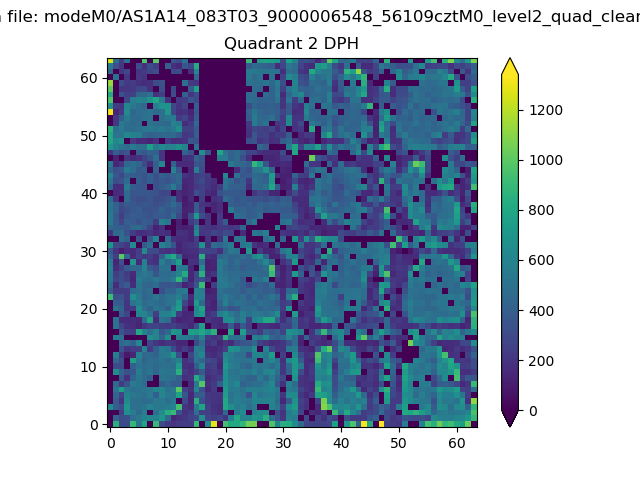 |
Quadrant C |
| Plot type | Count rate plots | Images |
|---|---|---|
| Comparison with Poisson distribution Blue bars denote a histogram of data divided into 1 sec bins. Red curve is a Poisson curve with rate = median count rate of data. |
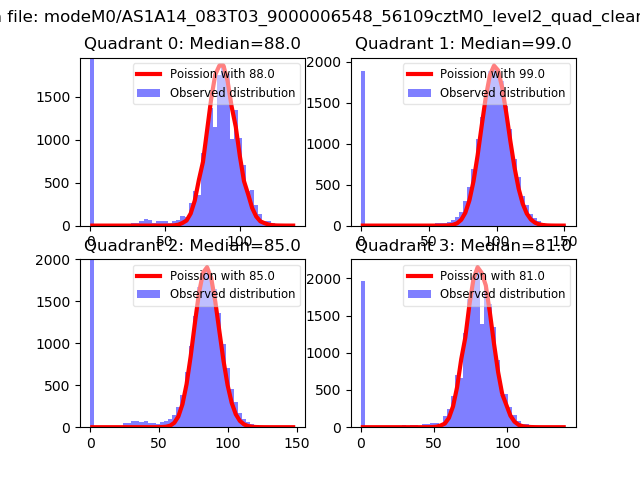 |
 |
| Quadrant-wise count rates Data is divided into 100 sec bins |
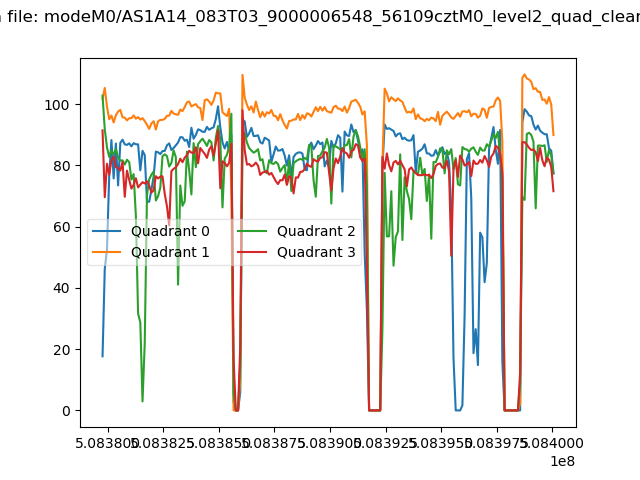 |
|
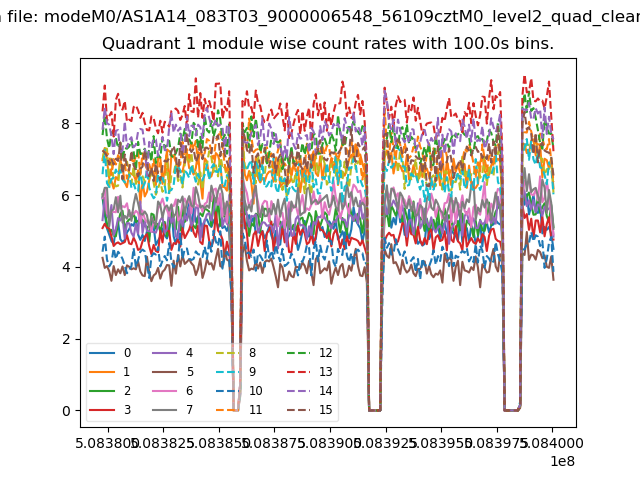
| Module-wise count rates for Quadrant A Data is divided into 100 sec bins |
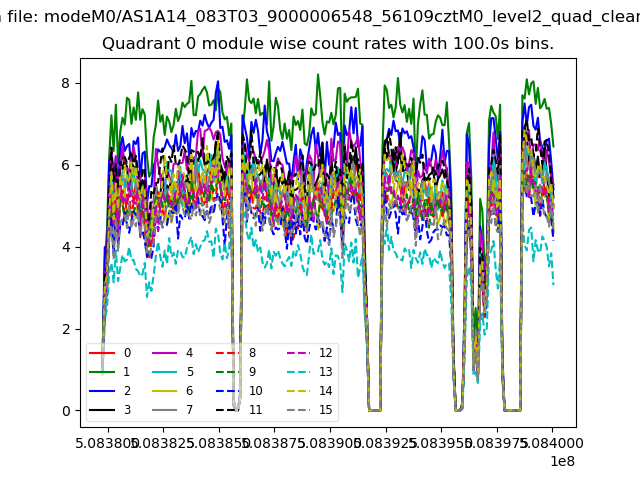 |
 |
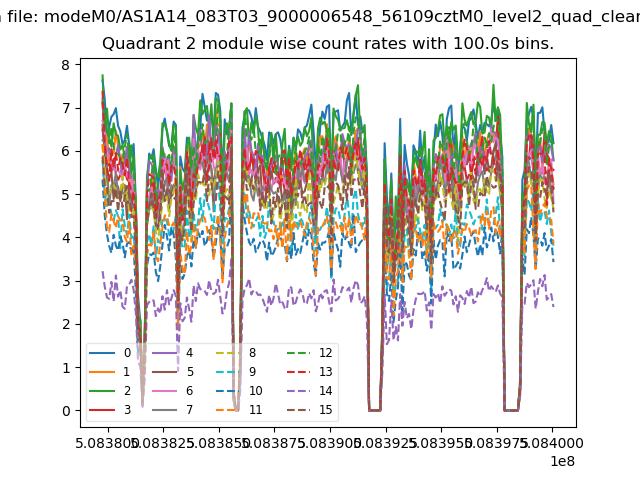
| Module-wise count rates for Quadrant B Data is divided into 100 sec bins |
 |
 |
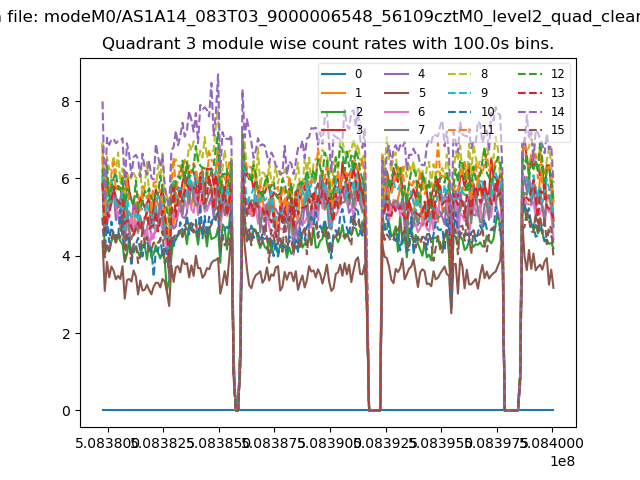
| Module-wise count rates for Quadrant C Data is divided into 100 sec bins |
 |
 |
| Module-wise count rates for Quadrant D Data is divided into 100 sec bins |
 |
 |
| Parameter | Plot |
|---|---|
| CZT HV Monitor | 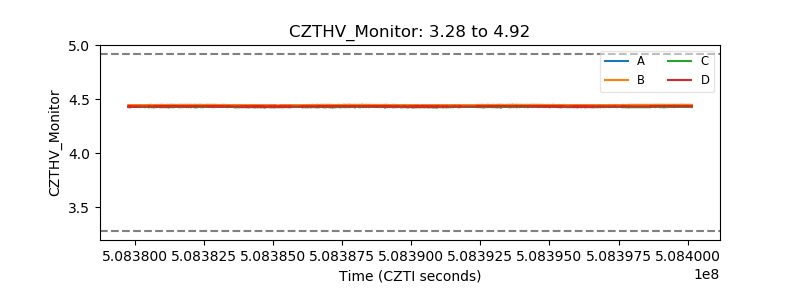 |
| D_VDD | 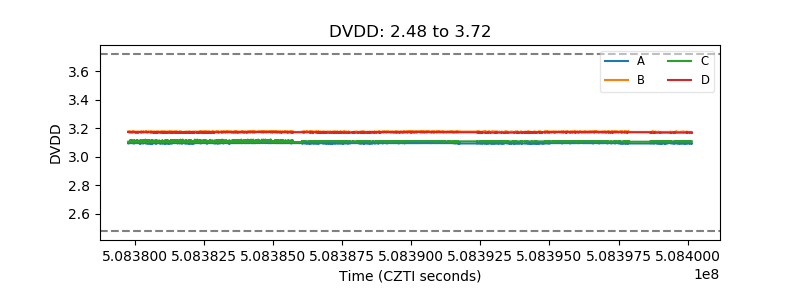 |
| Temperature 1 | 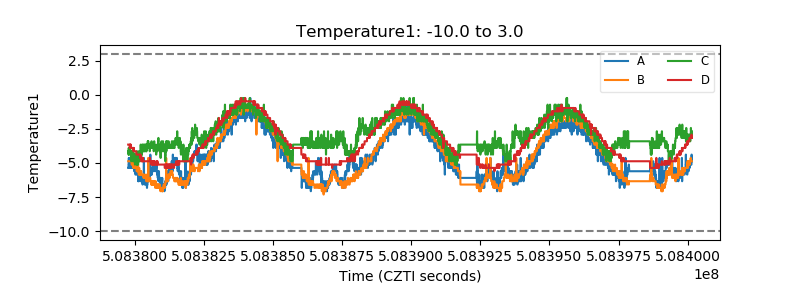 |
| Veto HV Monitor | 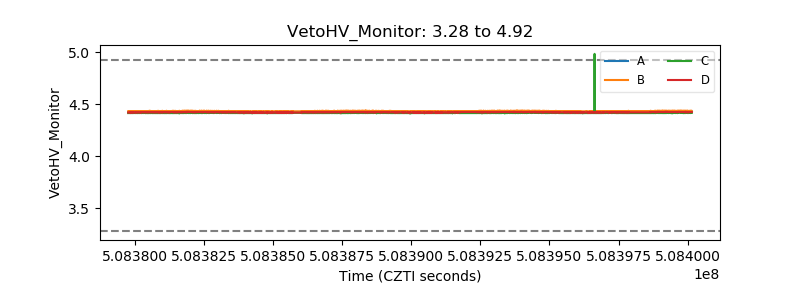 |
| Veto LLD | 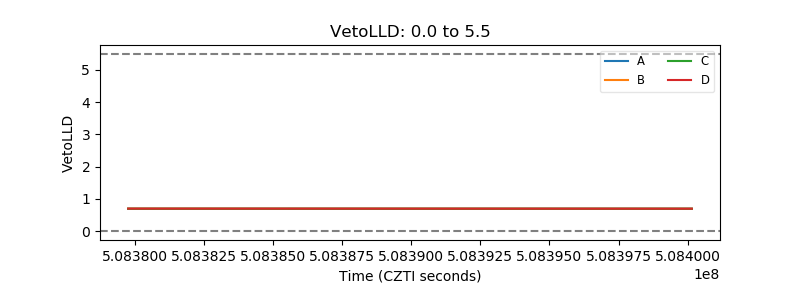 |
| Alpha Counter | 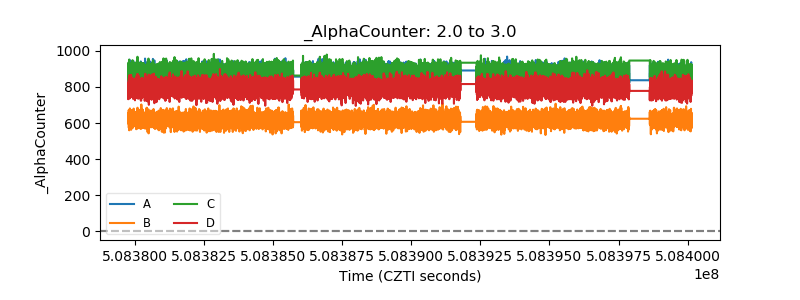 |
| _CPM_Rate | 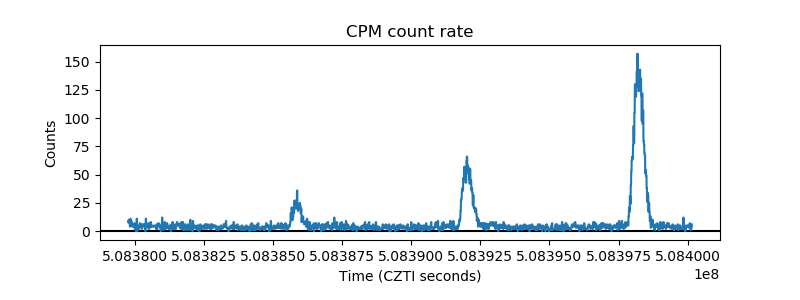 |
| CZT Counter | 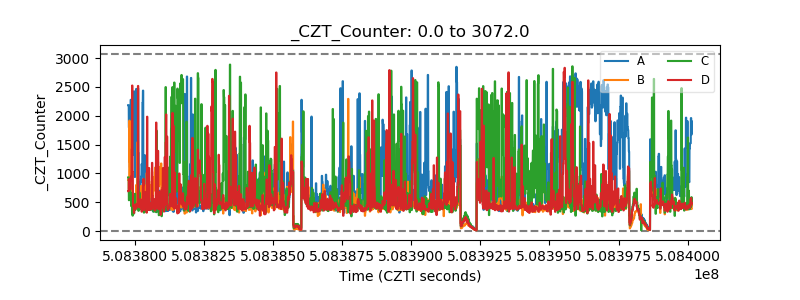 |
| +2.5 Volts monitor |  |
| +5 Volts monitor |  |
| _ROLL_ROT | 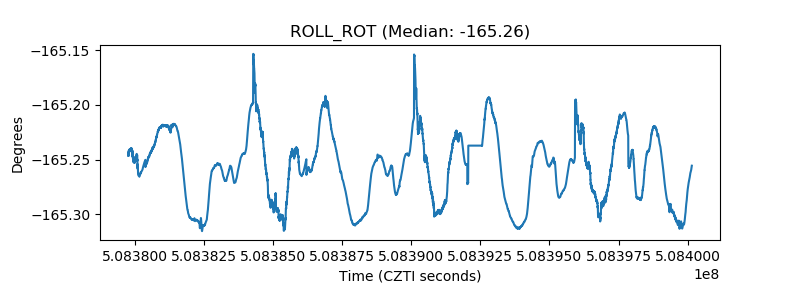 |
| _Roll_DEC | 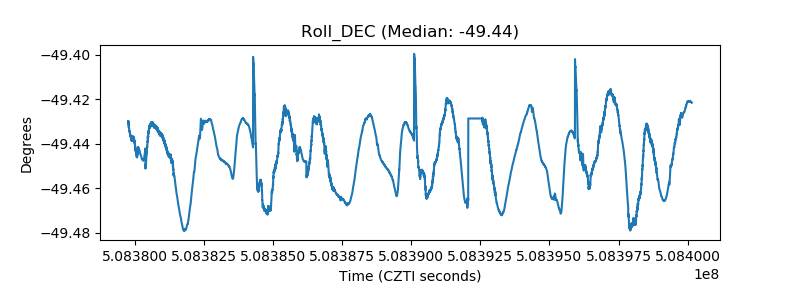 |
| _Roll_RA |  |
| Veto Counter | 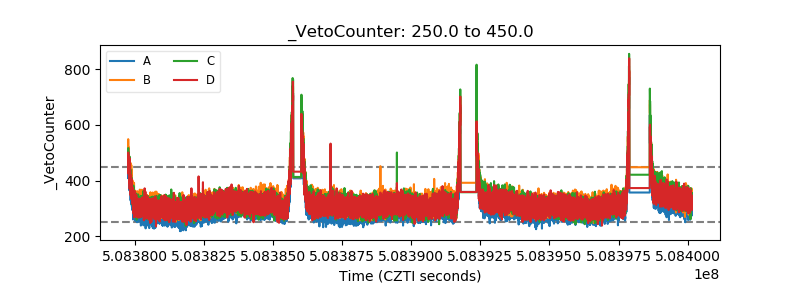 |