| Param | Original file | Final file |
|---|---|---|
| Filename | modeM0/AS1A14_083T03_9000006548_56112cztM0_level2.fits | modeM0/AS1A14_083T03_9000006548_56112cztM0_level2_quad_clean.evt |
| Size (bytes) | 2,886,249,600 | 454,227,840 |
| Size | 2.7 GB | 433.2 MB |
| Events in quadrant A | 37,130,350 | 2,639,203 |
| Events in quadrant B | 17,166,213 | 3,351,307 |
| Events in quadrant C | 29,787,972 | 2,686,745 |
| Events in quadrant D | 20,136,283 | 2,742,135 |
| Mode M0 | |||
|---|---|---|---|
| Quadrant | BADHDUFLAG | Total packets | Discarded packets |
| A | 0 | 133871 | 6 |
| B | 0 | 75046 | 7 |
| C | 0 | 112738 | 6 |
| D | 0 | 84700 | 6 |
| Mode SS | |||
|---|---|---|---|
| Quadrant | BADHDUFLAG | Total packets | Discarded packets |
| A | 0 | 692 | 0 |
| B | 0 | 692 | 0 |
| C | 0 | 692 | 0 |
| D | 0 | 692 | 0 |
| Mode M9 | |||
|---|---|---|---|
| Quadrant | BADHDUFLAG | Total packets | Discarded packets |
| A | 0 | 34 | 0 |
| B | 0 | 34 | 0 |
| C | 0 | 34 | 0 |
| D | 0 | 34 | 0 |
| Quadrant | Total seconds | Saturated seconds | Saturation percentage |
|---|---|---|---|
| A | 33928 | 6286 | 18.527470% |
| B | 33927 | 679 | 2.001356% |
| C | 33928 | 4562 | 13.446121% |
| D | 33928 | 1178 | 3.472058% |
Noise dominated data is calculated using 1-second bins in cleaned event files. If a bin has >2000 counts, and if more than 50% of those come from <1% of pixels, then it is considered to be noise-dominated and hence unusable.
| Quadrant | # 1 sec bins | Bins with >0 counts | Bins with >2000 counts | High rate bins dominated by noise | Noise dominated (total time) | Noise dominated (detector-on time) | Marked lightcurve |
|---|---|---|---|---|---|---|---|
| A | 37503 | 33933 | 5088 | 5088 | 13.57% | 14.99% | 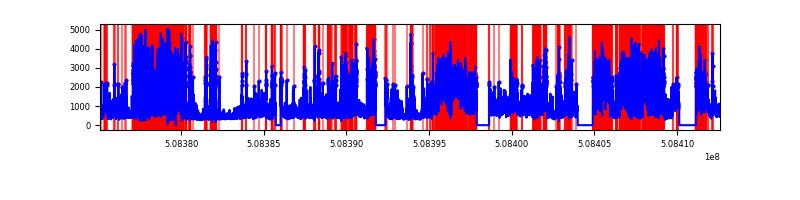 |
| B | 37502 | 33933 | 64 | 64 | 0.17% | 0.19% | 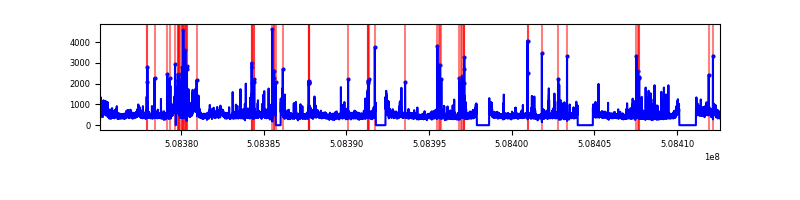 |
| C | 37503 | 33931 | 3250 | 3250 | 8.67% | 9.58% | 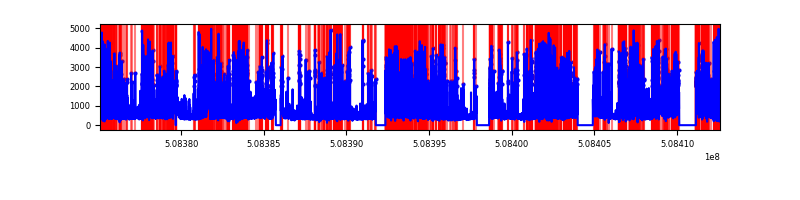 |
| D | 37503 | 33934 | 751 | 751 | 2.00% | 2.21% | 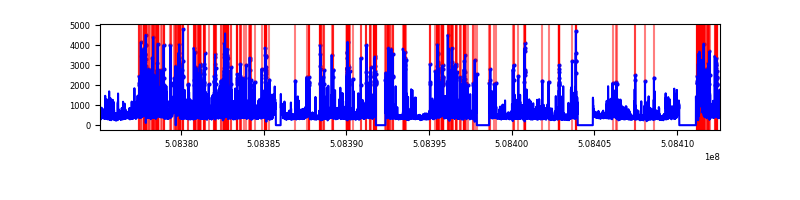 |
Top three noisy pixels from each quadrant. If the there are fewer than three noisy pixels in the level2.evt file, extra rows are filled as -1
| Pixel properties | Quadrant properties | ||||||
|---|---|---|---|---|---|---|---|
| Quadrant | DetID | PixID | Counts | Sigma | Mean | Median | Sigma |
| A | 3 | 14 | 6479603 | 7830.96 | 3360 | 3272 | 827.0 |
| A | 12 | 115 | 5578856 | 6741.81 | 3360 | 3272 | 827.0 |
| A | 7 | 64 | 4959559 | 5992.98 | 3360 | 3272 | 827.0 |
| B | 9 | 254 | 1435587 | 1899.12 | 3568 | 3436 | 754.1 |
| B | 10 | 247 | 347361 | 456.06 | 3568 | 3436 | 754.1 |
| B | 0 | 199 | 253647 | 331.79 | 3568 | 3436 | 754.1 |
| C | 12 | 254 | 13206153 | 14651.82 | 3323 | 3289 | 901.1 |
| C | 12 | 252 | 1296890 | 1435.57 | 3323 | 3289 | 901.1 |
| C | 13 | 3 | 1037404 | 1147.6 | 3323 | 3289 | 901.1 |
| D | 8 | 240 | 2222006 | 2264.86 | 3471 | 3319 | 979.6 |
| D | 11 | 129 | 1340281 | 1364.78 | 3471 | 3319 | 979.6 |
| D | 2 | 249 | 1076025 | 1095.03 | 3471 | 3319 | 979.6 |
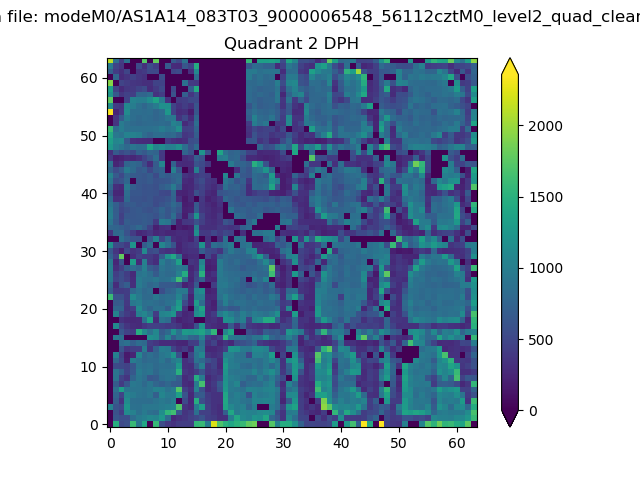
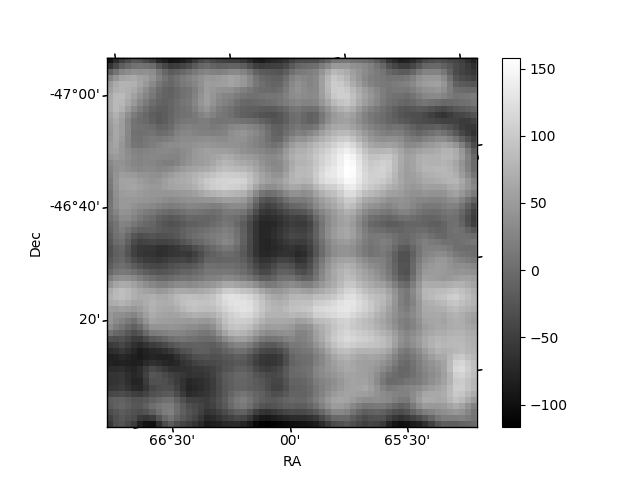
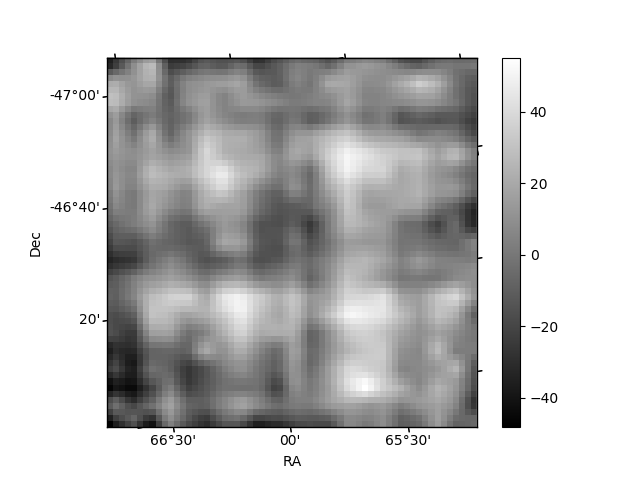
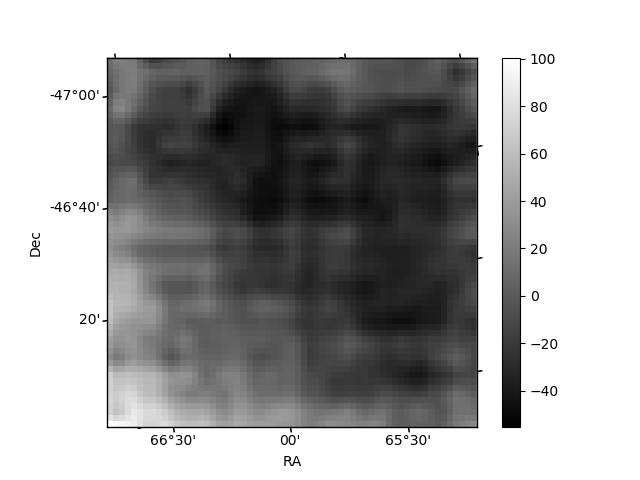
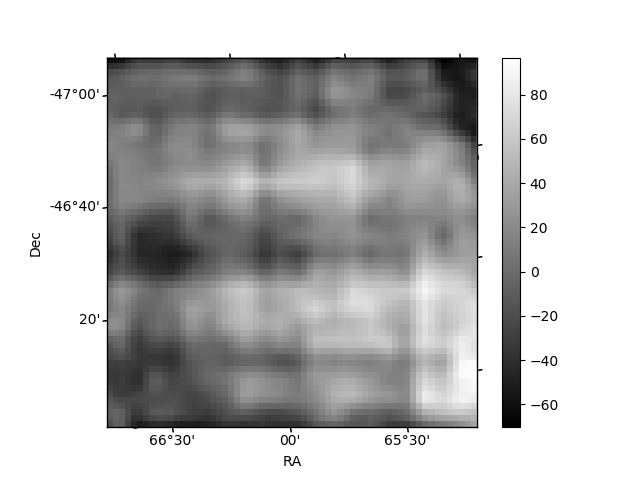
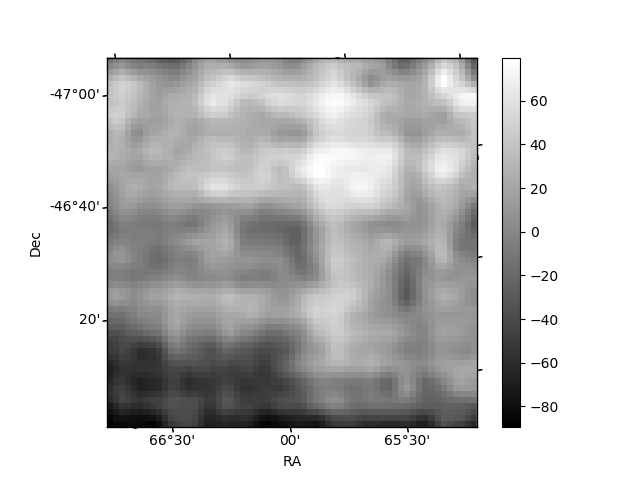
Histogram calculated using DETX and DETY for each event in the final _common_clean file
| Quadrant A | 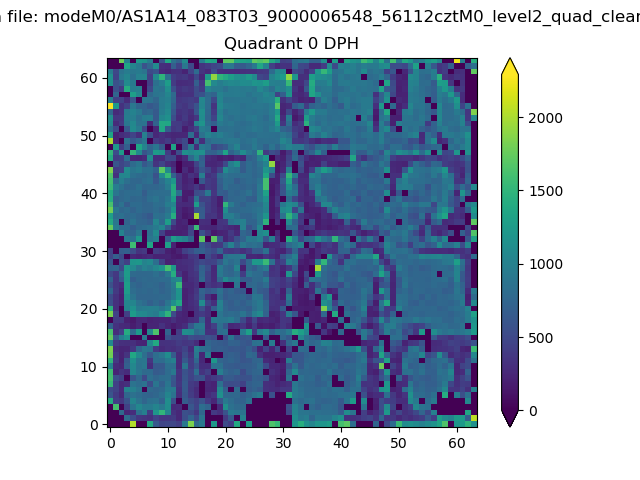 |
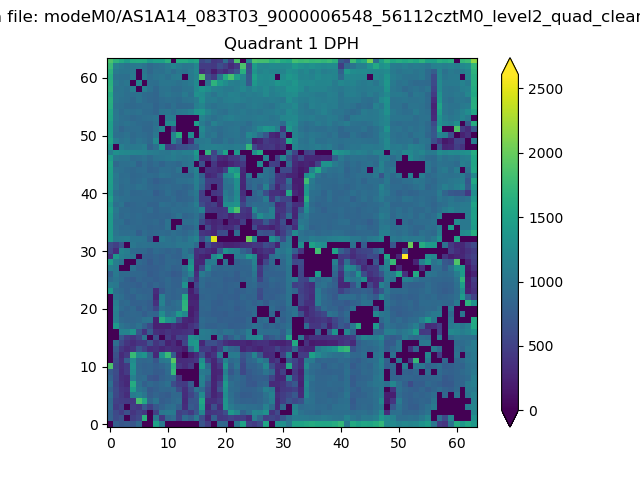 |
Quadrant B |
|---|---|---|---|
| Quadrant D | 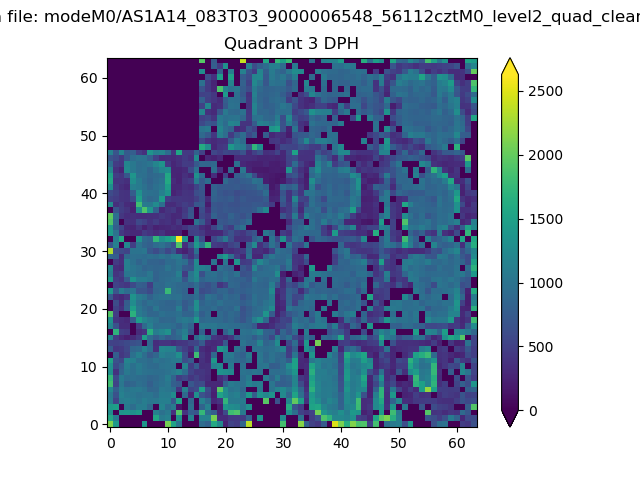 |
 |
Quadrant C |
| Plot type | Count rate plots | Images |
|---|---|---|
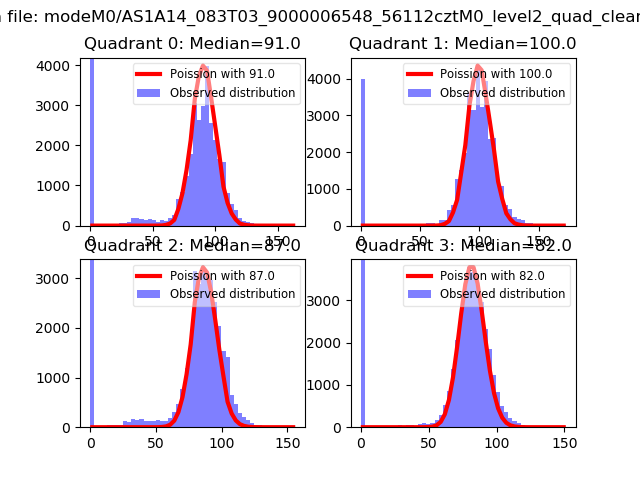
| Comparison with Poisson distribution Blue bars denote a histogram of data divided into 1 sec bins. Red curve is a Poisson curve with rate = median count rate of data. |
 |
 |
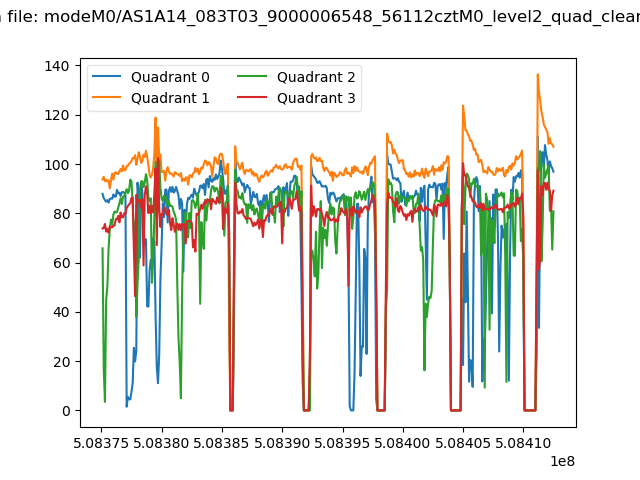
| Quadrant-wise count rates Data is divided into 100 sec bins |
 |
|
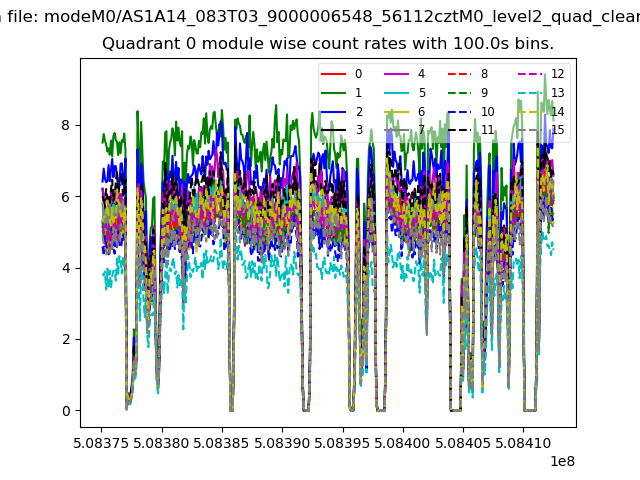
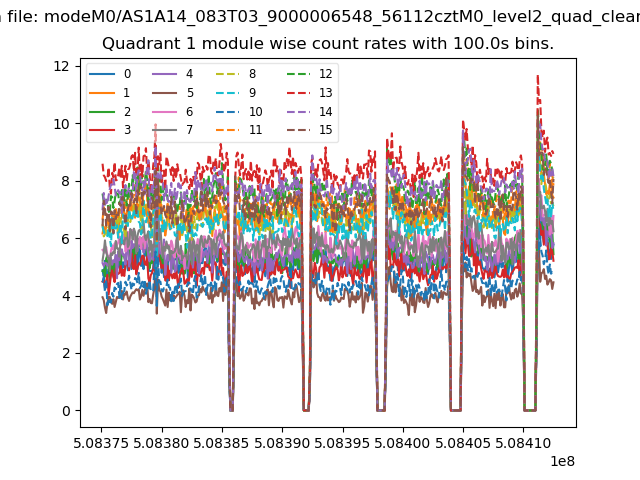
| Module-wise count rates for Quadrant A Data is divided into 100 sec bins |
 |
 |
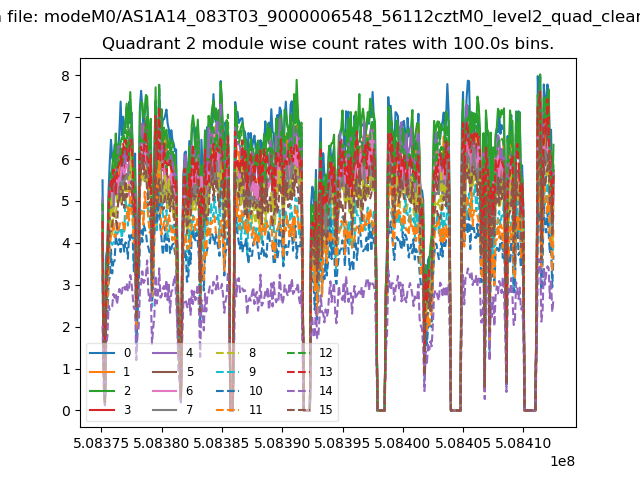
| Module-wise count rates for Quadrant B Data is divided into 100 sec bins |
 |
 |
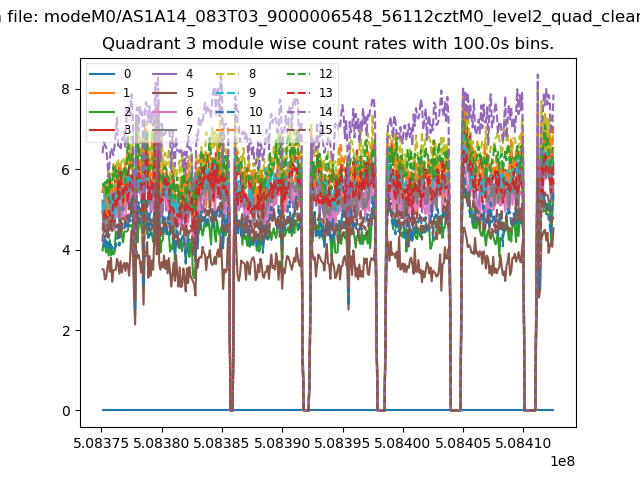
| Module-wise count rates for Quadrant C Data is divided into 100 sec bins |
 |
 |
| Module-wise count rates for Quadrant D Data is divided into 100 sec bins |
 |
 |
| Parameter | Plot |
|---|---|
| CZT HV Monitor | 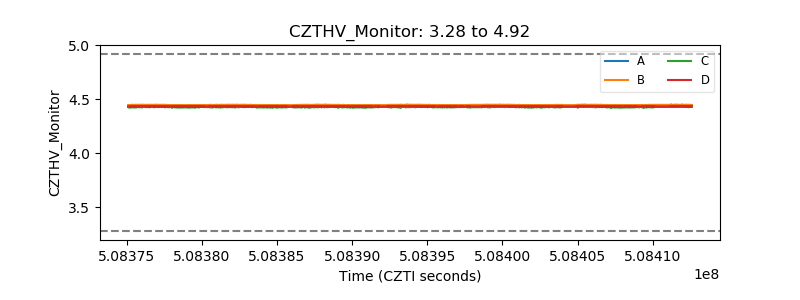 |
| D_VDD | 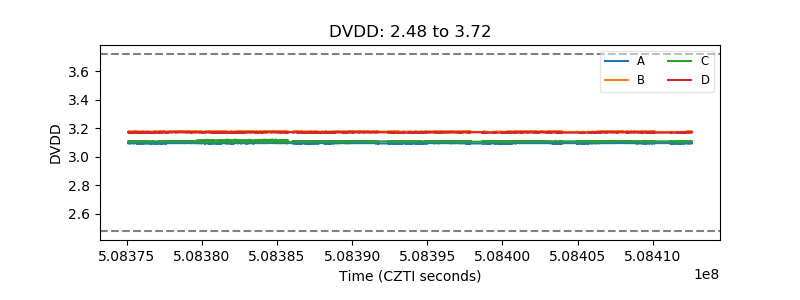 |
| Temperature 1 | 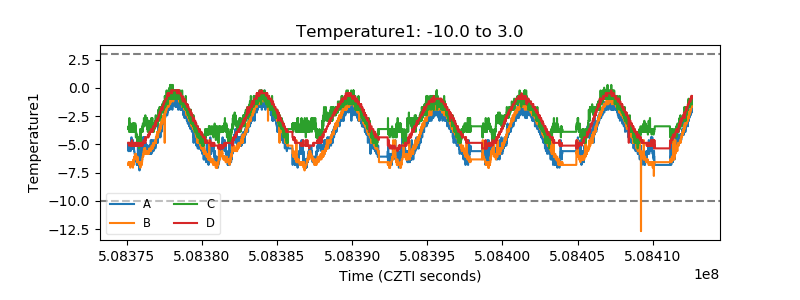 |
| Veto HV Monitor |  |
| Veto LLD | 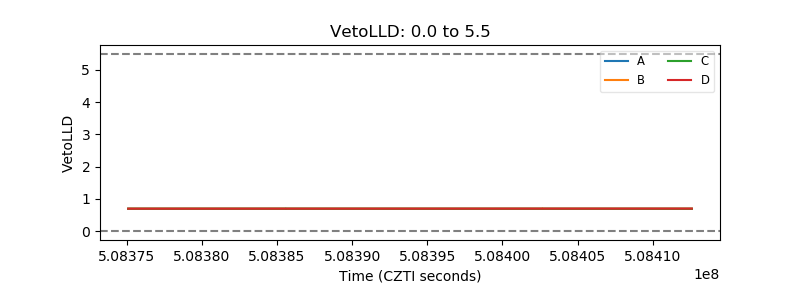 |
| Alpha Counter | 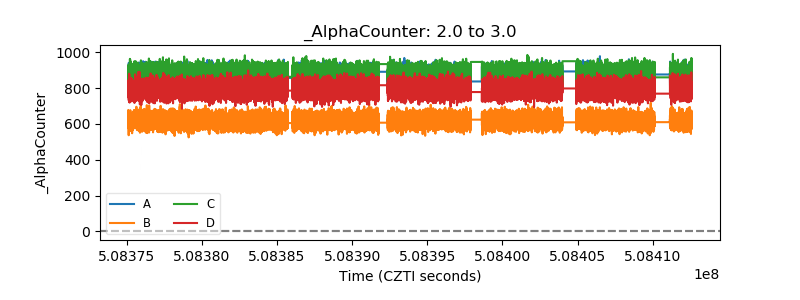 |
| _CPM_Rate | 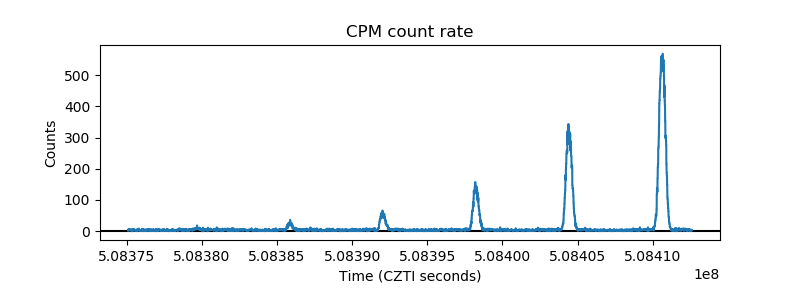 |
| CZT Counter | 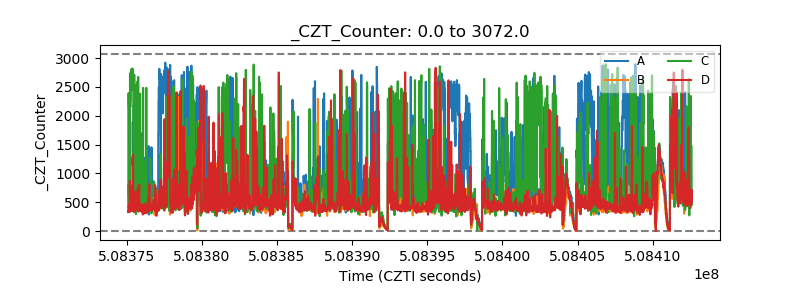 |
| +2.5 Volts monitor | 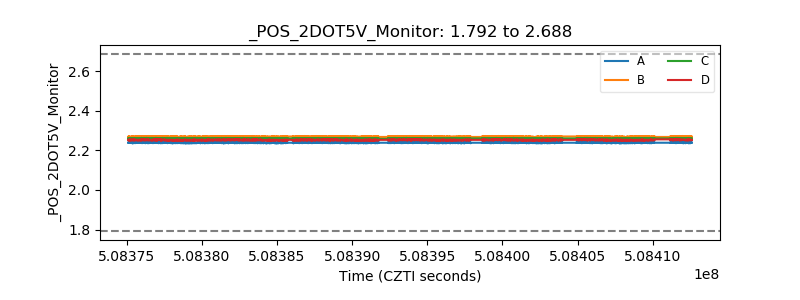 |
| +5 Volts monitor | 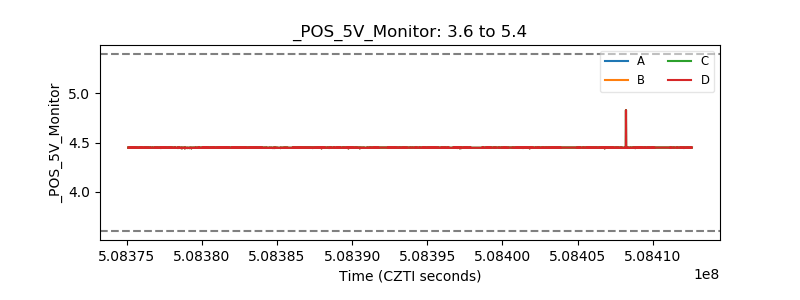 |
| _ROLL_ROT | 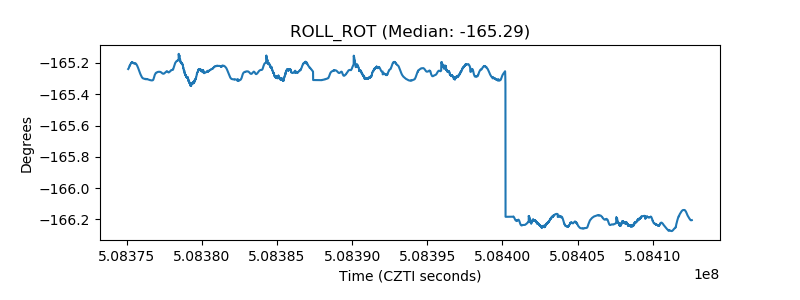 |
| _Roll_DEC | 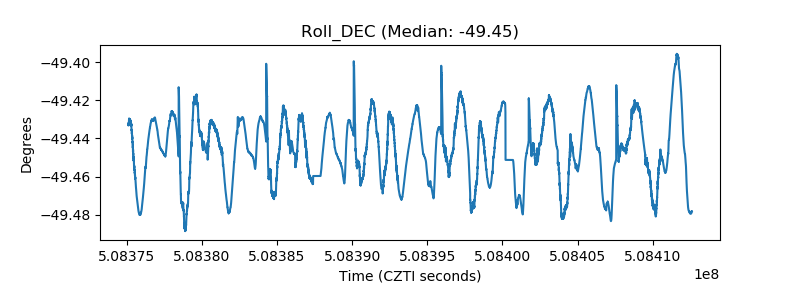 |
| _Roll_RA | 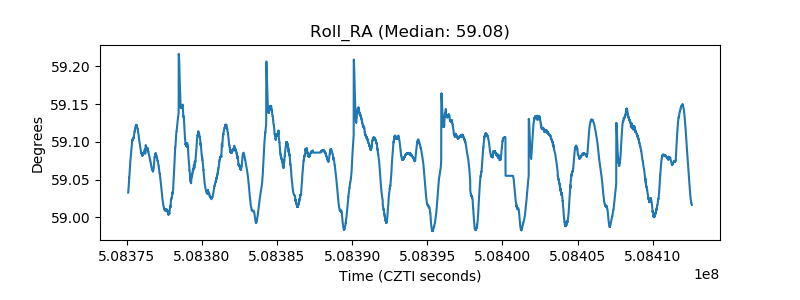 |
| Veto Counter | 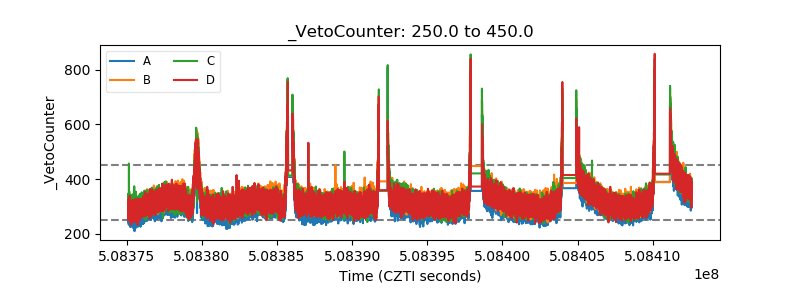 |