| Param | Original file | Final file |
|---|---|---|
| Filename | modeM0/AS1A14_083T03_9000006548_56113cztM0_level2.fits | modeM0/AS1A14_083T03_9000006548_56113cztM0_level2_quad_clean.evt |
| Size (bytes) | 623,638,080 | 90,930,240 |
| Size | 594.7 MB | 86.7 MB |
| Events in quadrant A | 6,840,863 | 541,358 |
| Events in quadrant B | 3,659,766 | 698,057 |
| Events in quadrant C | 7,924,513 | 488,142 |
| Events in quadrant D | 4,151,881 | 568,794 |
| Mode M0 | |||
|---|---|---|---|
| Quadrant | BADHDUFLAG | Total packets | Discarded packets |
| A | 0 | 24817 | 2 |
| B | 0 | 15626 | 2 |
| C | 0 | 28061 | 2 |
| D | 0 | 16952 | 2 |
| Mode SS | |||
|---|---|---|---|
| Quadrant | BADHDUFLAG | Total packets | Discarded packets |
| A | 0 | 134 | 0 |
| B | 0 | 134 | 0 |
| C | 0 | 134 | 0 |
| D | 0 | 134 | 0 |
| Mode M9 | |||
|---|---|---|---|
| Quadrant | BADHDUFLAG | Total packets | Discarded packets |
| A | 0 | 15 | 0 |
| B | 0 | 16 | 0 |
| C | 0 | 16 | 0 |
| D | 0 | 16 | 0 |
| Quadrant | Total seconds | Saturated seconds | Saturation percentage |
|---|---|---|---|
| A | 6546 | 1258 | 19.217843% |
| B | 6546 | 171 | 2.612282% |
| C | 6546 | 1701 | 25.985335% |
| D | 6546 | 310 | 4.735716% |
Noise dominated data is calculated using 1-second bins in cleaned event files. If a bin has >2000 counts, and if more than 50% of those come from <1% of pixels, then it is considered to be noise-dominated and hence unusable.
| Quadrant | # 1 sec bins | Bins with >0 counts | Bins with >2000 counts | High rate bins dominated by noise | Noise dominated (total time) | Noise dominated (detector-on time) | Marked lightcurve |
|---|---|---|---|---|---|---|---|
| A | 7666 | 6547 | 991 | 991 | 12.93% | 15.14% | 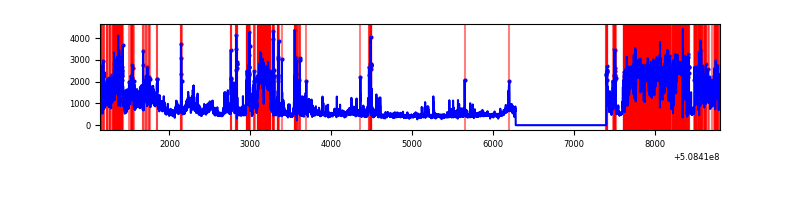 |
| B | 7666 | 6547 | 17 | 17 | 0.22% | 0.26% | 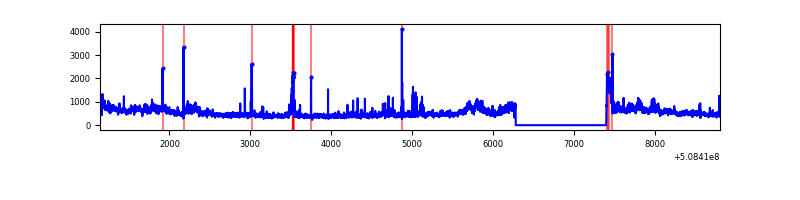 |
| C | 7666 | 6547 | 1476 | 1476 | 19.25% | 22.54% | 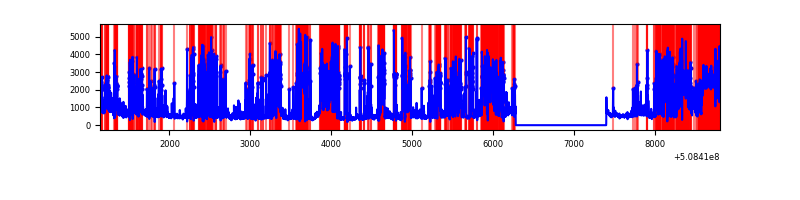 |
| D | 7666 | 6547 | 211 | 211 | 2.75% | 3.22% | 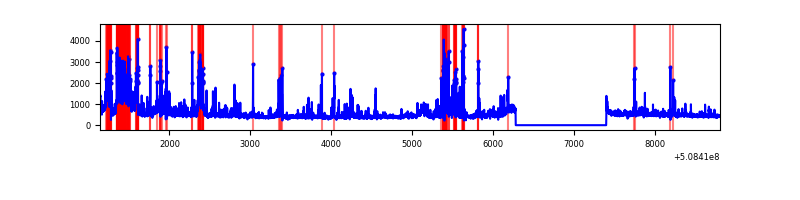 |
Top three noisy pixels from each quadrant. If the there are fewer than three noisy pixels in the level2.evt file, extra rows are filled as -1
| Pixel properties | Quadrant properties | ||||||
|---|---|---|---|---|---|---|---|
| Quadrant | DetID | PixID | Counts | Sigma | Mean | Median | Sigma |
| A | 12 | 115 | 3288782 | 19584.21 | 677 | 661 | 167.9 |
| A | 15 | 32 | 367834 | 2186.9 | 677 | 661 | 167.9 |
| A | 3 | 14 | 276184 | 1641.03 | 677 | 661 | 167.9 |
| B | 9 | 254 | 563456 | 3706.57 | 715 | 690 | 151.8 |
| B | 0 | 199 | 87737 | 573.32 | 715 | 690 | 151.8 |
| B | 4 | 171 | 53517 | 347.94 | 715 | 690 | 151.8 |
| C | 13 | 3 | 4300193 | 25827.53 | 610 | 604 | 166.5 |
| C | 12 | 254 | 552414 | 3314.71 | 610 | 604 | 166.5 |
| C | 9 | 38 | 445467 | 2672.28 | 610 | 604 | 166.5 |
| D | 8 | 240 | 647908 | 3284.47 | 698 | 668 | 197.1 |
| D | 2 | 249 | 409017 | 2072.2 | 698 | 668 | 197.1 |
| D | 6 | 239 | 102934 | 518.96 | 698 | 668 | 197.1 |
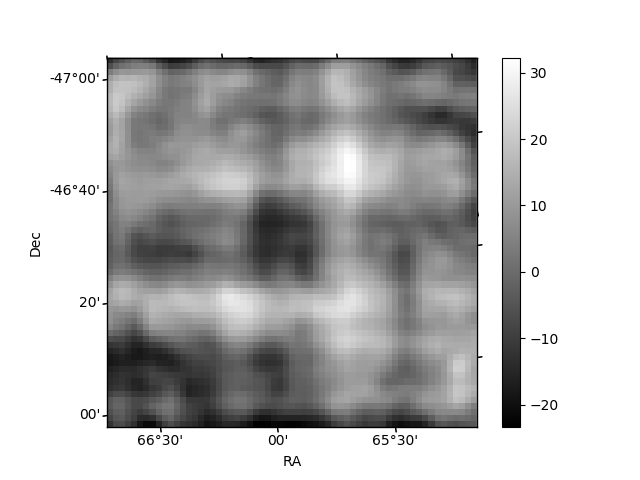
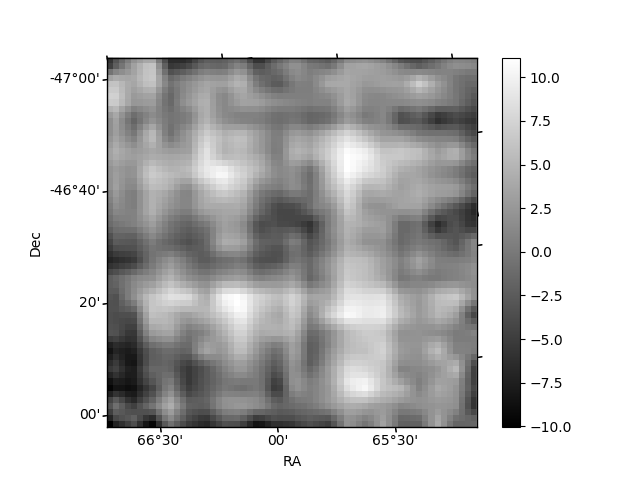
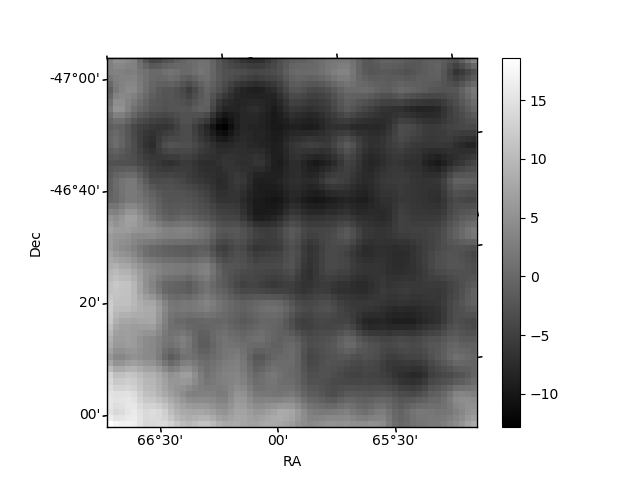
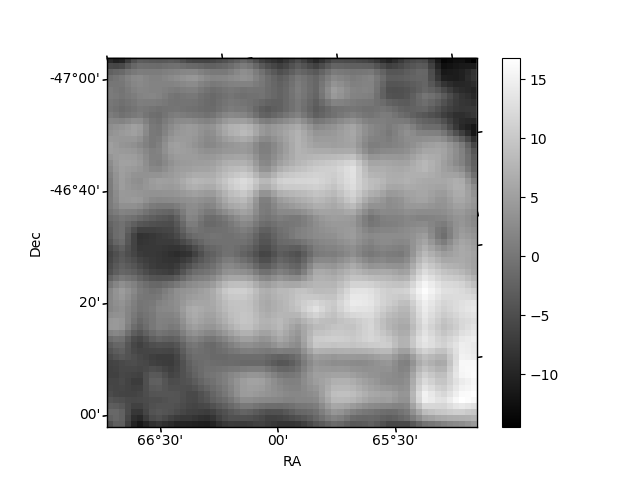
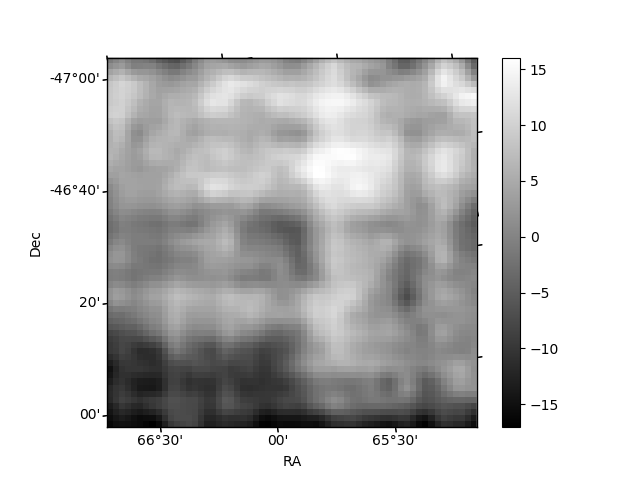
Histogram calculated using DETX and DETY for each event in the final _common_clean file
| Quadrant A | 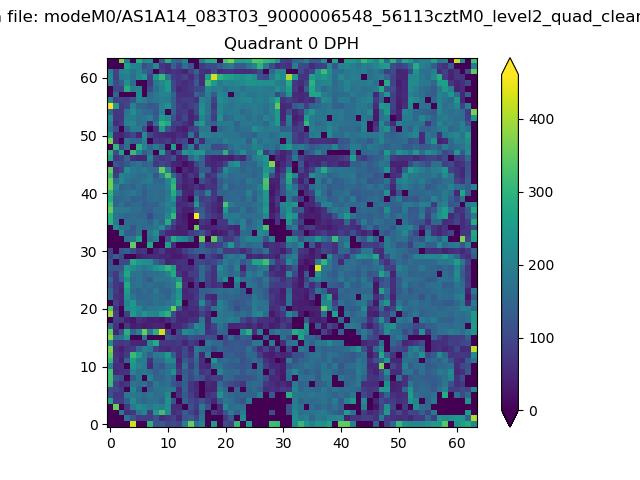 |
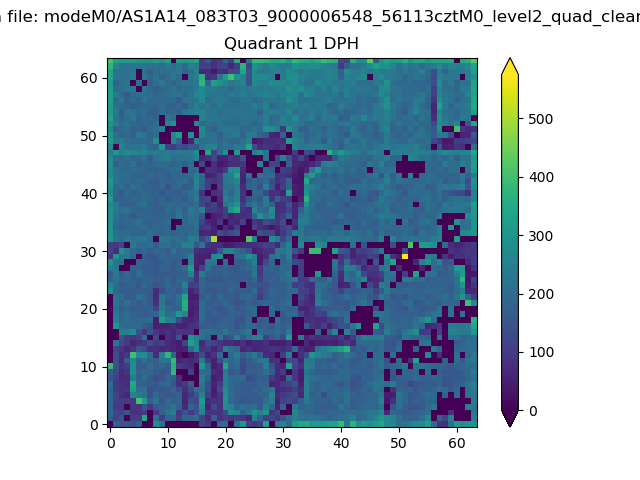 |
Quadrant B |
|---|---|---|---|
| Quadrant D | 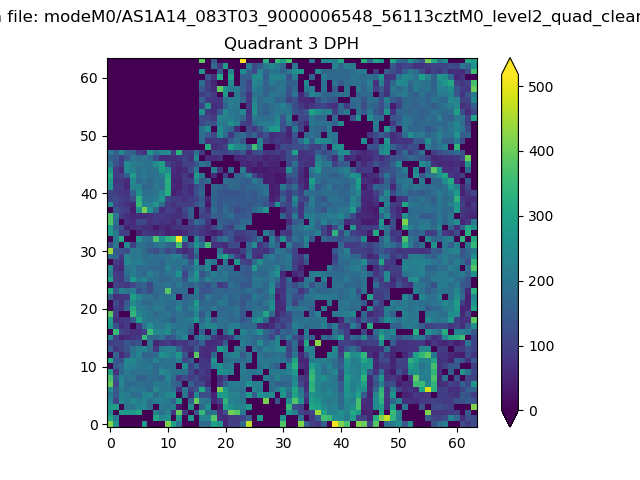 |
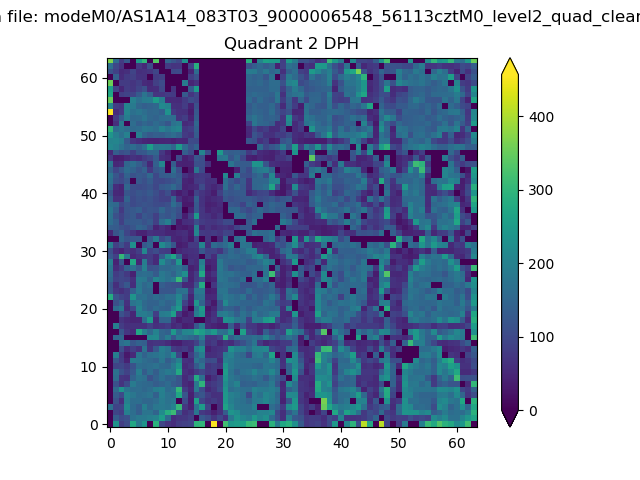 |
Quadrant C |
| Plot type | Count rate plots | Images |
|---|---|---|
| Comparison with Poisson distribution Blue bars denote a histogram of data divided into 1 sec bins. Red curve is a Poisson curve with rate = median count rate of data. |
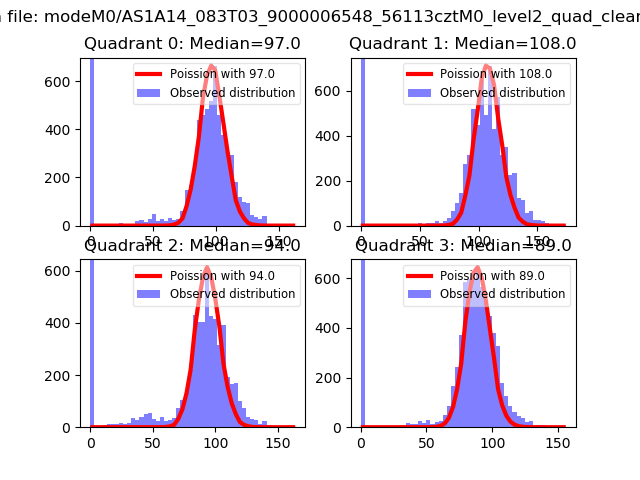 |
 |
| Quadrant-wise count rates Data is divided into 100 sec bins |
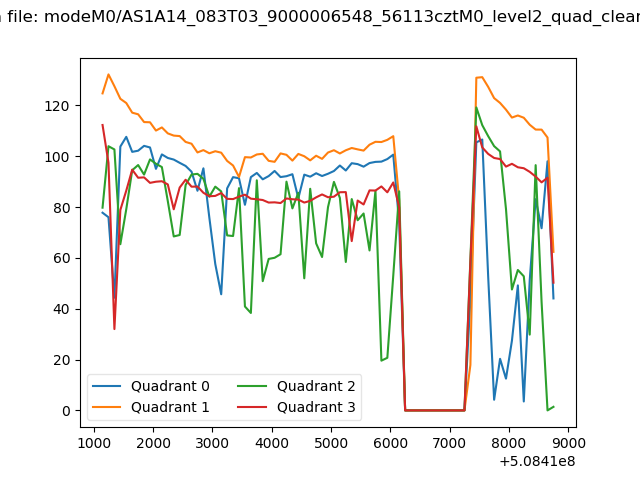 |
|
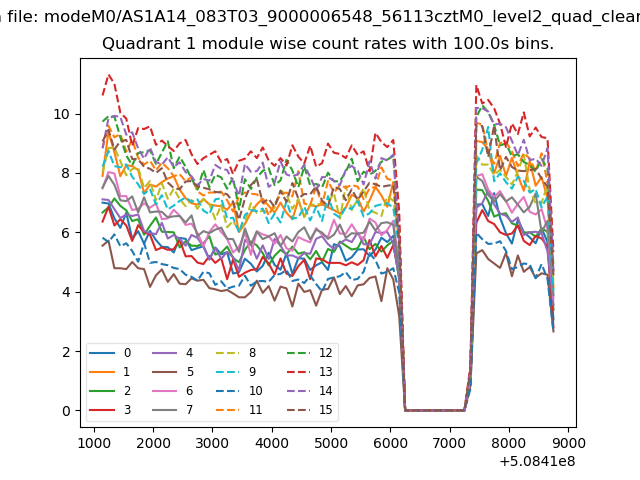
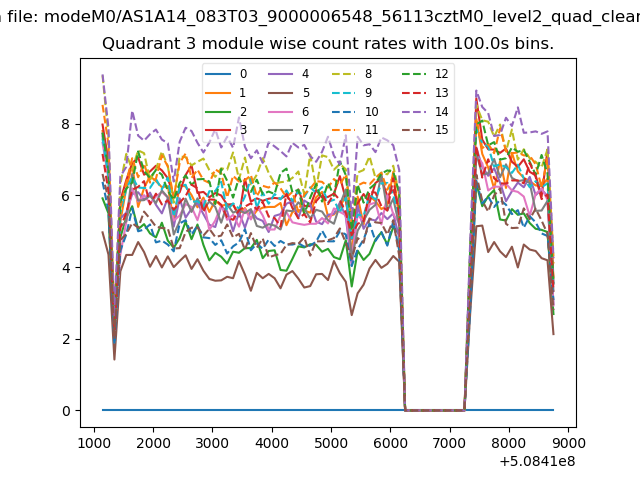
| Module-wise count rates for Quadrant A Data is divided into 100 sec bins |
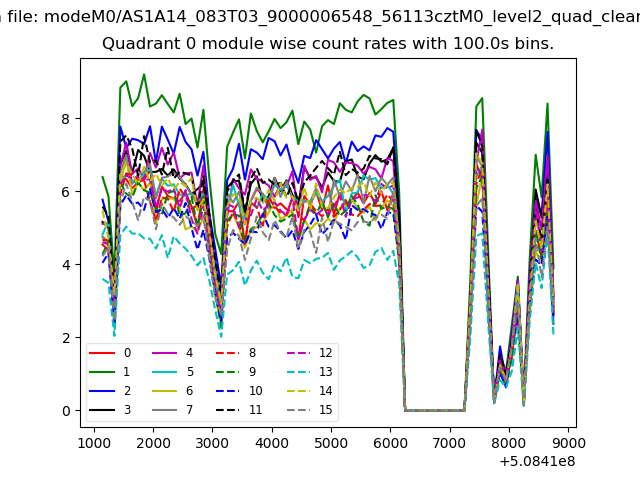 |
 |
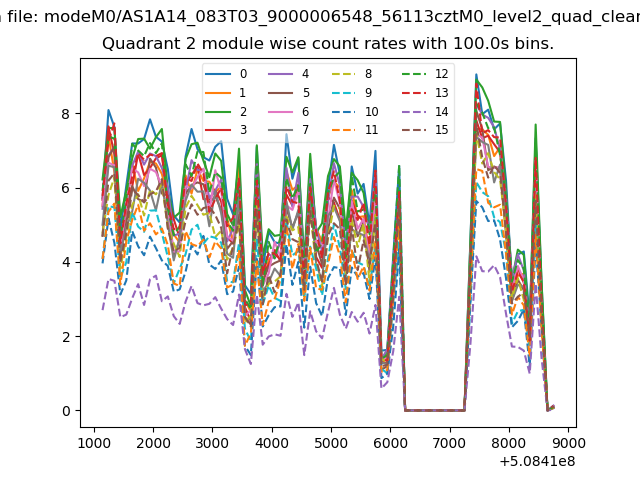
| Module-wise count rates for Quadrant B Data is divided into 100 sec bins |
 |
 |
| Module-wise count rates for Quadrant C Data is divided into 100 sec bins |
 |
 |
| Module-wise count rates for Quadrant D Data is divided into 100 sec bins |
 |
 |
| Parameter | Plot |
|---|---|
| CZT HV Monitor | 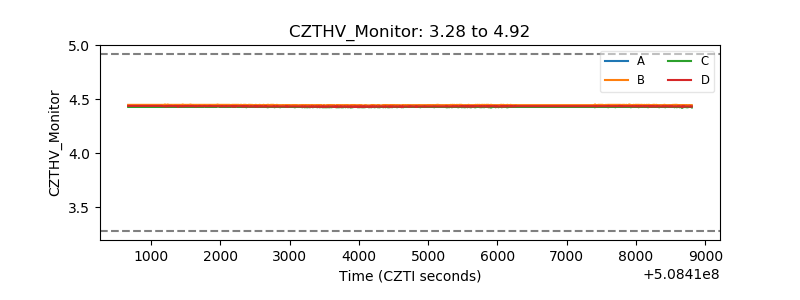 |
| D_VDD | 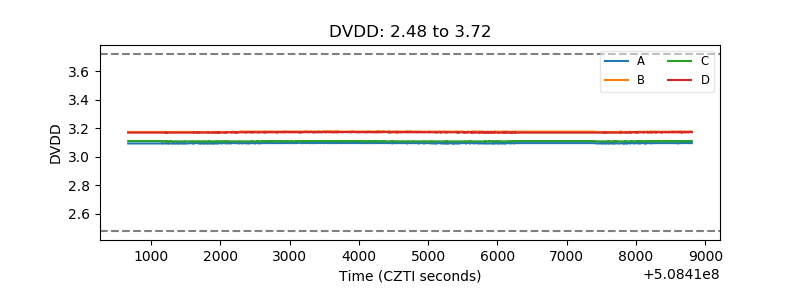 |
| Temperature 1 | 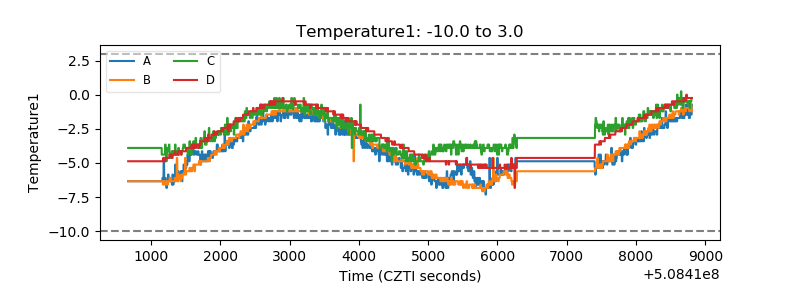 |
| Veto HV Monitor | 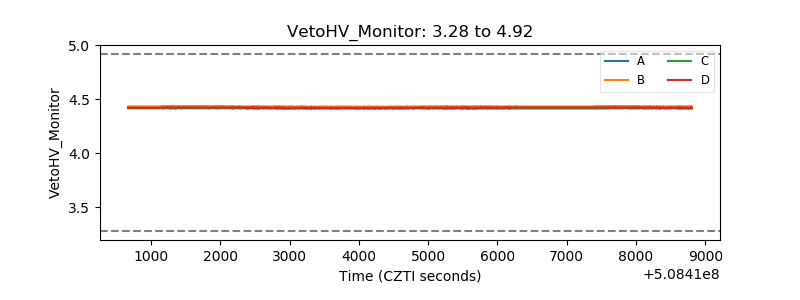 |
| Veto LLD | 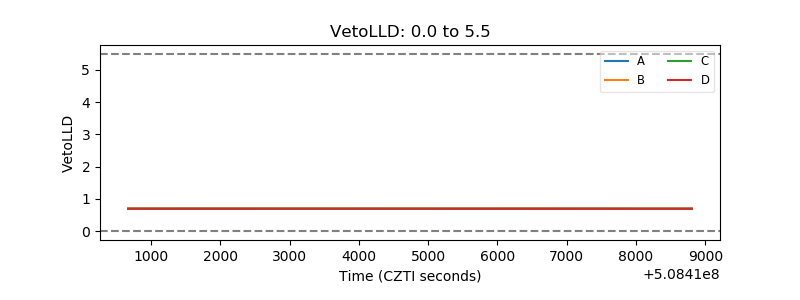 |
| Alpha Counter | 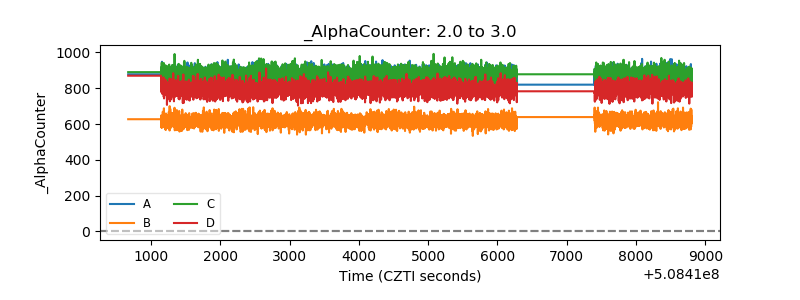 |
| _CPM_Rate | 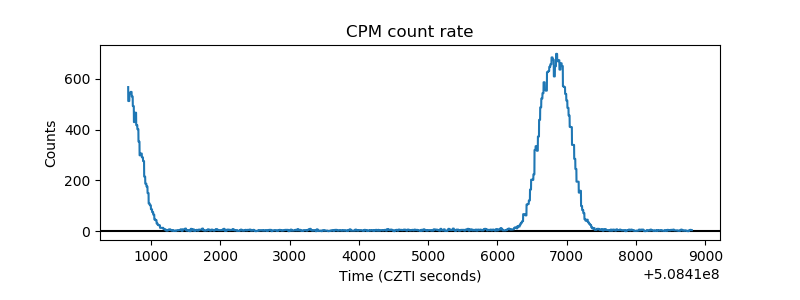 |
| CZT Counter | 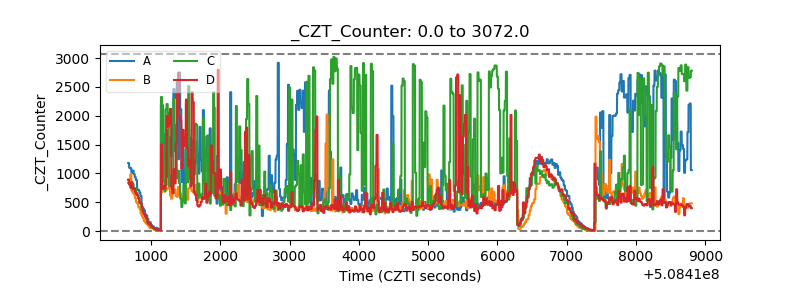 |
| +2.5 Volts monitor | 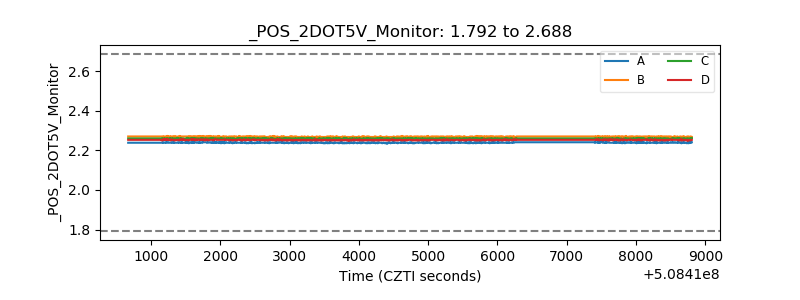 |
| +5 Volts monitor | 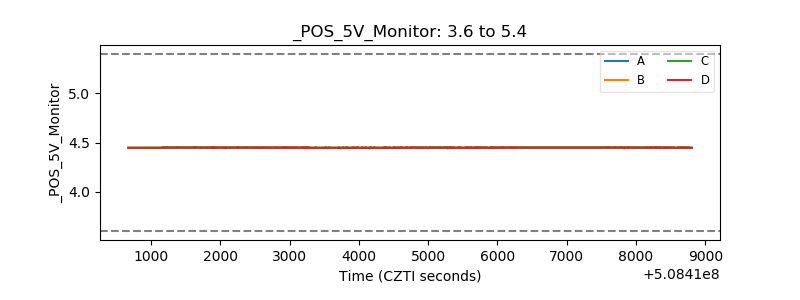 |
| _ROLL_ROT | 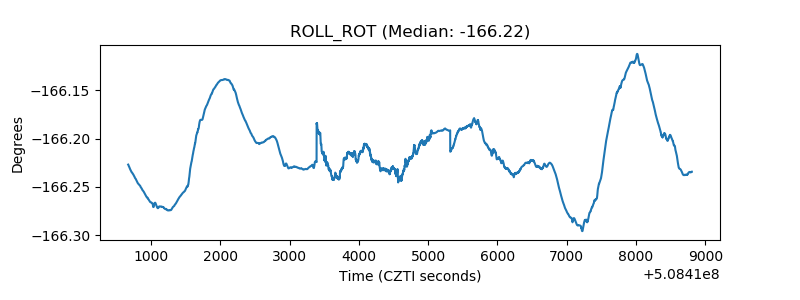 |
| _Roll_DEC | 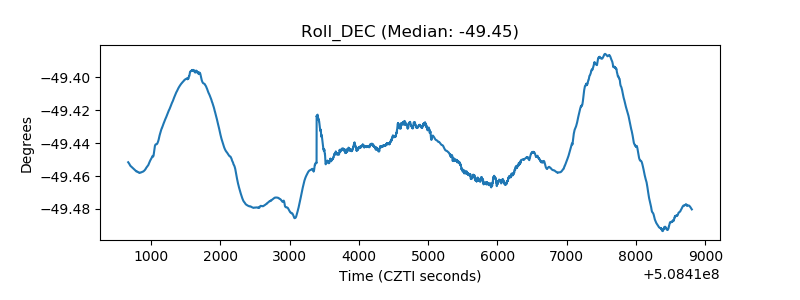 |
| _Roll_RA | 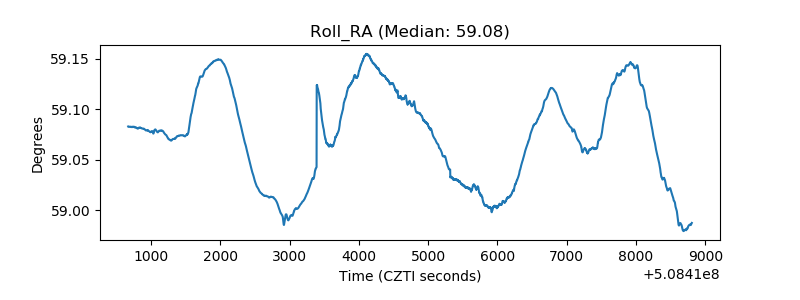 |
| Veto Counter | 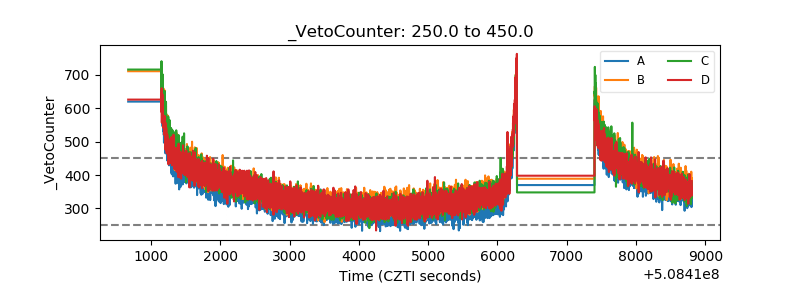 |