| Param | Original file | Final file |
|---|---|---|
| Filename | modeM0/AS1A14_083T03_9000006548_56114cztM0_level2.fits | modeM0/AS1A14_083T03_9000006548_56114cztM0_level2_quad_clean.evt |
| Size (bytes) | 679,950,720 | 84,738,240 |
| Size | 648.5 MB | 80.8 MB |
| Events in quadrant A | 9,940,486 | 376,870 |
| Events in quadrant B | 3,430,229 | 687,372 |
| Events in quadrant C | 7,655,398 | 480,762 |
| Events in quadrant D | 3,642,319 | 570,293 |
| Mode M0 | |||
|---|---|---|---|
| Quadrant | BADHDUFLAG | Total packets | Discarded packets |
| A | 0 | 33928 | 1 |
| B | 0 | 14674 | 1 |
| C | 0 | 27250 | 1 |
| D | 0 | 15306 | 1 |
| Mode SS | |||
|---|---|---|---|
| Quadrant | BADHDUFLAG | Total packets | Discarded packets |
| A | 0 | 130 | 0 |
| B | 0 | 130 | 0 |
| C | 0 | 130 | 0 |
| D | 0 | 130 | 0 |
| Mode M9 | |||
|---|---|---|---|
| Quadrant | BADHDUFLAG | Total packets | Discarded packets |
| A | 0 | 11 | 0 |
| B | 0 | 11 | 0 |
| C | 0 | 11 | 0 |
| D | 0 | 11 | 0 |
| Quadrant | Total seconds | Saturated seconds | Saturation percentage |
|---|---|---|---|
| A | 6455 | 2772 | 42.943455% |
| B | 6455 | 161 | 2.494191% |
| C | 6456 | 1601 | 24.798637% |
| D | 6456 | 159 | 2.462825% |
Noise dominated data is calculated using 1-second bins in cleaned event files. If a bin has >2000 counts, and if more than 50% of those come from <1% of pixels, then it is considered to be noise-dominated and hence unusable.
| Quadrant | # 1 sec bins | Bins with >0 counts | Bins with >2000 counts | High rate bins dominated by noise | Noise dominated (total time) | Noise dominated (detector-on time) | Marked lightcurve |
|---|---|---|---|---|---|---|---|
| A | 7584 | 6454 | 2457 | 2457 | 32.40% | 38.07% | 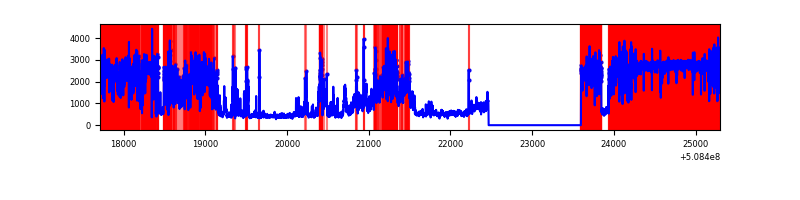 |
| B | 7585 | 6456 | 51 | 51 | 0.67% | 0.79% | 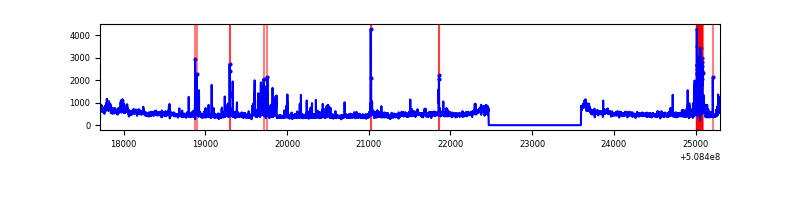 |
| C | 7586 | 6457 | 1467 | 1467 | 19.34% | 22.72% | 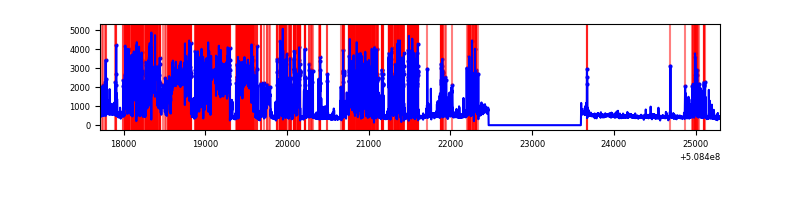 |
| D | 7586 | 6457 | 91 | 91 | 1.20% | 1.41% | 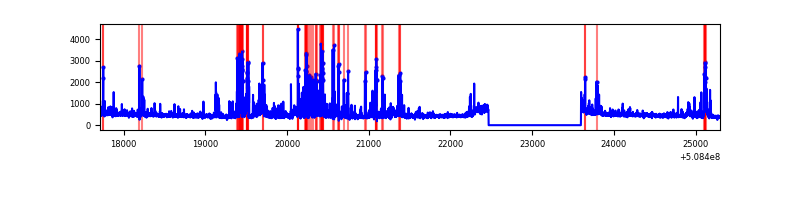 |
Top three noisy pixels from each quadrant. If the there are fewer than three noisy pixels in the level2.evt file, extra rows are filled as -1
| Pixel properties | Quadrant properties | ||||||
|---|---|---|---|---|---|---|---|
| Quadrant | DetID | PixID | Counts | Sigma | Mean | Median | Sigma |
| A | 12 | 115 | 6812980 | 50016.06 | 551 | 539 | 136.2 |
| A | 15 | 32 | 380882 | 2792.43 | 551 | 539 | 136.2 |
| A | 3 | 94 | 338418 | 2480.66 | 551 | 539 | 136.2 |
| B | 4 | 171 | 290206 | 1948.22 | 696 | 673 | 148.6 |
| B | 9 | 254 | 204826 | 1373.71 | 696 | 673 | 148.6 |
| B | 10 | 247 | 42352 | 280.45 | 696 | 673 | 148.6 |
| C | 13 | 3 | 4938341 | 29731.96 | 604 | 598 | 166.1 |
| C | 9 | 38 | 183128 | 1099.08 | 604 | 598 | 166.1 |
| C | 12 | 252 | 76933 | 459.64 | 604 | 598 | 166.1 |
| D | 2 | 249 | 274867 | 1430.26 | 681 | 652 | 191.7 |
| D | 8 | 240 | 264774 | 1377.61 | 681 | 652 | 191.7 |
| D | 6 | 239 | 111318 | 577.21 | 681 | 652 | 191.7 |
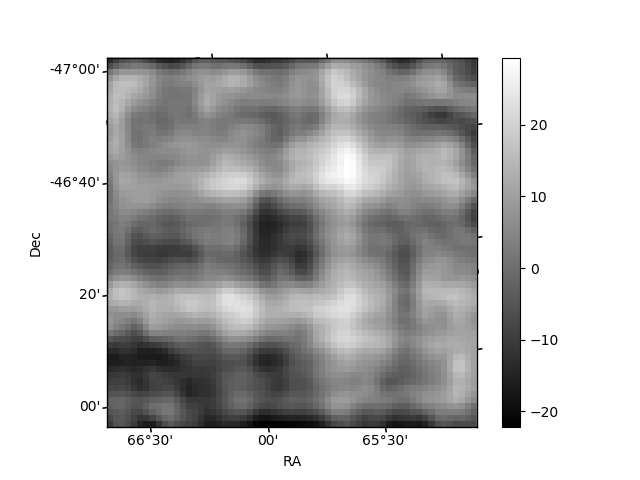
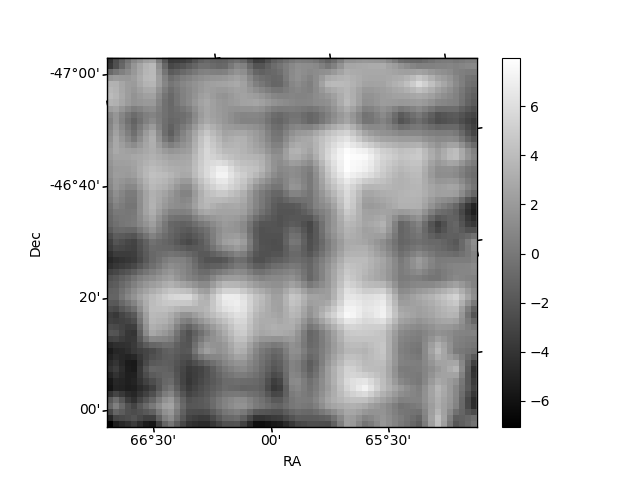
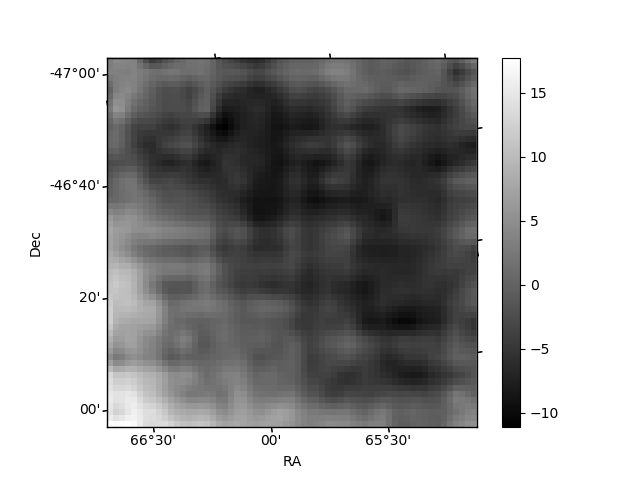
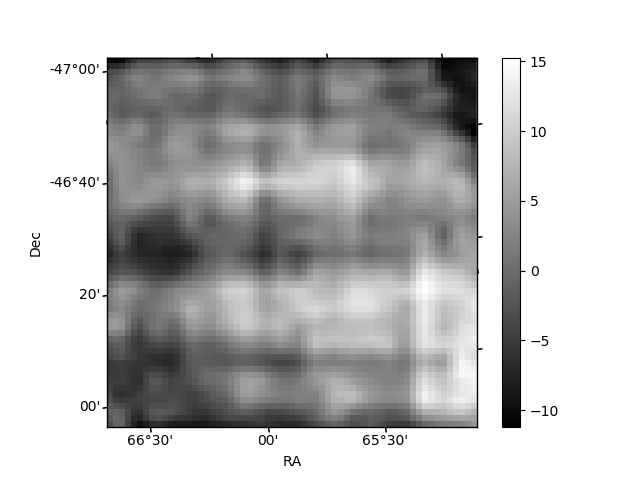
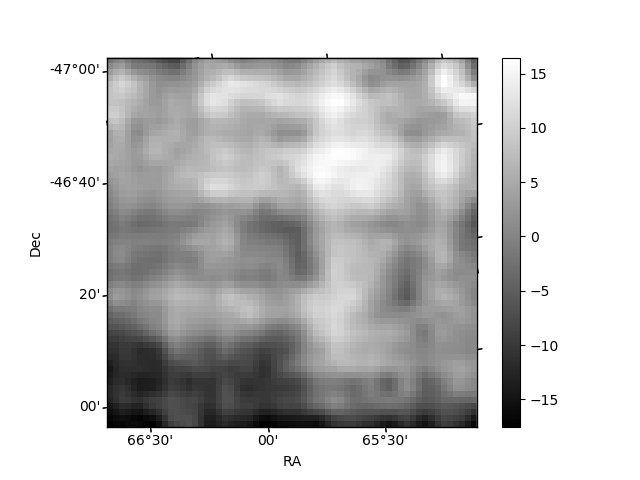
Histogram calculated using DETX and DETY for each event in the final _common_clean file
| Quadrant A | 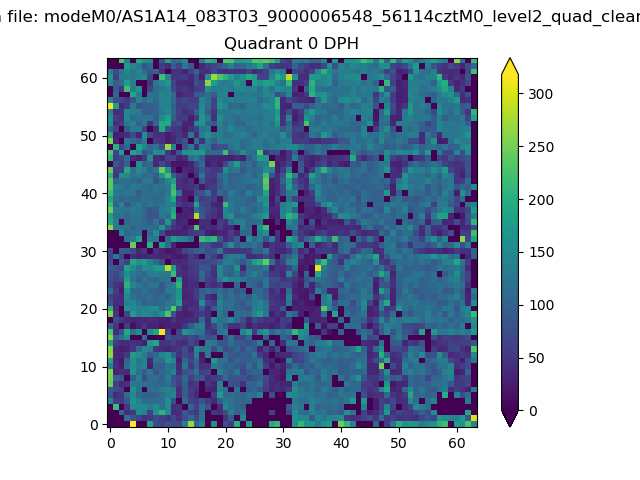 |
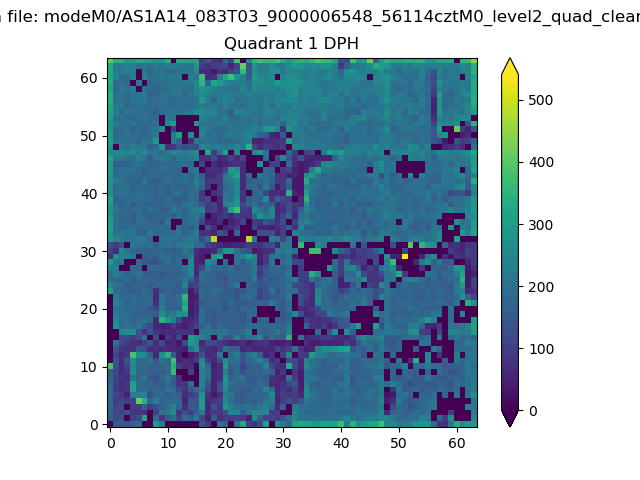 |
Quadrant B |
|---|---|---|---|
| Quadrant D | 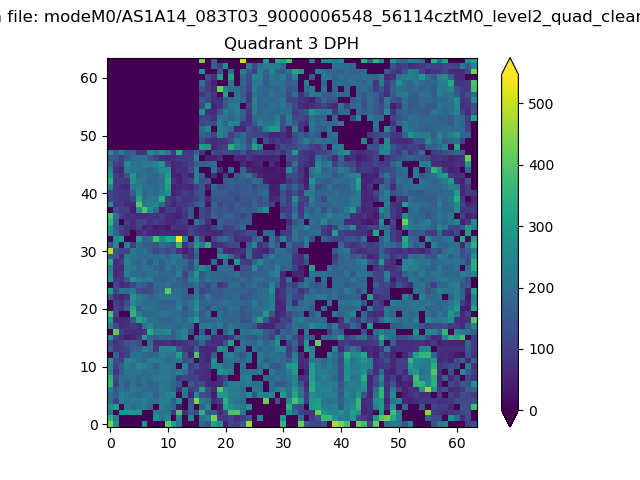 |
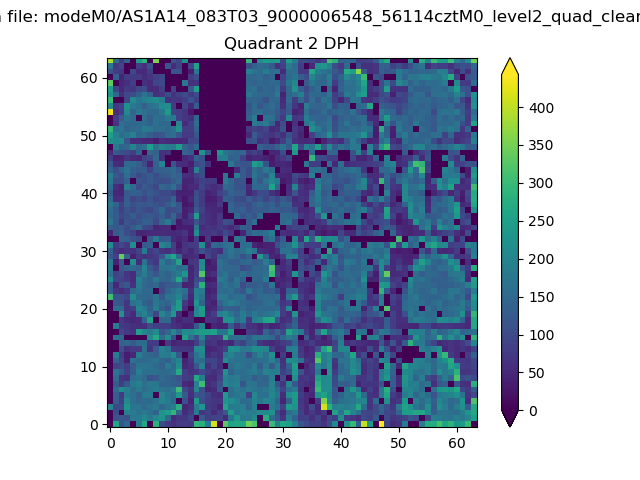 |
Quadrant C |
| Plot type | Count rate plots | Images |
|---|---|---|
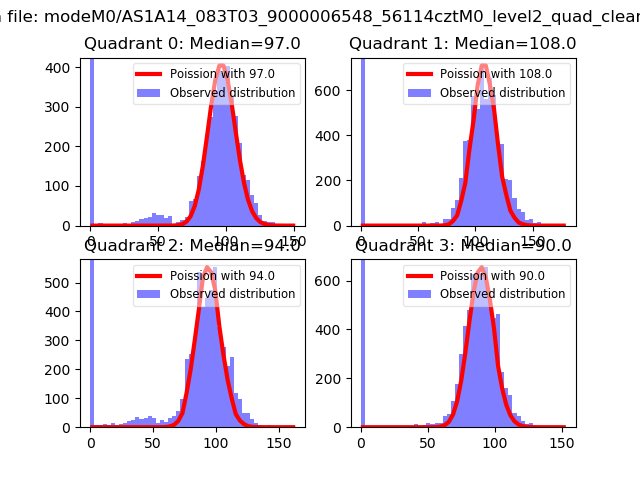
| Comparison with Poisson distribution Blue bars denote a histogram of data divided into 1 sec bins. Red curve is a Poisson curve with rate = median count rate of data. |
 |
 |
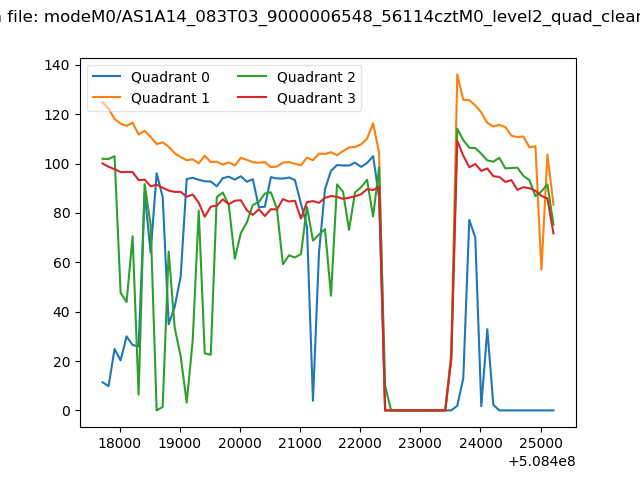
| Quadrant-wise count rates Data is divided into 100 sec bins |
 |
|
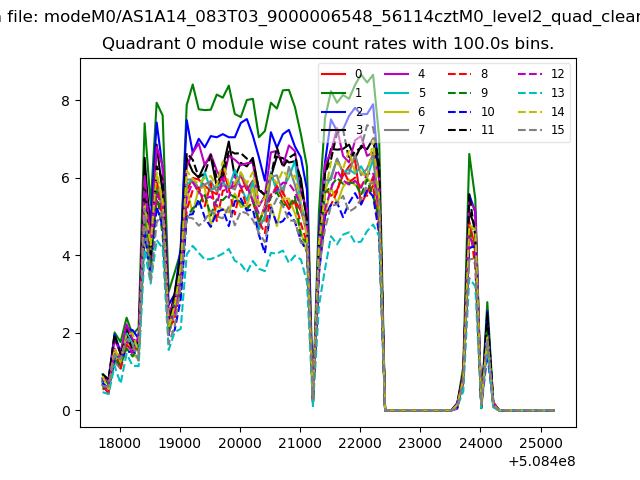
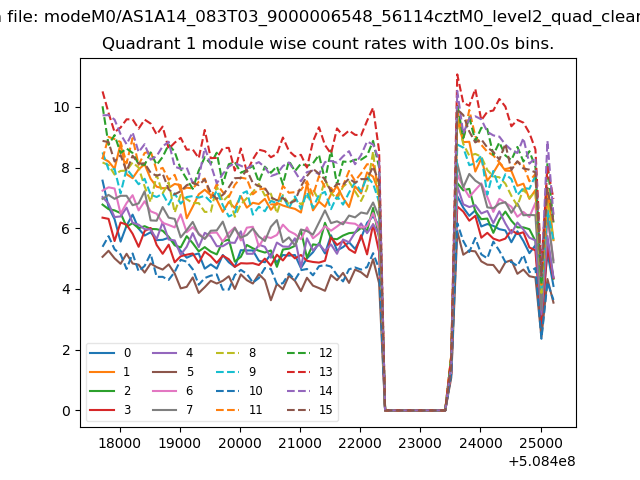
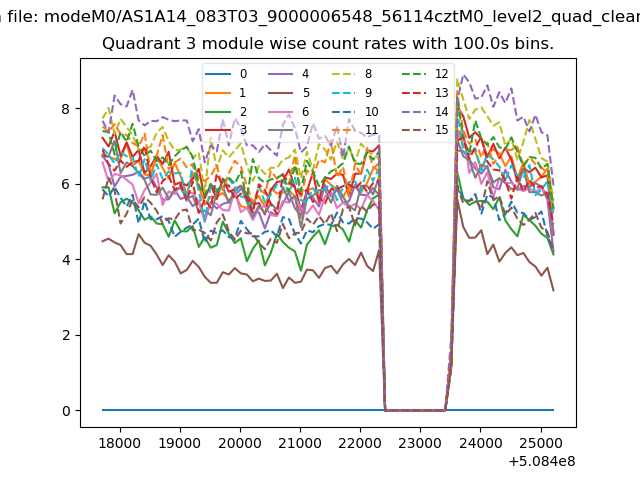
| Module-wise count rates for Quadrant A Data is divided into 100 sec bins |
 |
 |
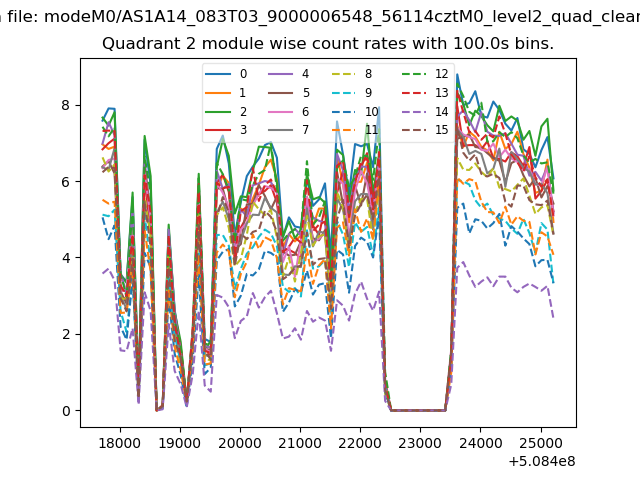
| Module-wise count rates for Quadrant B Data is divided into 100 sec bins |
 |
 |
| Module-wise count rates for Quadrant C Data is divided into 100 sec bins |
 |
 |
| Module-wise count rates for Quadrant D Data is divided into 100 sec bins |
 |
 |
| Parameter | Plot |
|---|---|
| CZT HV Monitor | 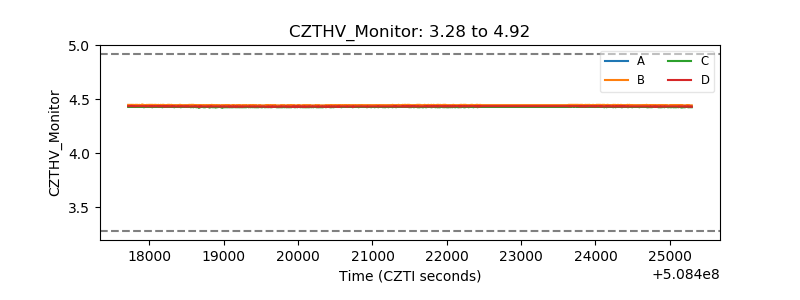 |
| D_VDD | 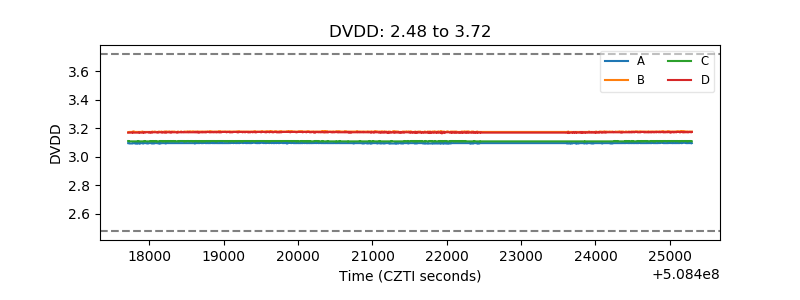 |
| Temperature 1 | 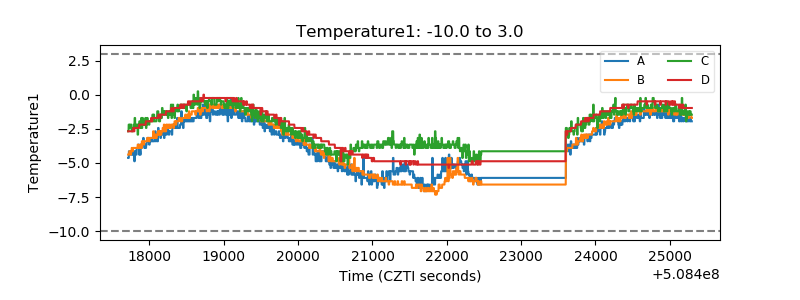 |
| Veto HV Monitor | 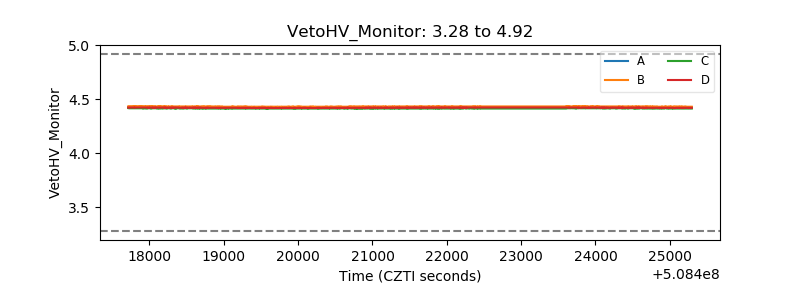 |
| Veto LLD | 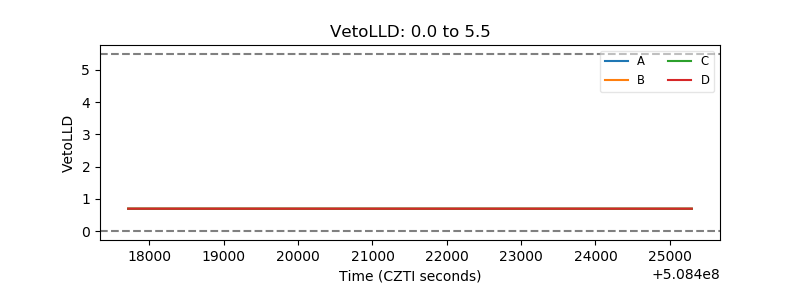 |
| Alpha Counter | 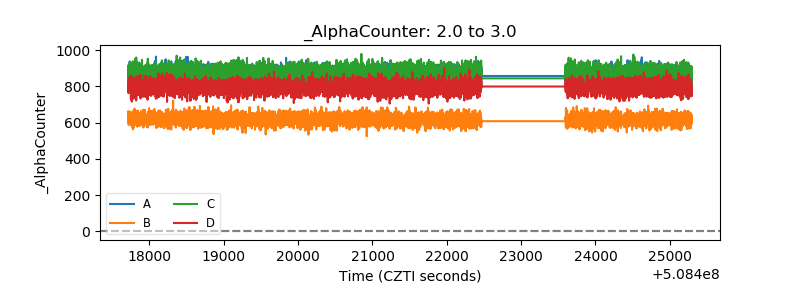 |
| _CPM_Rate | 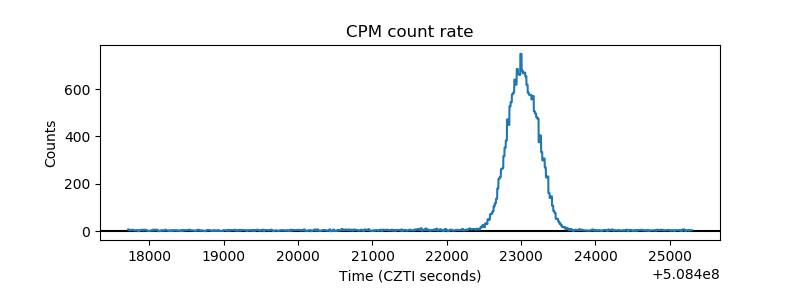 |
| CZT Counter | 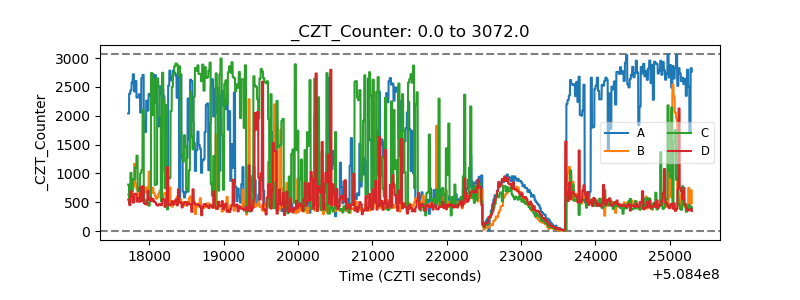 |
| +2.5 Volts monitor | 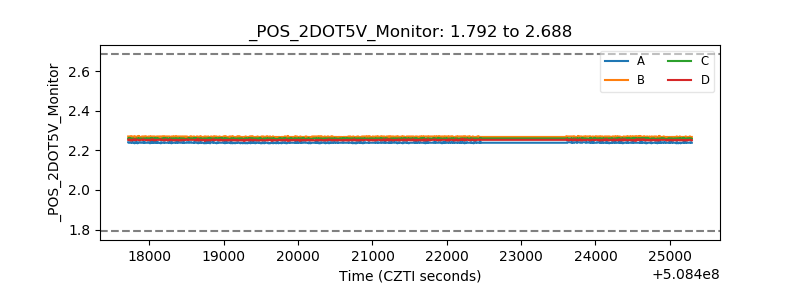 |
| +5 Volts monitor |  |
| _ROLL_ROT | 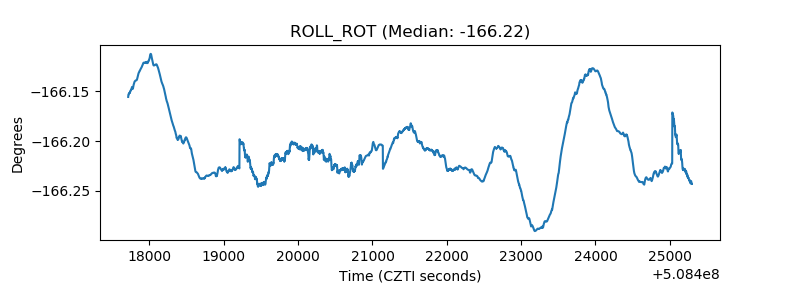 |
| _Roll_DEC | 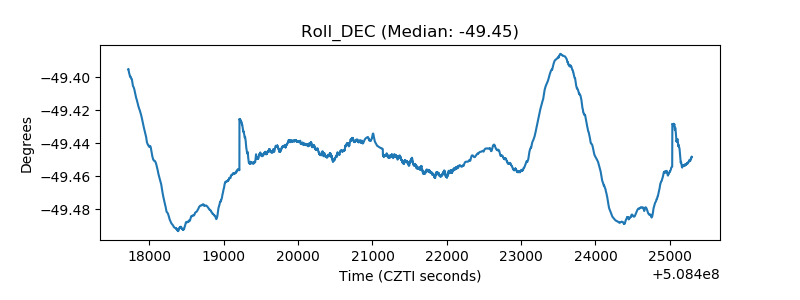 |
| _Roll_RA | 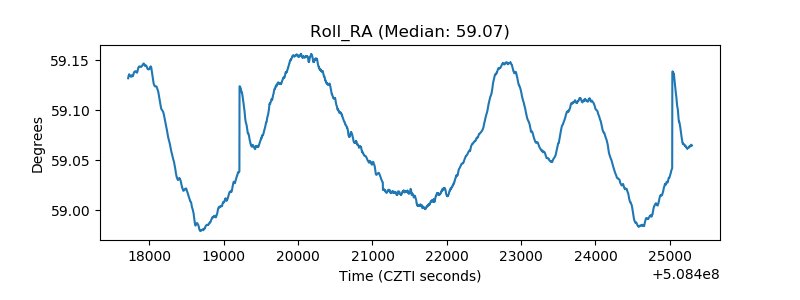 |
| Veto Counter | 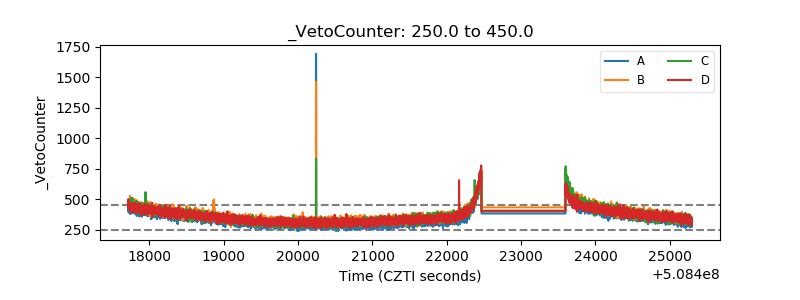 |