| Param | Original file | Final file |
|---|---|---|
| Filename | modeM0/AS1A14_083T03_9000006548_56117cztM0_level2.fits | modeM0/AS1A14_083T03_9000006548_56117cztM0_level2_quad_clean.evt |
| Size (bytes) | 709,332,480 | 89,720,640 |
| Size | 676.5 MB | 85.6 MB |
| Events in quadrant A | 12,660,633 | 362,906 |
| Events in quadrant B | 3,464,599 | 701,139 |
| Events in quadrant C | 4,103,706 | 615,547 |
| Events in quadrant D | 5,491,384 | 554,357 |
| Mode M0 | |||
|---|---|---|---|
| Quadrant | BADHDUFLAG | Total packets | Discarded packets |
| A | 0 | 42415 | 2 |
| B | 0 | 15263 | 2 |
| C | 0 | 17277 | 2 |
| D | 0 | 21315 | 5 |
| Mode SS | |||
|---|---|---|---|
| Quadrant | BADHDUFLAG | Total packets | Discarded packets |
| A | 0 | 142 | 0 |
| B | 0 | 142 | 0 |
| C | 0 | 142 | 0 |
| D | 0 | 142 | 0 |
| Mode M9 | |||
|---|---|---|---|
| Quadrant | BADHDUFLAG | Total packets | Discarded packets |
| A | 0 | 8 | 0 |
| B | 0 | 8 | 0 |
| C | 0 | 8 | 0 |
| D | 0 | 8 | 0 |
| Quadrant | Total seconds | Saturated seconds | Saturation percentage |
|---|---|---|---|
| A | 6925 | 3481 | 50.267148% |
| B | 6926 | 89 | 1.285013% |
| C | 6926 | 195 | 2.815478% |
| D | 6925 | 466 | 6.729242% |
Noise dominated data is calculated using 1-second bins in cleaned event files. If a bin has >2000 counts, and if more than 50% of those come from <1% of pixels, then it is considered to be noise-dominated and hence unusable.
| Quadrant | # 1 sec bins | Bins with >0 counts | Bins with >2000 counts | High rate bins dominated by noise | Noise dominated (total time) | Noise dominated (detector-on time) | Marked lightcurve |
|---|---|---|---|---|---|---|---|
| A | 7635 | 6926 | 3053 | 3053 | 39.99% | 44.08% | 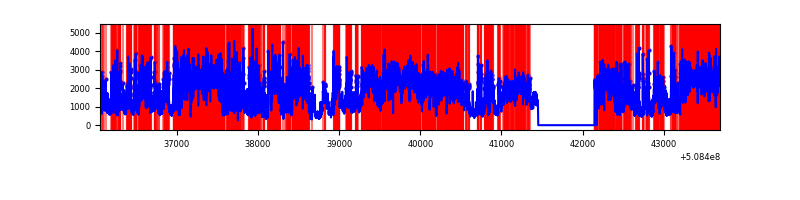 |
| B | 7636 | 6928 | 23 | 23 | 0.30% | 0.33% | 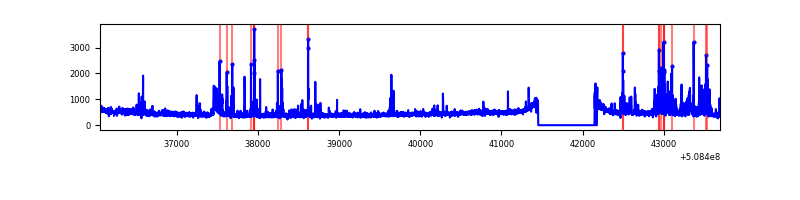 |
| C | 7636 | 6928 | 174 | 174 | 2.28% | 2.51% | 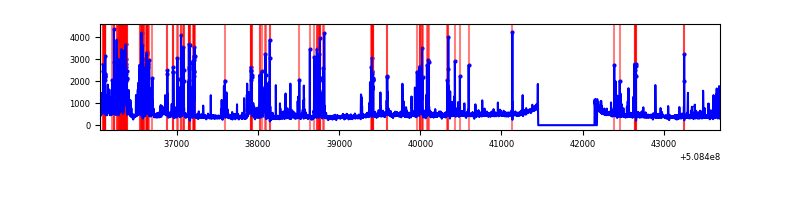 |
| D | 7635 | 6926 | 456 | 456 | 5.97% | 6.58% | 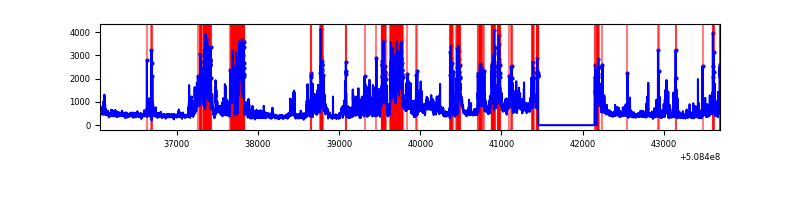 |
Top three noisy pixels from each quadrant. If the there are fewer than three noisy pixels in the level2.evt file, extra rows are filled as -1
| Pixel properties | Quadrant properties | ||||||
|---|---|---|---|---|---|---|---|
| Quadrant | DetID | PixID | Counts | Sigma | Mean | Median | Sigma |
| A | 12 | 115 | 6127946 | 41211.66 | 600 | 584 | 148.7 |
| A | 15 | 32 | 3196167 | 21492.98 | 600 | 584 | 148.7 |
| A | 3 | 14 | 399853 | 2685.42 | 600 | 584 | 148.7 |
| B | 10 | 247 | 242461 | 1547.51 | 730 | 702 | 156.2 |
| B | 4 | 171 | 112793 | 717.5 | 730 | 702 | 156.2 |
| B | 7 | 252 | 38753 | 243.57 | 730 | 702 | 156.2 |
| C | 12 | 254 | 848363 | 4411.37 | 700 | 691 | 192.2 |
| C | 9 | 38 | 348104 | 1807.97 | 700 | 691 | 192.2 |
| C | 13 | 3 | 71336 | 367.64 | 700 | 691 | 192.2 |
| D | 8 | 240 | 2252794 | 11541.2 | 684 | 653 | 195.1 |
| D | 2 | 249 | 142011 | 724.4 | 684 | 653 | 195.1 |
| D | 6 | 239 | 116686 | 594.62 | 684 | 653 | 195.1 |
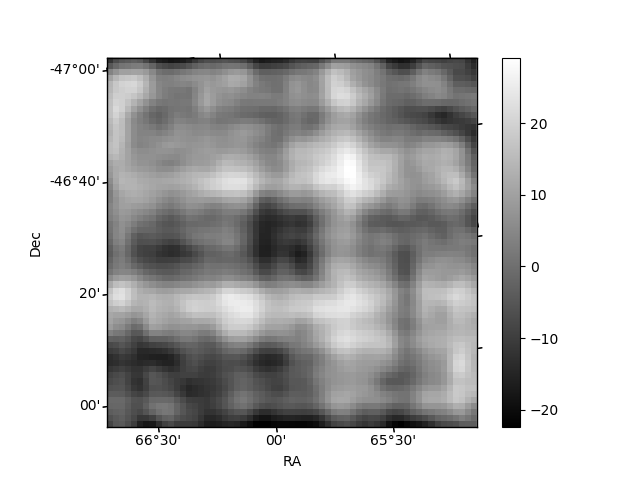
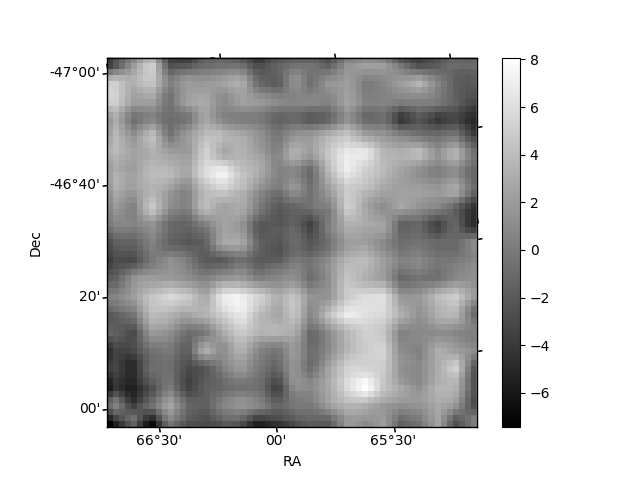
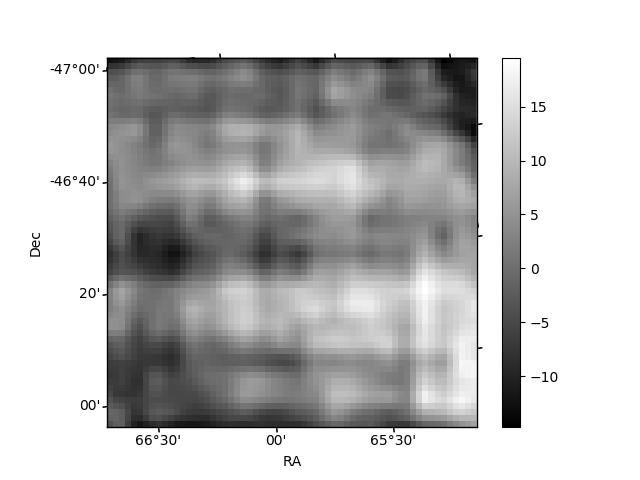
Histogram calculated using DETX and DETY for each event in the final _common_clean file
| Quadrant A | 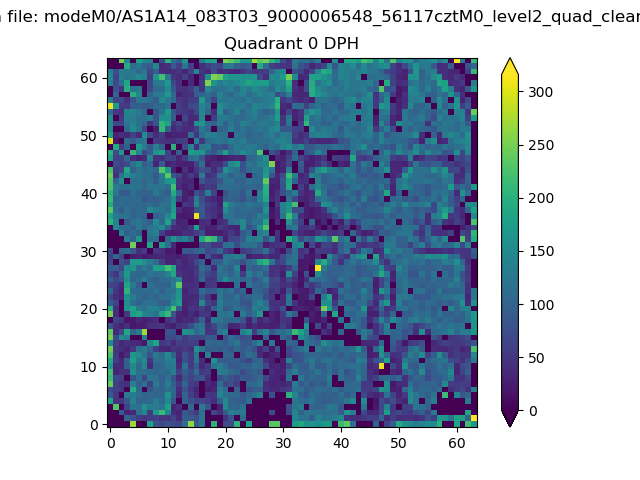 |
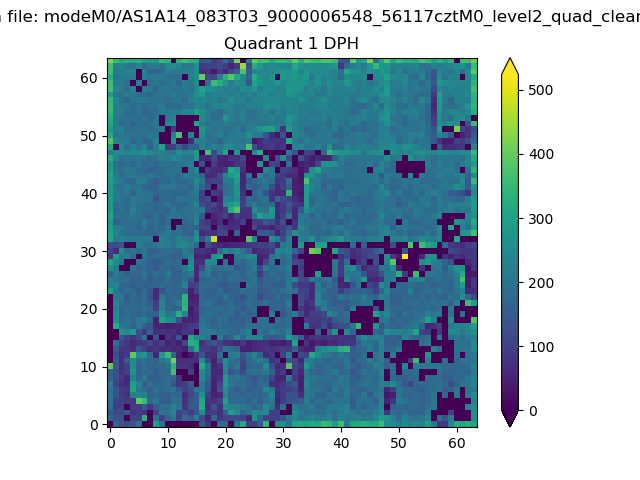 |
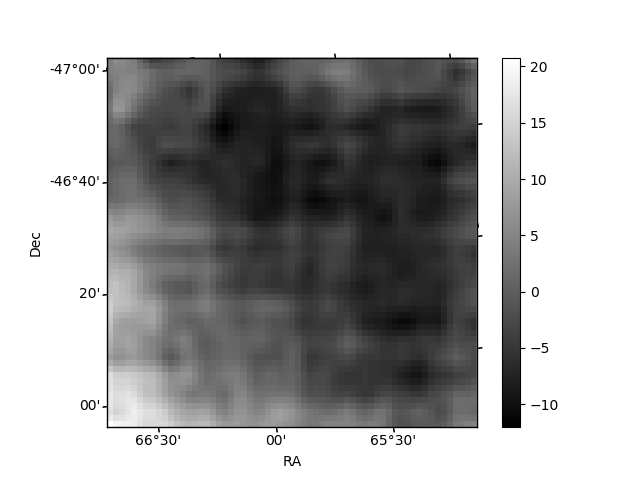
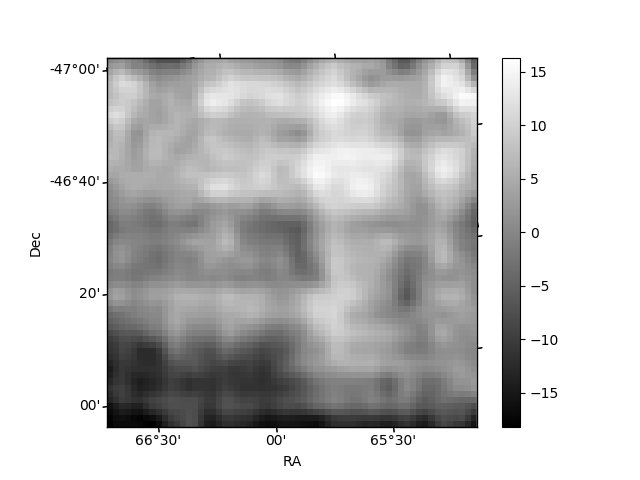
Quadrant B |
|---|---|---|---|
| Quadrant D | 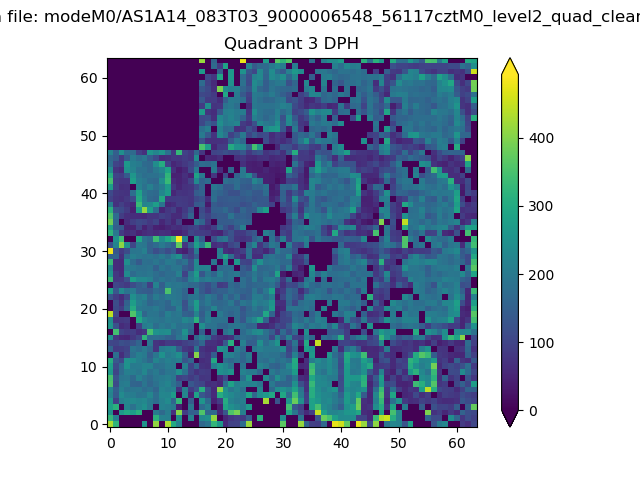 |
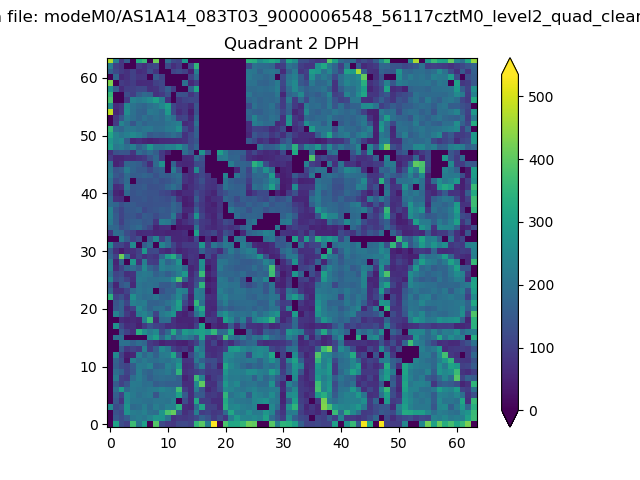 |
Quadrant C |
| Plot type | Count rate plots | Images |
|---|---|---|
| Comparison with Poisson distribution Blue bars denote a histogram of data divided into 1 sec bins. Red curve is a Poisson curve with rate = median count rate of data. |
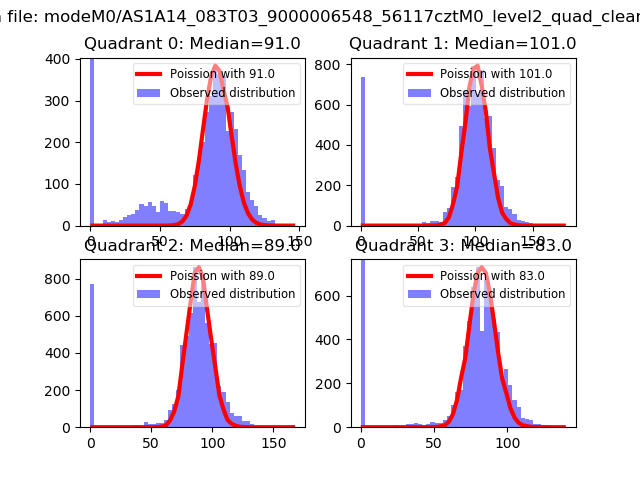 |
 |
| Quadrant-wise count rates Data is divided into 100 sec bins |
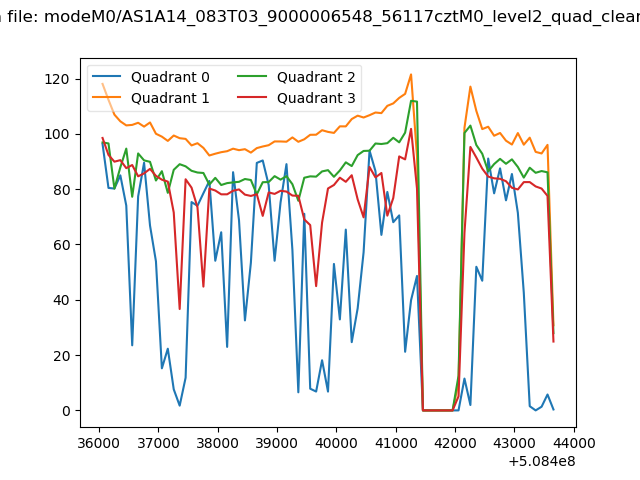 |
|
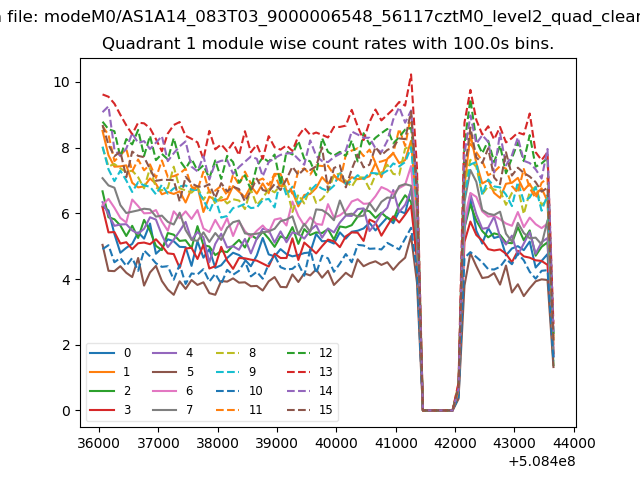
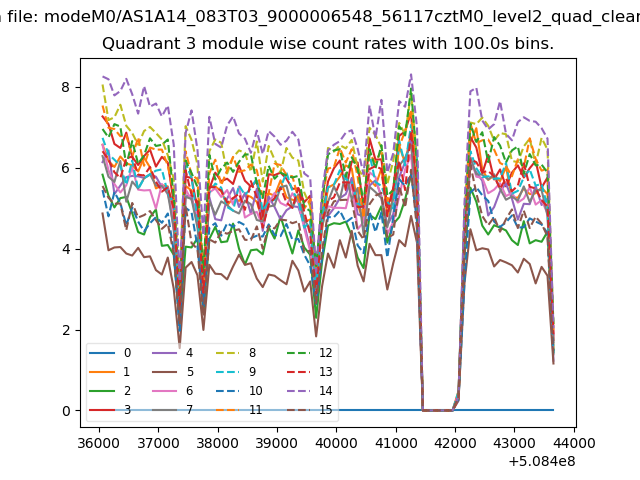
| Module-wise count rates for Quadrant A Data is divided into 100 sec bins |
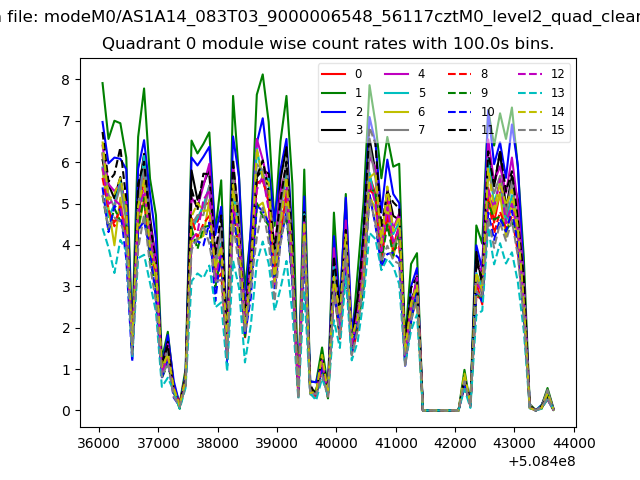 |
 |
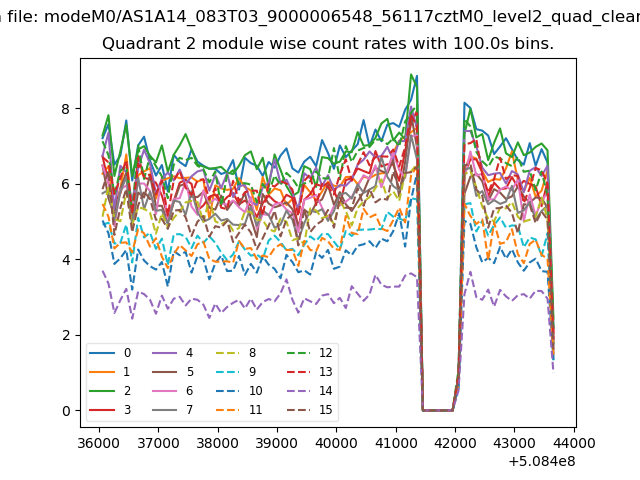
| Module-wise count rates for Quadrant B Data is divided into 100 sec bins |
 |
 |
| Module-wise count rates for Quadrant C Data is divided into 100 sec bins |
 |
 |
| Module-wise count rates for Quadrant D Data is divided into 100 sec bins |
 |
 |
| Parameter | Plot |
|---|---|
| CZT HV Monitor | 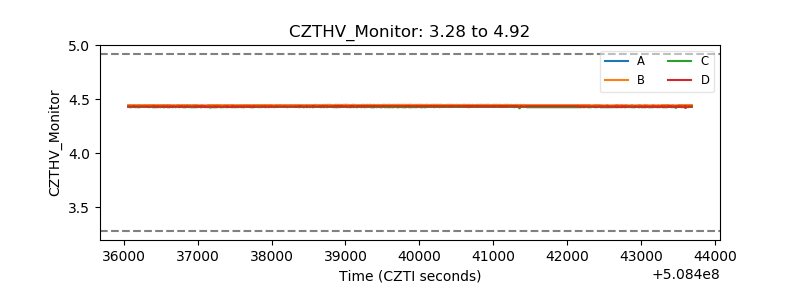 |
| D_VDD | 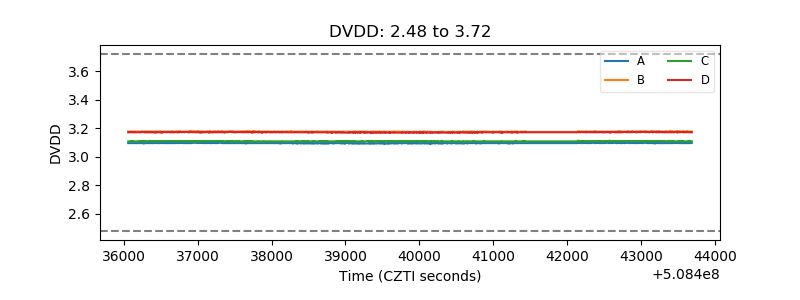 |
| Temperature 1 | 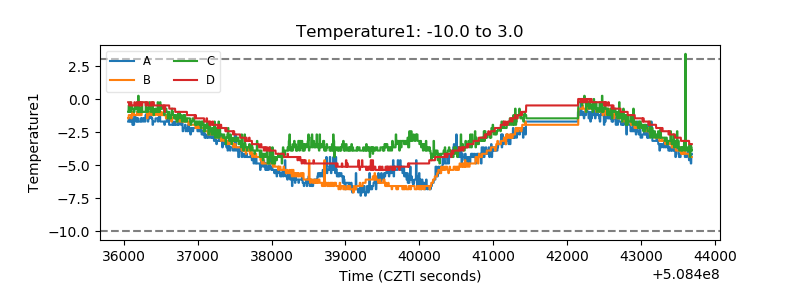 |
| Veto HV Monitor | 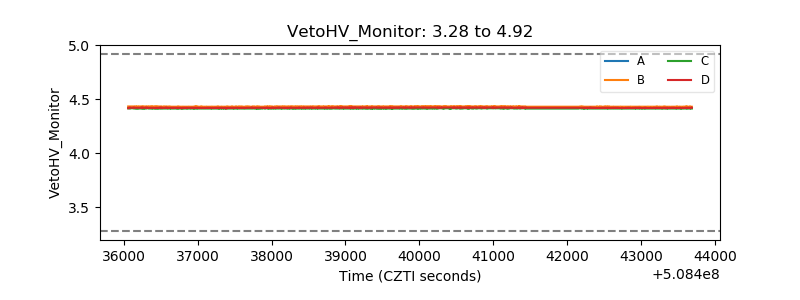 |
| Veto LLD | 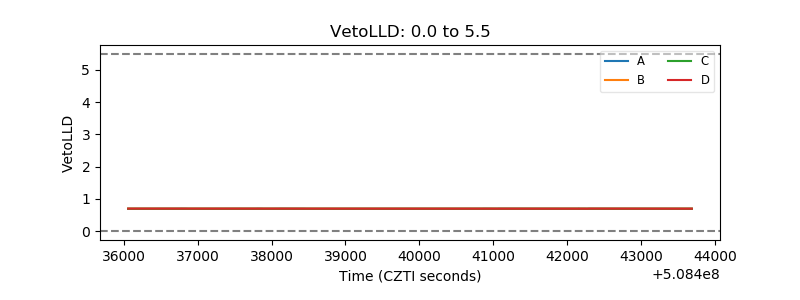 |
| Alpha Counter | 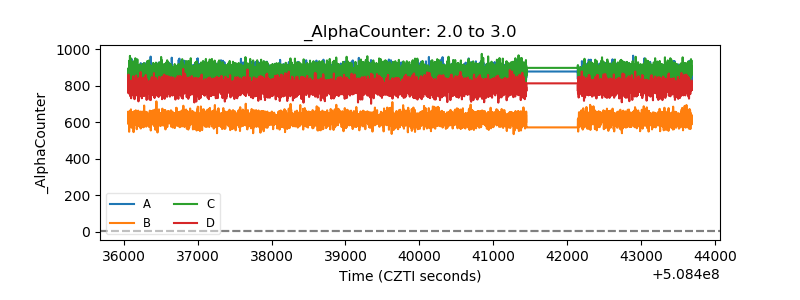 |
| _CPM_Rate | 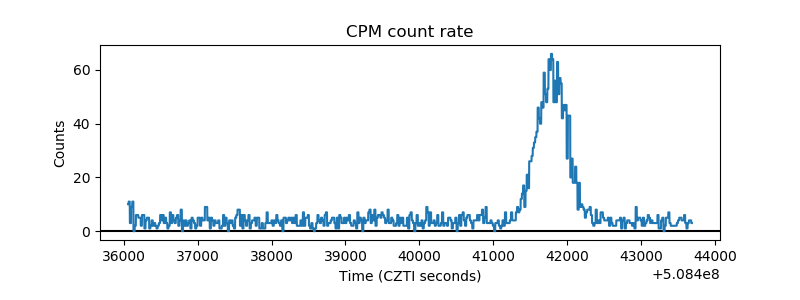 |
| CZT Counter | 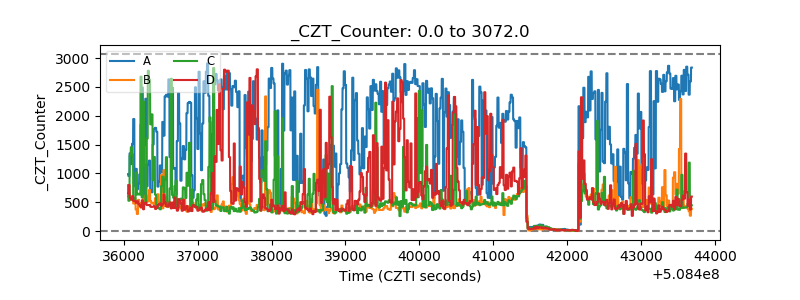 |
| +2.5 Volts monitor | 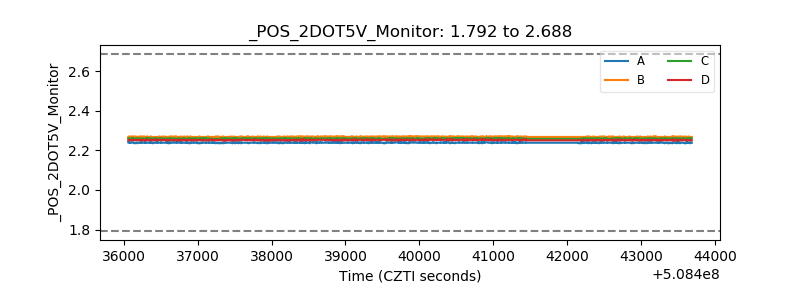 |
| +5 Volts monitor |  |
| _ROLL_ROT | 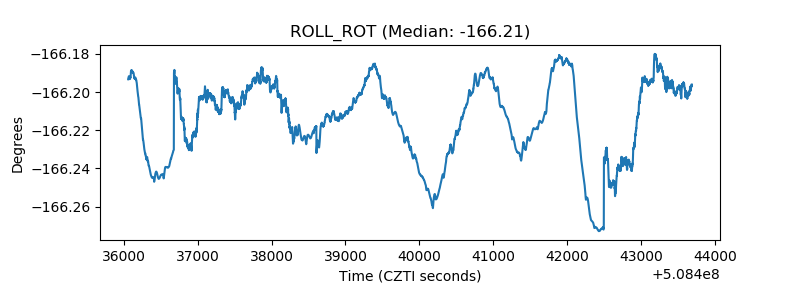 |
| _Roll_DEC | 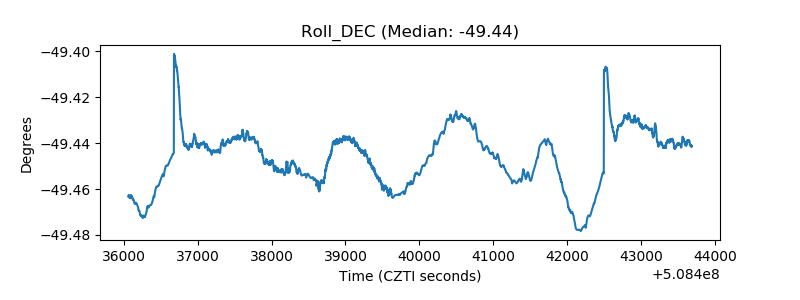 |
| _Roll_RA | 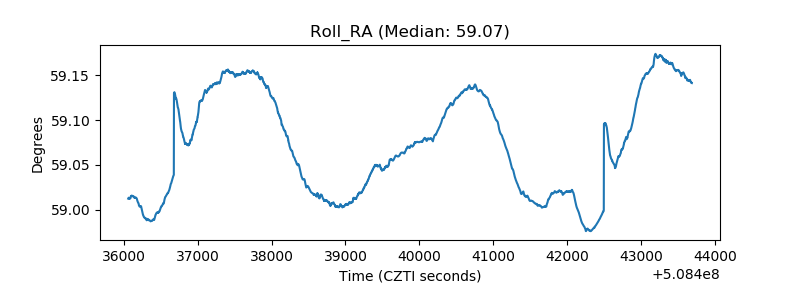 |
| Veto Counter | 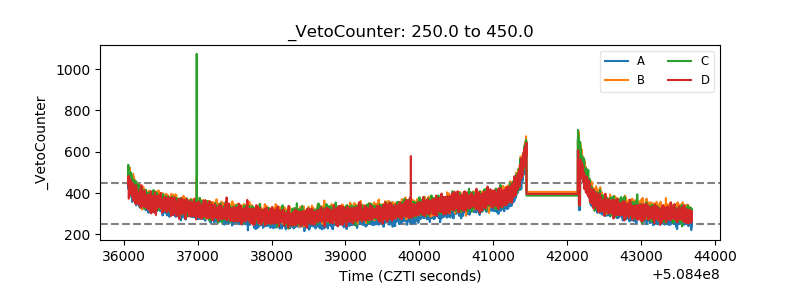 |