| Param | Original file | Final file |
|---|---|---|
| Filename | modeM0/AS1A14_083T03_9000006548_56118cztM0_level2.fits | modeM0/AS1A14_083T03_9000006548_56118cztM0_level2_quad_clean.evt |
| Size (bytes) | 606,346,560 | 102,683,520 |
| Size | 578.3 MB | 97.9 MB |
| Events in quadrant A | 8,548,939 | 566,821 |
| Events in quadrant B | 4,127,924 | 751,190 |
| Events in quadrant C | 3,683,258 | 671,876 |
| Events in quadrant D | 5,501,993 | 596,987 |
| Mode M0 | |||
|---|---|---|---|
| Quadrant | BADHDUFLAG | Total packets | Discarded packets |
| A | 0 | 30501 | 3 |
| B | 0 | 17532 | 2 |
| C | 0 | 16560 | 2 |
| D | 0 | 21585 | 2 |
| Mode SS | |||
|---|---|---|---|
| Quadrant | BADHDUFLAG | Total packets | Discarded packets |
| A | 0 | 154 | 0 |
| B | 0 | 154 | 0 |
| C | 0 | 154 | 0 |
| D | 0 | 154 | 0 |
| Mode M9 | |||
|---|---|---|---|
| Quadrant | BADHDUFLAG | Total packets | Discarded packets |
| A | 0 | 3 | 0 |
| B | 0 | 3 | 0 |
| C | 0 | 3 | 0 |
| D | 0 | 3 | 0 |
| Quadrant | Total seconds | Saturated seconds | Saturation percentage |
|---|---|---|---|
| A | 7510 | 1617 | 21.531292% |
| B | 7511 | 161 | 2.143523% |
| C | 7511 | 51 | 0.679004% |
| D | 7511 | 466 | 6.204234% |
Noise dominated data is calculated using 1-second bins in cleaned event files. If a bin has >2000 counts, and if more than 50% of those come from <1% of pixels, then it is considered to be noise-dominated and hence unusable.
| Quadrant | # 1 sec bins | Bins with >0 counts | Bins with >2000 counts | High rate bins dominated by noise | Noise dominated (total time) | Noise dominated (detector-on time) | Marked lightcurve |
|---|---|---|---|---|---|---|---|
| A | 7680 | 7512 | 1357 | 1357 | 17.67% | 18.06% |  |
| B | 7681 | 7514 | 44 | 44 | 0.57% | 0.59% |  |
| C | 7681 | 7514 | 31 | 31 | 0.40% | 0.41% | 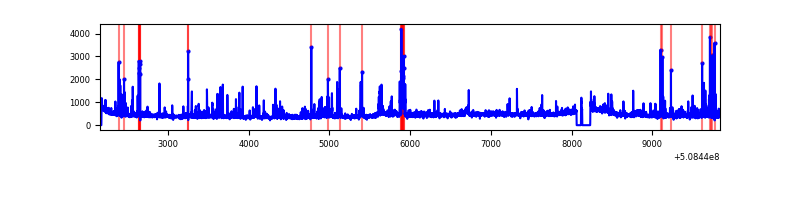 |
| D | 7681 | 7514 | 407 | 407 | 5.30% | 5.42% |  |
Top three noisy pixels from each quadrant. If the there are fewer than three noisy pixels in the level2.evt file, extra rows are filled as -1
| Pixel properties | Quadrant properties | ||||||
|---|---|---|---|---|---|---|---|
| Quadrant | DetID | PixID | Counts | Sigma | Mean | Median | Sigma |
| A | 12 | 115 | 3193542 | 17705.27 | 726 | 706 | 180.3 |
| A | 15 | 32 | 1119182 | 6202.3 | 726 | 706 | 180.3 |
| A | 7 | 64 | 1105362 | 6125.66 | 726 | 706 | 180.3 |
| B | 4 | 171 | 185678 | 1093.29 | 794 | 766 | 169.1 |
| B | 10 | 247 | 167408 | 985.27 | 794 | 766 | 169.1 |
| B | 9 | 254 | 116737 | 685.68 | 794 | 766 | 169.1 |
| C | 12 | 254 | 349747 | 1644.67 | 768 | 759 | 212.2 |
| C | 12 | 252 | 92299 | 431.4 | 768 | 759 | 212.2 |
| C | 9 | 38 | 62797 | 292.37 | 768 | 759 | 212.2 |
| D | 8 | 240 | 1503831 | 7151.86 | 747 | 711 | 210.2 |
| D | 2 | 249 | 465308 | 2210.56 | 747 | 711 | 210.2 |
| D | 3 | 12 | 141939 | 671.96 | 747 | 711 | 210.2 |
Histogram calculated using DETX and DETY for each event in the final _common_clean file
| Quadrant A |  |
 |
Quadrant B |
|---|---|---|---|
| Quadrant D |  |
 |
Quadrant C |
| Plot type | Count rate plots | Images |
|---|---|---|
| Comparison with Poisson distribution Blue bars denote a histogram of data divided into 1 sec bins. Red curve is a Poisson curve with rate = median count rate of data. |
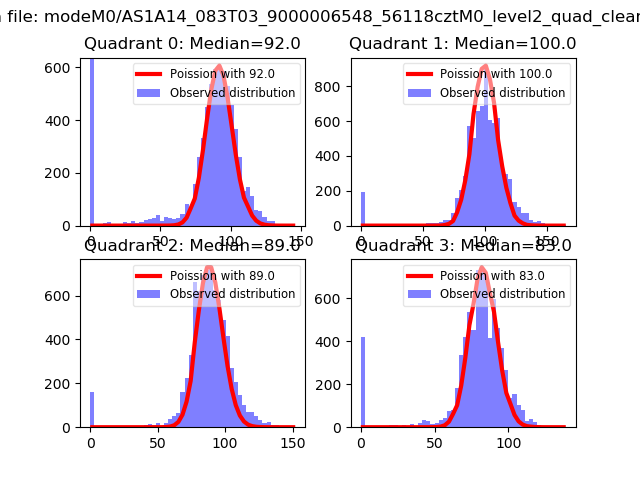 |
 |
| Quadrant-wise count rates Data is divided into 100 sec bins |
 |
|
| Module-wise count rates for Quadrant A Data is divided into 100 sec bins |
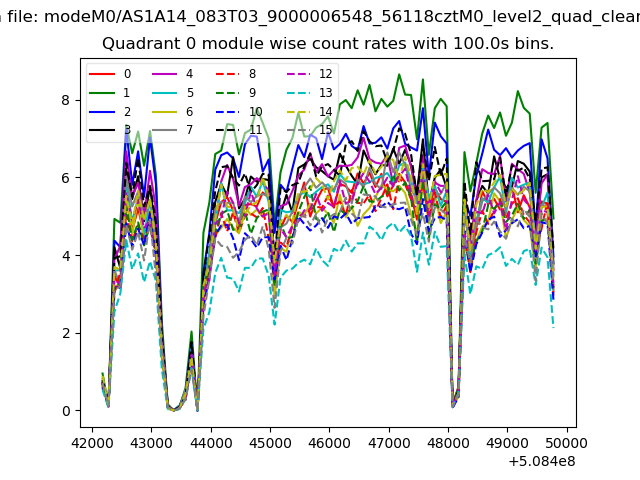 |
 |
| Module-wise count rates for Quadrant B Data is divided into 100 sec bins |
 |
 |
| Module-wise count rates for Quadrant C Data is divided into 100 sec bins |
 |
 |
| Module-wise count rates for Quadrant D Data is divided into 100 sec bins |
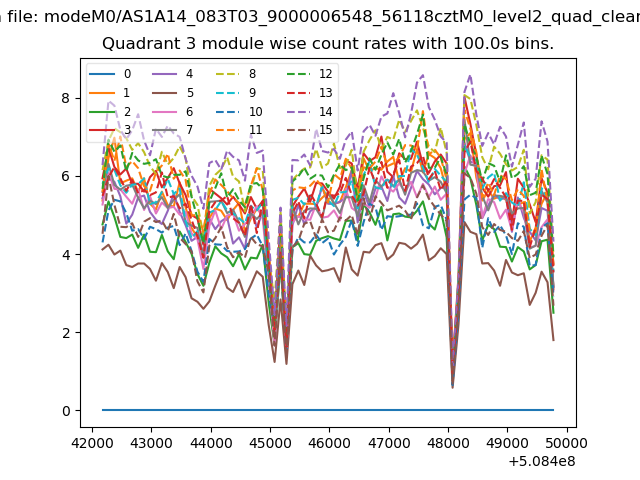 |
 |
| Parameter | Plot |
|---|---|
| CZT HV Monitor | 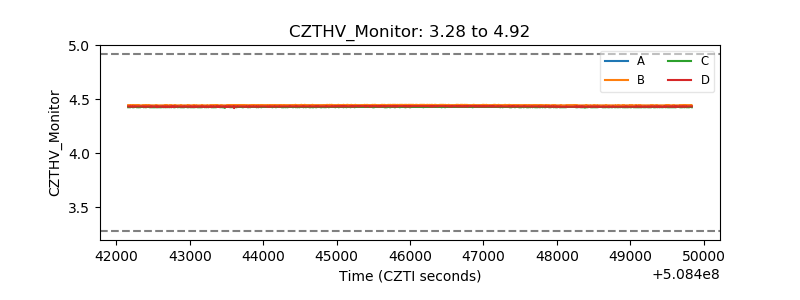 |
| D_VDD |  |
| Temperature 1 | 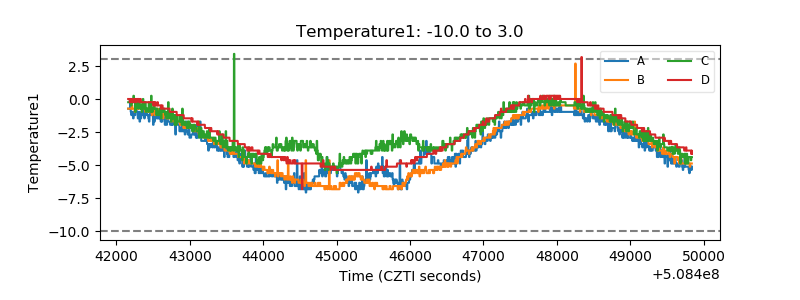 |
| Veto HV Monitor |  |
| Veto LLD | 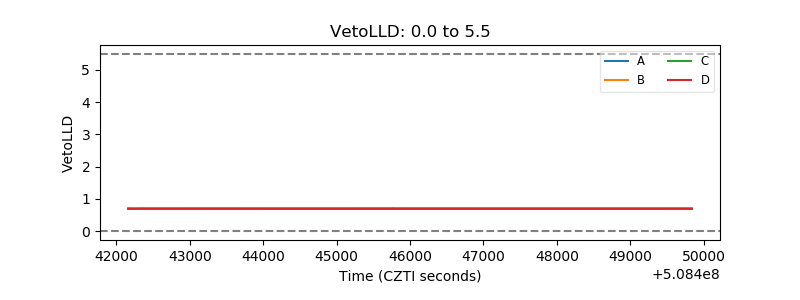 |
| Alpha Counter | 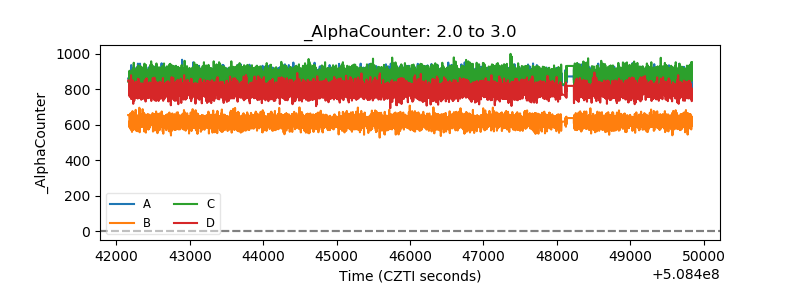 |
| _CPM_Rate | 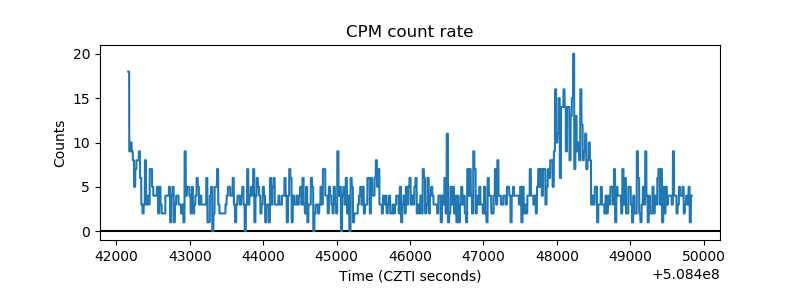 |
| CZT Counter | 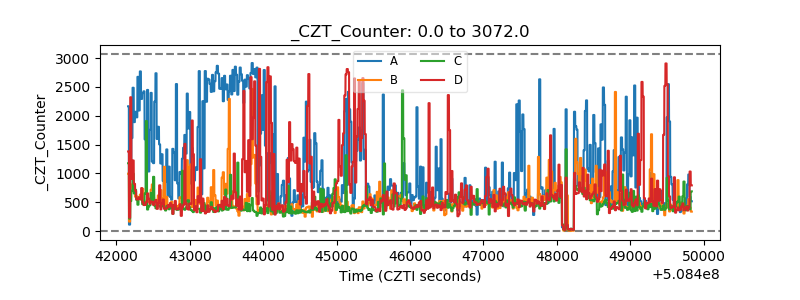 |
| +2.5 Volts monitor | 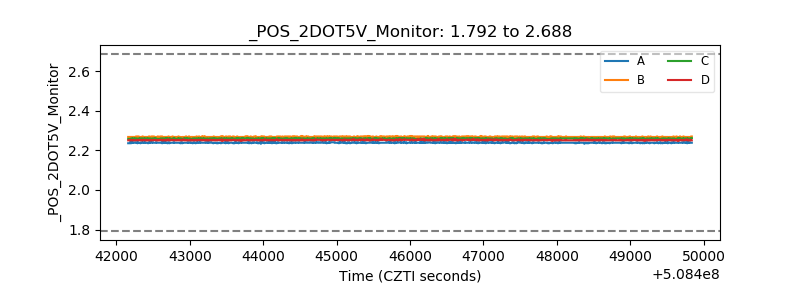 |
| +5 Volts monitor |  |
| _ROLL_ROT |  |
| _Roll_DEC |  |
| _Roll_RA |  |
| Veto Counter |  |