| Param | Original file | Final file |
|---|---|---|
| Filename | modeM0/AS1A14_083T03_9000006548_56120cztM0_level2.fits | modeM0/AS1A14_083T03_9000006548_56120cztM0_level2_quad_clean.evt |
| Size (bytes) | 590,247,360 | 116,089,920 |
| Size | 562.9 MB | 110.7 MB |
| Events in quadrant A | 5,914,165 | 734,606 |
| Events in quadrant B | 5,076,319 | 822,728 |
| Events in quadrant C | 5,515,375 | 697,002 |
| Events in quadrant D | 4,697,239 | 681,623 |
| Mode M0 | |||
|---|---|---|---|
| Quadrant | BADHDUFLAG | Total packets | Discarded packets |
| A | 0 | 23738 | 0 |
| B | 0 | 20689 | 0 |
| C | 0 | 22270 | 0 |
| D | 0 | 20172 | 0 |
| Mode SS | |||
|---|---|---|---|
| Quadrant | BADHDUFLAG | Total packets | Discarded packets |
| A | 0 | 168 | 0 |
| B | 0 | 168 | 0 |
| C | 0 | 168 | 0 |
| D | 0 | 168 | 0 |
| Quadrant | Total seconds | Saturated seconds | Saturation percentage |
|---|---|---|---|
| A | 8326 | 563 | 6.761951% |
| B | 8326 | 166 | 1.993755% |
| C | 8326 | 451 | 5.416767% |
| D | 8327 | 153 | 1.837396% |
Noise dominated data is calculated using 1-second bins in cleaned event files. If a bin has >2000 counts, and if more than 50% of those come from <1% of pixels, then it is considered to be noise-dominated and hence unusable.
| Quadrant | # 1 sec bins | Bins with >0 counts | Bins with >2000 counts | High rate bins dominated by noise | Noise dominated (total time) | Noise dominated (detector-on time) | Marked lightcurve |
|---|---|---|---|---|---|---|---|
| A | 8326 | 8326 | 363 | 363 | 4.36% | 4.36% | 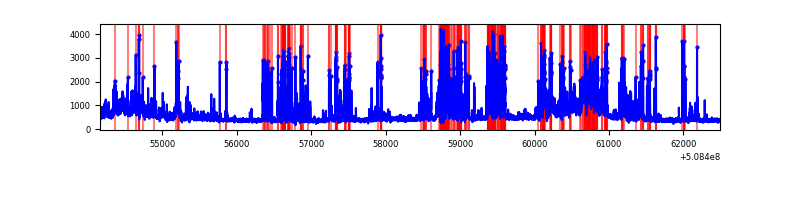 |
| B | 8326 | 8326 | 99 | 99 | 1.19% | 1.19% | 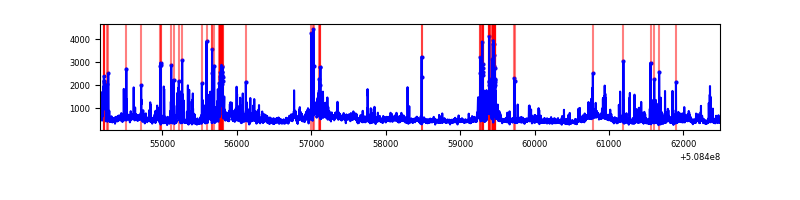 |
| C | 8326 | 8326 | 289 | 289 | 3.47% | 3.47% | 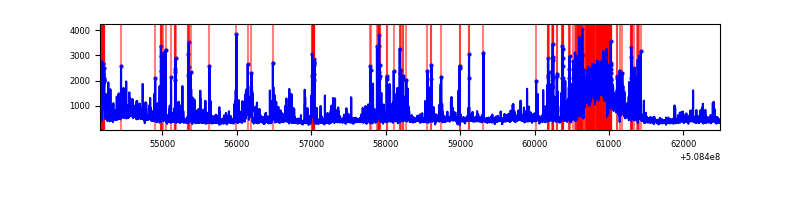 |
| D | 8327 | 8327 | 145 | 145 | 1.74% | 1.74% | 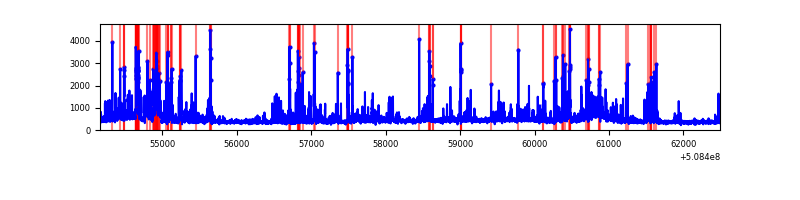 |
Top three noisy pixels from each quadrant. If the there are fewer than three noisy pixels in the level2.evt file, extra rows are filled as -1
| Pixel properties | Quadrant properties | ||||||
|---|---|---|---|---|---|---|---|
| Quadrant | DetID | PixID | Counts | Sigma | Mean | Median | Sigma |
| A | 7 | 64 | 2251486 | 10541.08 | 855 | 833 | 213.5 |
| A | 0 | 8 | 136094 | 633.5 | 855 | 833 | 213.5 |
| A | 3 | 14 | 79897 | 370.3 | 855 | 833 | 213.5 |
| B | 9 | 254 | 569638 | 3071.99 | 873 | 843 | 185.2 |
| B | 4 | 156 | 331059 | 1783.46 | 873 | 843 | 185.2 |
| B | 4 | 190 | 252897 | 1361.31 | 873 | 843 | 185.2 |
| C | 12 | 252 | 758261 | 3360.78 | 830 | 823 | 225.4 |
| C | 15 | 148 | 730202 | 3236.28 | 830 | 823 | 225.4 |
| C | 12 | 254 | 352754 | 1561.53 | 830 | 823 | 225.4 |
| D | 2 | 249 | 621313 | 2642.66 | 838 | 802 | 234.8 |
| D | 8 | 240 | 383851 | 1631.35 | 838 | 802 | 234.8 |
| D | 2 | 120 | 174594 | 740.15 | 838 | 802 | 234.8 |
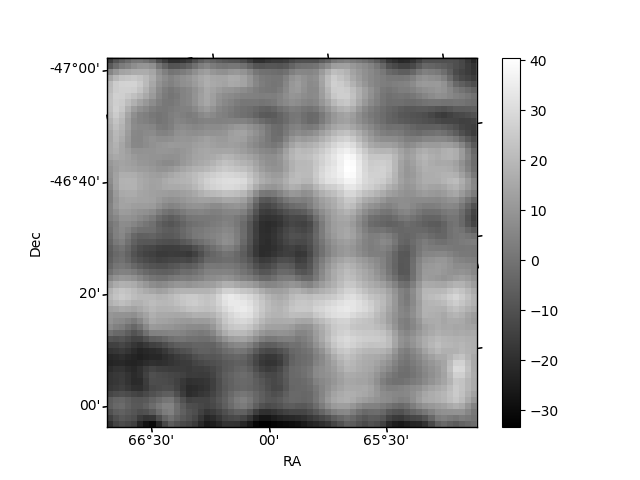
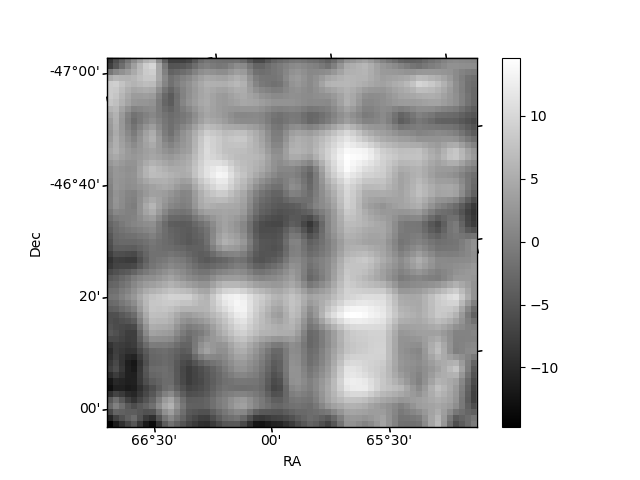
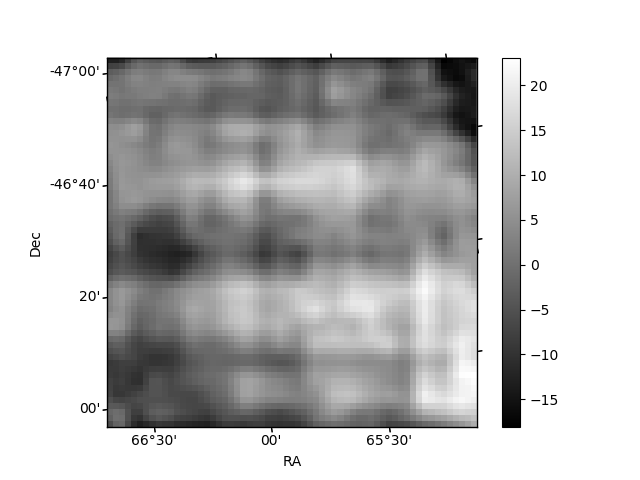
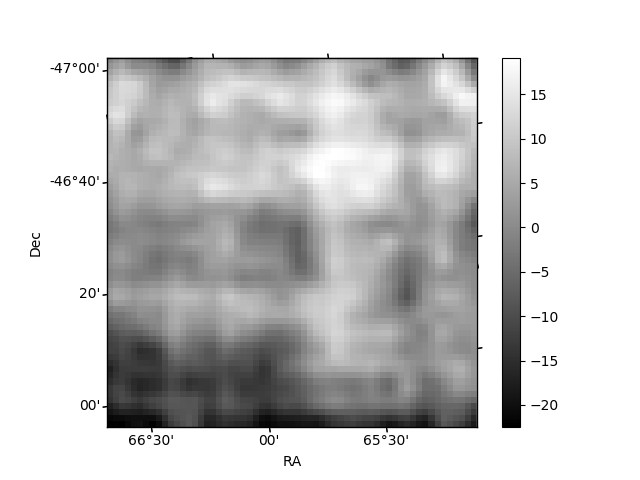
Histogram calculated using DETX and DETY for each event in the final _common_clean file
| Quadrant A | 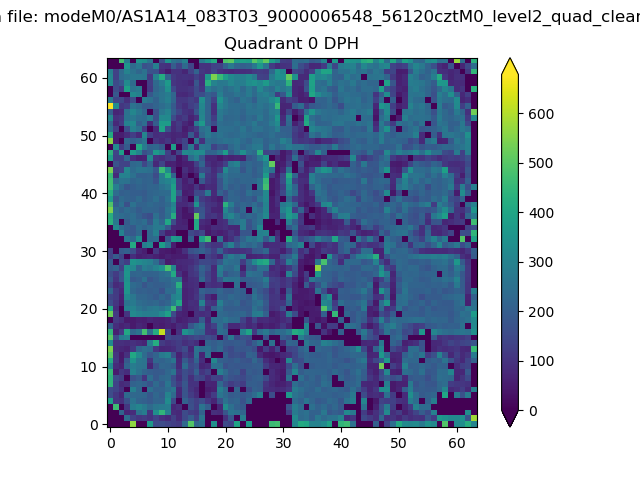 |
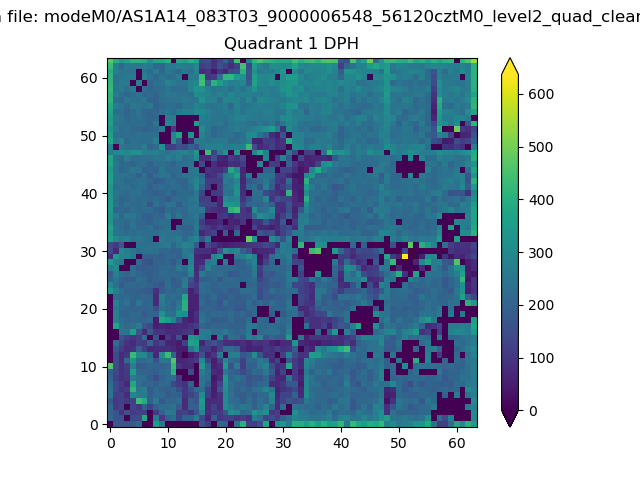 |
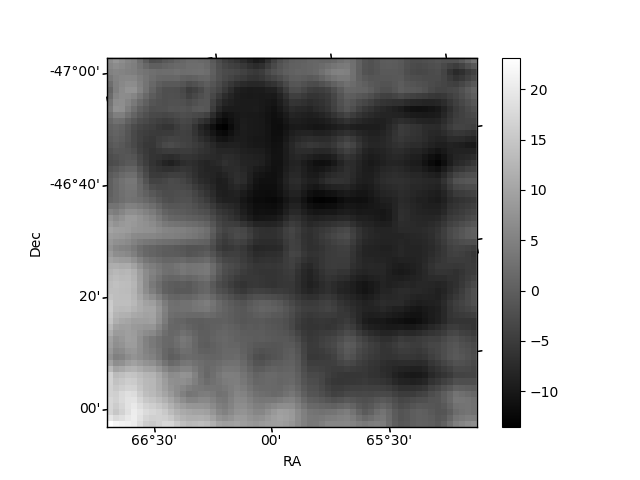
Quadrant B |
|---|---|---|---|
| Quadrant D | 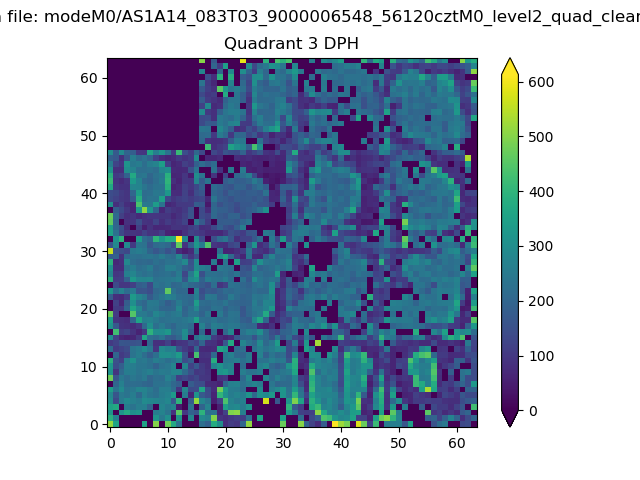 |
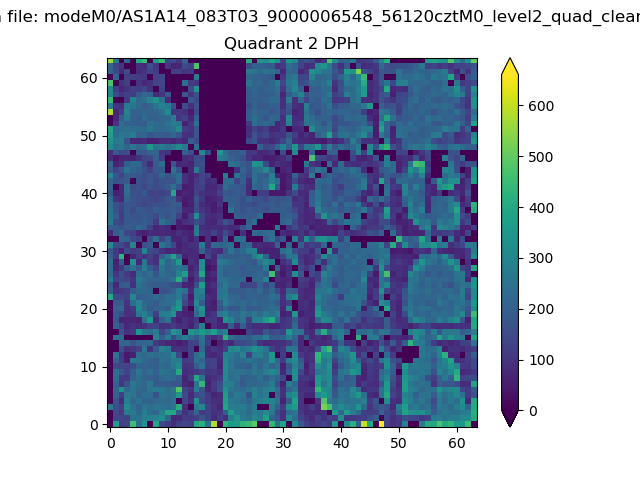 |
Quadrant C |
| Plot type | Count rate plots | Images |
|---|---|---|
| Comparison with Poisson distribution Blue bars denote a histogram of data divided into 1 sec bins. Red curve is a Poisson curve with rate = median count rate of data. |
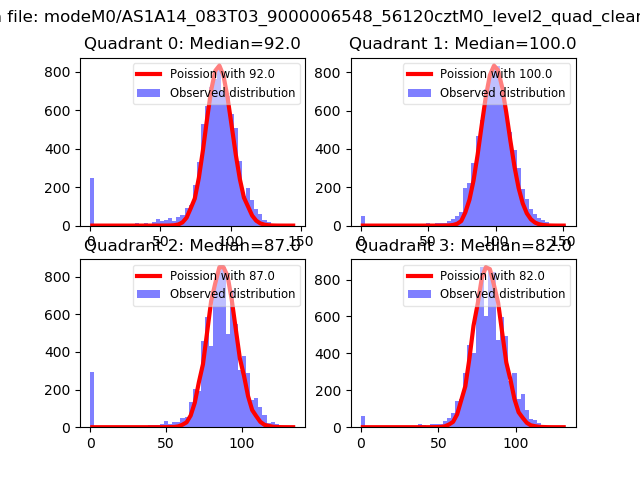 |
 |
| Quadrant-wise count rates Data is divided into 100 sec bins |
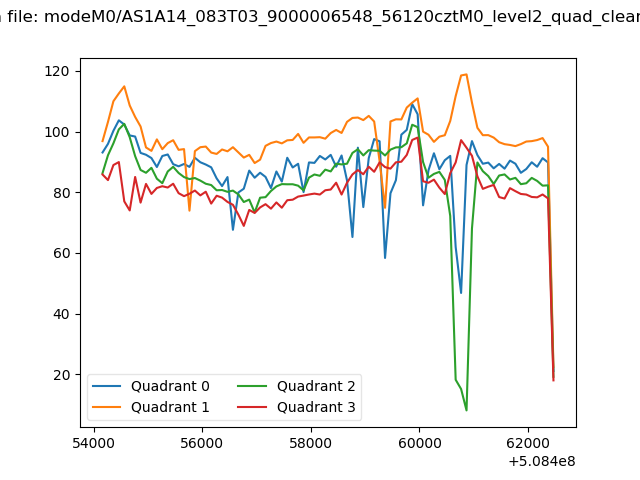 |
|
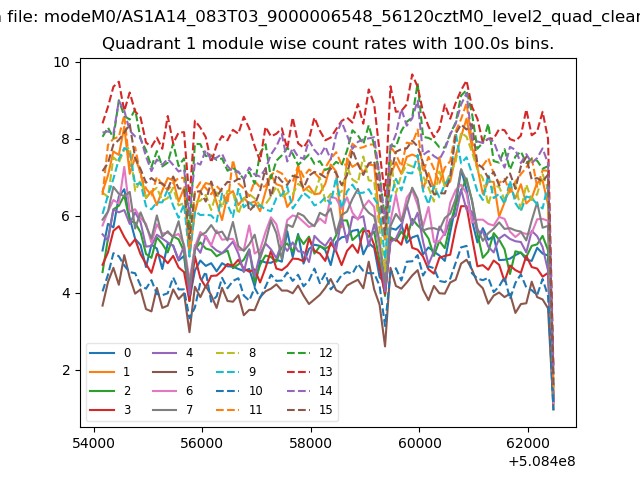
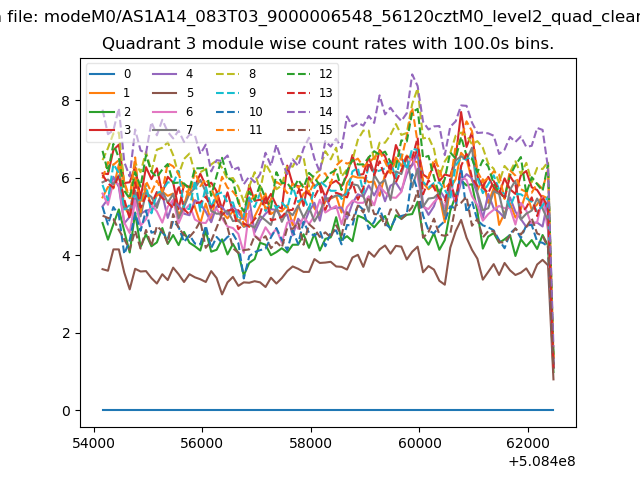
| Module-wise count rates for Quadrant A Data is divided into 100 sec bins |
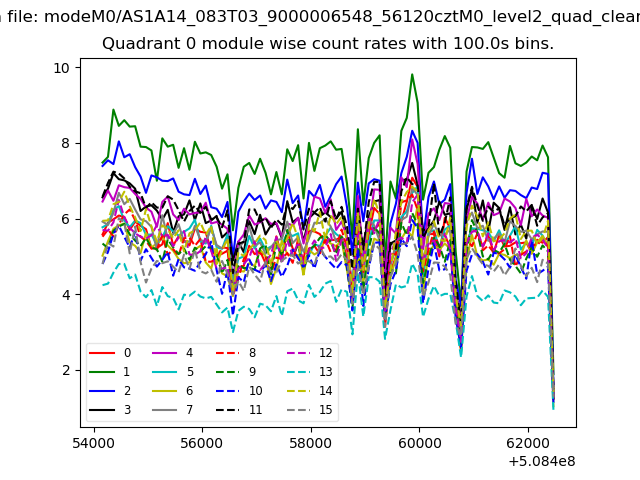 |
 |
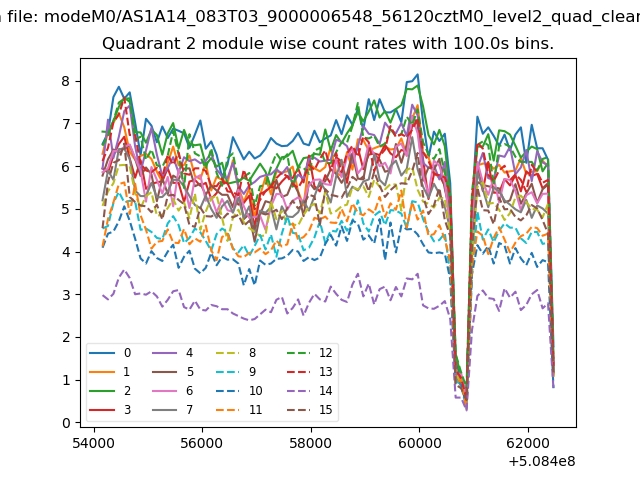
| Module-wise count rates for Quadrant B Data is divided into 100 sec bins |
 |
 |
| Module-wise count rates for Quadrant C Data is divided into 100 sec bins |
 |
 |
| Module-wise count rates for Quadrant D Data is divided into 100 sec bins |
 |
 |
| Parameter | Plot |
|---|---|
| CZT HV Monitor | 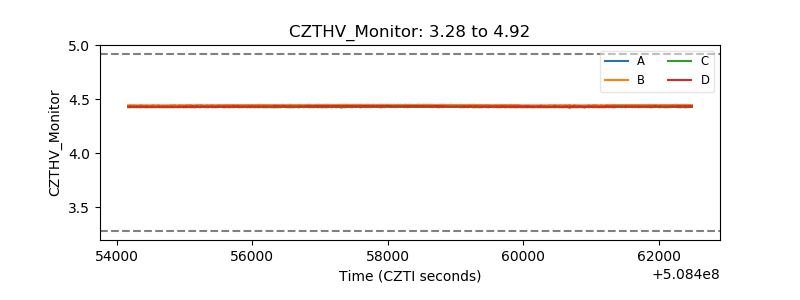 |
| D_VDD | 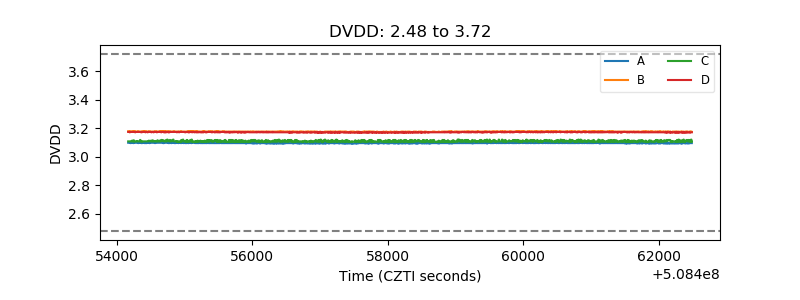 |
| Temperature 1 | 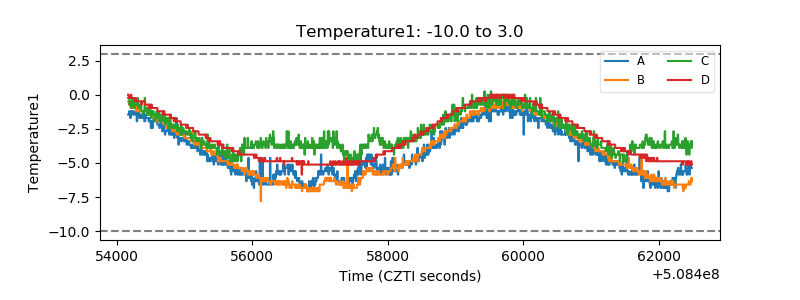 |
| Veto HV Monitor |  |
| Veto LLD | 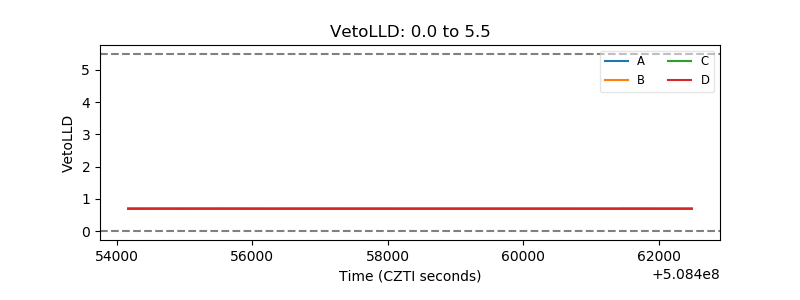 |
| Alpha Counter | 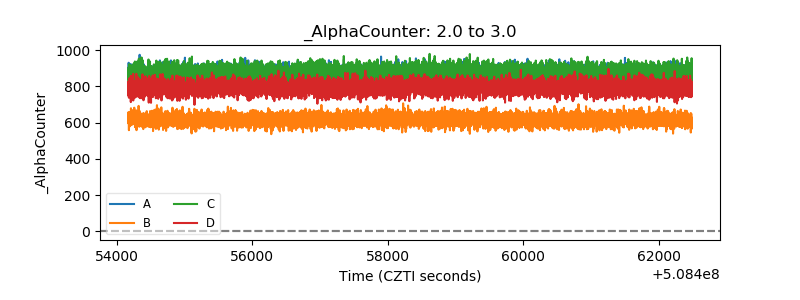 |
| _CPM_Rate | 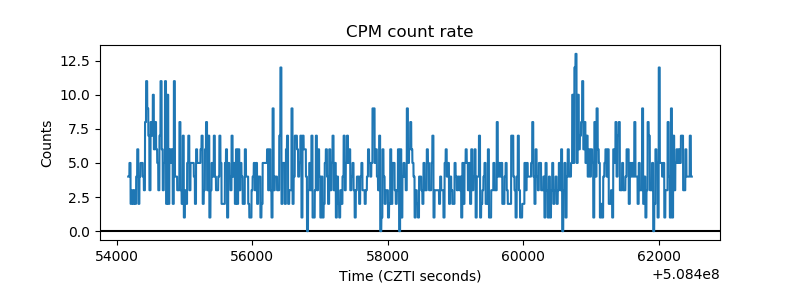 |
| CZT Counter | 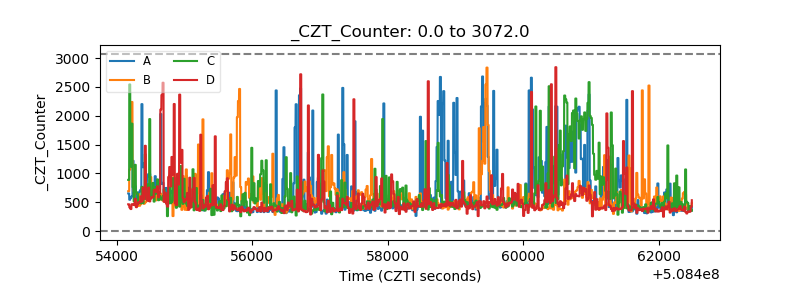 |
| +2.5 Volts monitor | 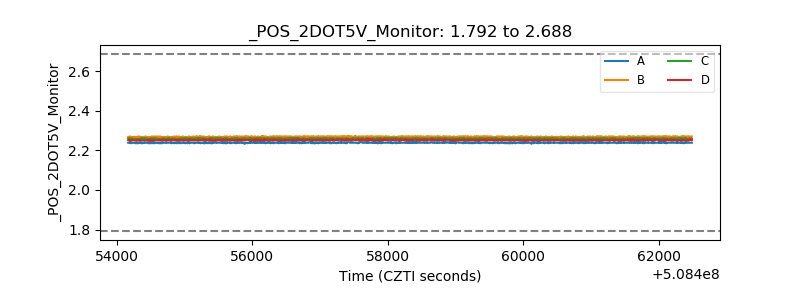 |
| +5 Volts monitor |  |
| _ROLL_ROT | 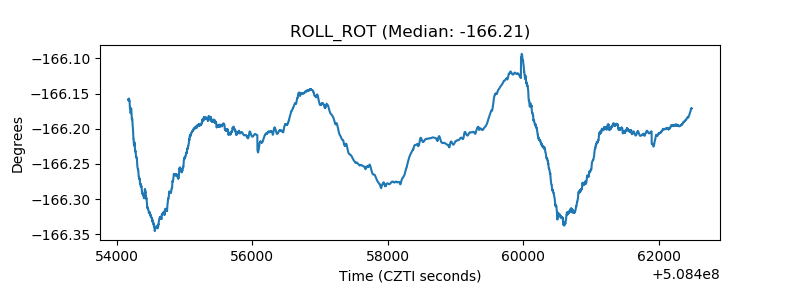 |
| _Roll_DEC | 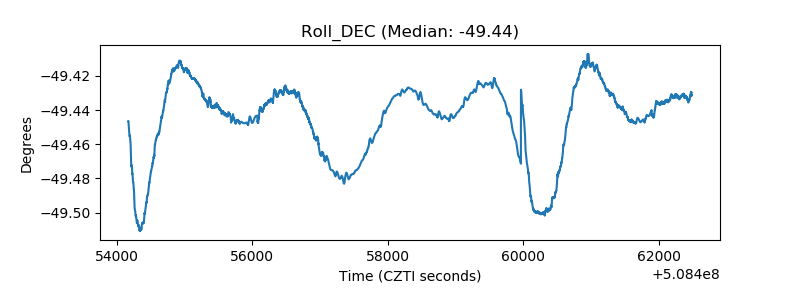 |
| _Roll_RA | 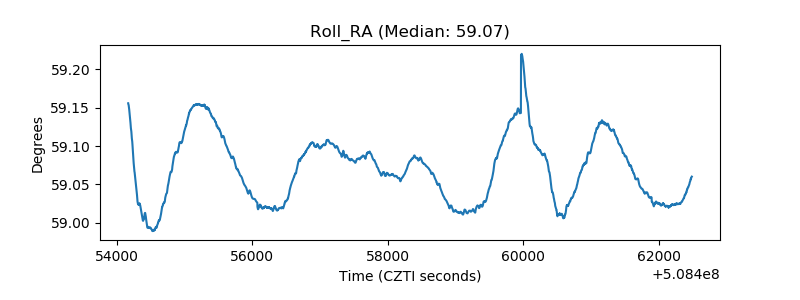 |
| Veto Counter | 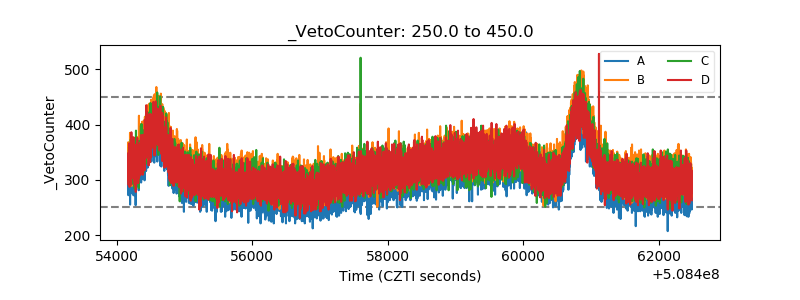 |